
Spring Dead Spot
Spring dead spot symptoms appear in circular patches from 6 inches to several feet in diameter that remain dormant as the turf greens up in the spring. These patches eventually die and collapse to the soil surface. The roots, stolons, and rhizomes are dark and rotten in affected areas. Spring dead spot patches recur in the same spot each year and increase in size by up to several inches each season. As the patches expand, the centers are sometimes re-established with bermudagrass or weedy species, resulting in a ring-like appearance. Recovery of the patches occurs by spread of the bermudagrass from the outside. This process is very slow, taking the entire growing season in severe situations. The spring dead spot patches greatly detract from the uniformity of the playing surface and are frequently invaded by weeds. Spring dead spot may also occur in certain varieties of zoysiagrass, such as ‘Meyer’ and ‘El Toro’.
Development Factors
Spring dead spot is most evident on intensely managed bermudagrass, such as athletic fields and golf courses. The disease typically takes 3 to 5 years to become established in a new bermudagrass stand. Unlike take-all patch, spring dead spot does not decline in severity as the turf matures. It becomes more severe if left unmanaged.
The spring dead spot fungus attacks the roots, rhizomes, and stolons of bermudagrass during the fall and winter. This activity does not directly kill the plant, but instead makes the bermudagrass more susceptible to freezing injury. As a result, spring dead spot is most severe in the northern range of bermudagrass adaptation and is usually more severe after extremely cold winters.
Any factor that restricts bermudagrass root growth or increases its susceptibility to winter injury will also enhance the disease. Excessive nitrogen, potassium deficiencies, poor soil drainage, over-irrigation, excessive thatch accumulation, and soil compaction have been shown to encourage disease development. The impact of soil pH on spring dead spot development in bermudagrass is not well understood.
Cultural Control
Fertilize to meet the nutritional needs of the turf, but do not apply excessive rates of nitrogen. Do not apply nitrogen within 6 weeks of winter dormancy, and do not exceed more than 1 pound of nitrogen per 1,000 square feet per application at any time during the growing season. Reduce thatch buildup and relieve soil compaction through aggressive aerification and vertical mowing. Areas that are severely affected by spring dead spot should be hollow-tine aerified at least three times per year, during the summer when bermudagrass is most actively growing. Golf greens should also be topdressed along with aerification to control thatch accumulation.
The impact of soil pH on spring dead spot development is unclear at this time. Past recommendations focused on the use of acidifying nitrogen sources like ammonium sulfate to manage this disease. However, recent research at NC State University has shown that different spring dead spot pathogens respond differently to nitrogen sources. Ophiosphaerella korrae, the most common pathogen in the eastern United States was controlled effectively by application of calcium nitrate as the sole nitrogen source. On the other hand, O. herpotricha, the most common pathogen in Midwestern states, was suppressed by ammonium sulfate. Fall applications of potassium, which have been frequently recommended for spring dead spot management, had no effect on the disease in our research.
Once the symptoms of spring dead spot appear, the only means of control is to encourage the spread of bermudagrass into the affected patches. Frequent spiking or aerification is recommended to break up the mat of dead turf in affected patches. Dinitroaniline (DNA) herbicides, which are commonly used for preemergent control of annual grasses, can slow the recovery of bermudagrass from spring dead spot injury and should not be used in sites with a history of the disease.
Chemical Control
Fungicides are available for spring dead spot control, but they must be applied preventatively in the fall. Applications are most effective when soil temperatures are between 60 and 80°F. To move the fungicide into the root zone, apply in a high volume of water (5 gallons per 1,000 square feet) or water in with at least 1/8” of irrigation immediately after application. Repeat applications at high label rates may be necessary in severely affected areas. Affected areas should be mapped in the spring for treatment in the fall to reduce fungicide expenditures.
* Products marked with an asterisk are not labeled for home lawn use.
| Fungicide and Formulation1 | Amount of Formulation2 | Application Interval (Days)3 | Efficacy Rating | Resistance Risk | FRAC Code4 |
| azoxystrobin (Heritage TL) | 2 | 14 to 28 | + | Low | 11 |
| azoxystrobin + acibenzolar-S-methyl (Heritage Action)* | 0.2 to 0.4 | 14 to 28 | + | Low | 11/P01 |
| azoxystrobin + propiconazole (Headway) EC G |
3 2 to 4 lbs |
14 to 28 14 to 28 |
+++ | Low | 11/3 |
| azoxystrobin + propiconazole (Compendium) | 2.6 | 14 to 28 | +++ | Low | 11/3 |
| azoxystrobin + tebuconazole (Strobe T)* | 1.5 | 14 to 21 | ? | Low | 11/3 |
|
benzovindiflupyr + difenoconazole (Ascernity)* |
1.0 | 14 to 28 | ? | Low | 7/3 |
| chlorothalonil + iprodione + thiophanate methyl + tebuconazole (Enclave)* |
3 to 4 |
14 to 21 28 |
+++ | Low | M5/2/1/3 |
|
cyclobutrifluram (Trefinti SC) |
0.087 to 0.174 | 14 to 28 | ++++ | Low | 7 |
|
fluindapyr + flutriafol (Kalida) |
0.25 to 0.4 | 21 to 28 | +++ | Low | 7/3 |
| fluopyram + prothioconazole + propamocarb (Resilia)* | 4 | 14 to 28 | +++ | Low | 7/3/28 |
| fluoxastrobin + tebuconazole (Fame T)* | 0.45 to 0.9 | 21 to 28 | ++ | Low | 11/3 |
| flutriafol (Rayora)* | 0.7 to 1.4 | 21 to 28 | +++ | Low | 3 |
| isofetamid (Kabuto) | 0.5 to 3.2 | refer to label | ++++ | Low | 7 |
| isofetamid + tebuconazole (Tekken)* | 3 | 14 to 28 | ++++ | Low | 7/3 |
| mefentrifluconazole (Maxtima)* | 0.6 to 0.8 | 28 | ++++ | Low | 3 |
| mefentrifluconazole + pyraclostrobin (Navicon)* | 0.85 | 28 | ++++ | Low | 3/11 |
| myclobutanil (Eagle) | 2.4 | 28 (fall) | + | Low | 3 |
| penthiopyrad (Velista) | 0.5 to 0.7 | 28 | +++ | Low | 7 |
| propiconazole (Banner MAXX) | 4 | 30 | +++ | Low | 3 |
|
prothioconazole (Densicor)* |
0.196 | 14 to 28 | +++ | Low | 3 |
| pydiflumetofen (Posterity)* | 0.16 to 0.32 | 28 | ++++ | Low | 7 |
|
pydiflumetofen + azoxystrobin + propiconazole (Posterity Forte)* |
0.63 to 0.84 | 14 to 28 | ++++ | Low | 7/11/3 |
|
pydiflumetofen + azoxystrobin + propiconazole (Posterity XT)* |
3 | 28 | ++++ | Low | 7/11/3 |
| tebuconazole (Torque)* (Mirage)* |
0.6 to 1.1 2 |
21 28 |
++ | Low | 3 |
| thiophanate-methyl (3336) (3336 G) |
4 to 6 6 to 9 lbs |
14 14 |
+ | Low | 1 |
| 1 Other trade names with the same active ingredients are labeled for use on turfgrasses and can be used according to label directions. 2 Units are oz, fl oz, or lb depending on formulation. Apply fungicides in 2 to 5 gallons of water per 1,000 square feet according to label directions. Use lower rates for preventive and higher rates for curative applications. 3 Use shorter intervals when conditions are very favorable for disease. 4 Fungicide Resistance Action Committee code. Products with same code have the same mode of action and are in the same chemical class. * Products marked with an asterisk are not labeled for home lawn use. |
|||||
| Efficacy Rating ++++ = excellent control when conditions are highly favorable for disease development +++ = good control when disease pressure is high, excellent control when disease pressure is moderate ++ = good control when disease pressure is moderate, excellent control when disease pressure is low + = good control when disease pressure is low ? = not rated due to insufficient data |
|||||
| Resistance Risk Low = Rotate to different chemical class after 3-4 applications; tank mixing not necessary Medium = Rotate to different chemical class after 1-2 applications; tank-mixing with low or medium risk product recommended High = Rotate to different chemical class after EVERY application; tank-mix with low or medium risk product for EVERY application ? = not rated due to insufficient data |
|||||
Species Data
- HOST SPECIES
- bermudagrass, zoysiagrass
- MONTHS WITH SYMPTOMS
- April to September
- STAND SYMPTOMS
- spots, circles, patches (6 inches to greater than 3 feet), rings
Figure 1, Figure 2, Figure 3, Figure 4, Figure 5, Figure 6, Figure 7, Figure 8, Figure 9, Figure 10, Figure 11, Figure 12, Figure 13, Figure 14, Figure 15, Figure 16, Figure 17, Figure 18, Figure 19, Figure 20, Figure 21, Figure 22, Figure 23, Figure 24, Figure 25, Figure 26
- spots, circles, patches (6 inches to greater than 3 feet), rings
- FOLIAR SYMPTOMS LOCATION / SHAPE
- blighting of entire leaves
- FOLIAR SYMPTOMS COLOR
- tan, yellow, orange
- ROOT / CROWN SYMPTOMS
- roots, stolons, rhizomes, and/or crowns dark brown or black
Figure 27, Figure 28
- roots, stolons, rhizomes, and/or crowns dark brown or black
- FUNGAL SIGNS
- none

Figure 1. Spring dead spot stand symptoms.
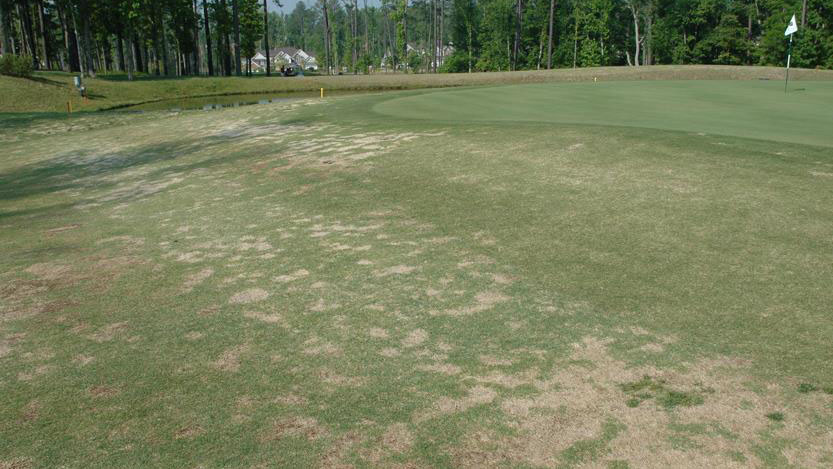
Figure 2. Spring dead spot stand symptoms.
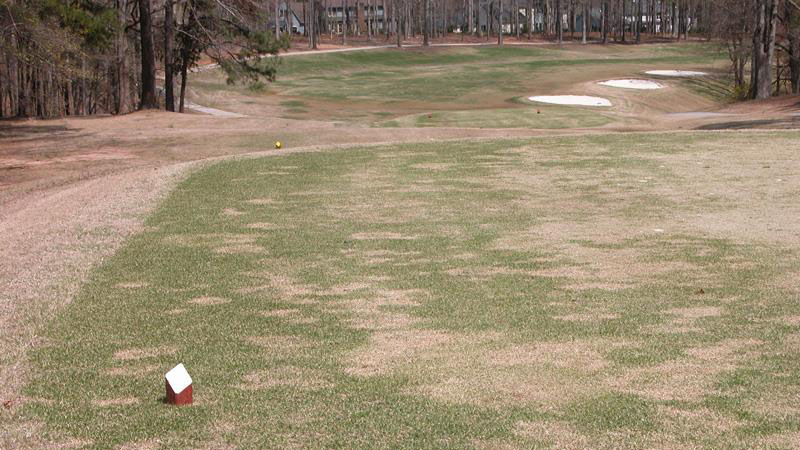
Figure 3. Spring dead spot stand symptoms.
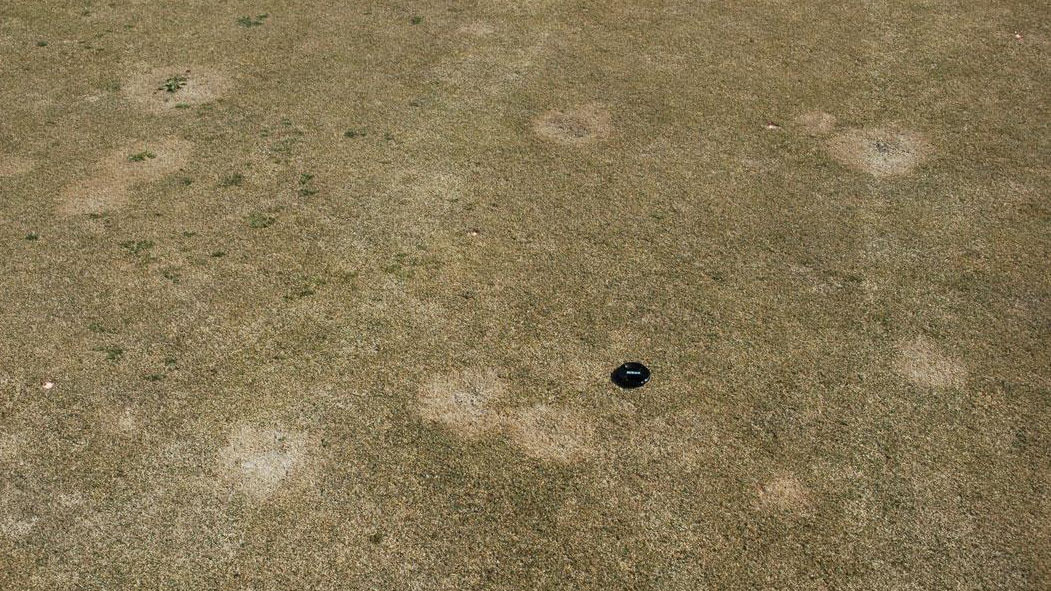
Figure 4. Spring dead spot stand symptoms.

Figure 5. Spring dead spot stand symptoms.
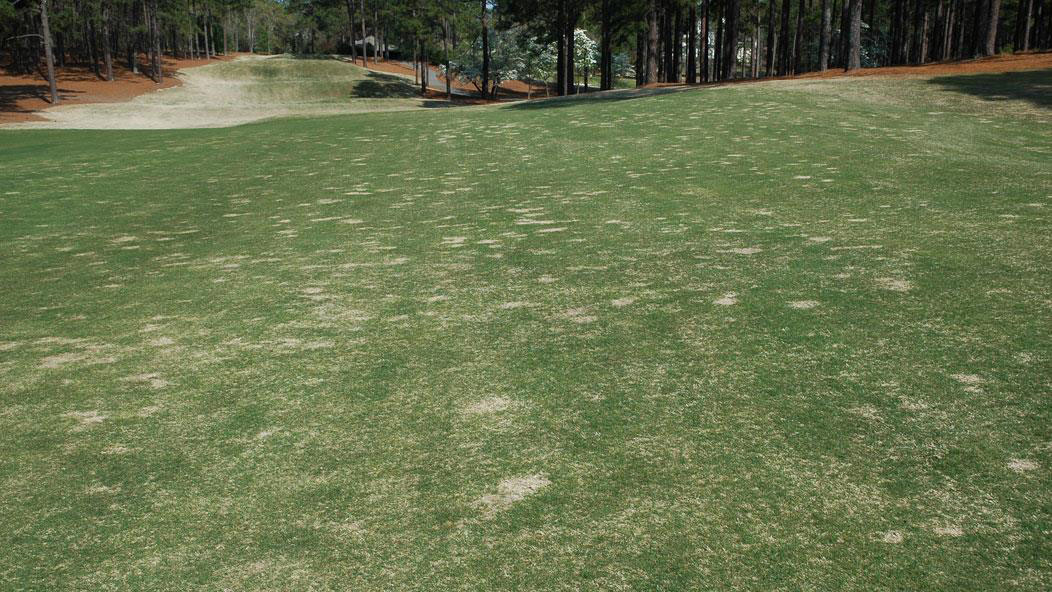
Figure 6. Spring dead spot stand symptoms.
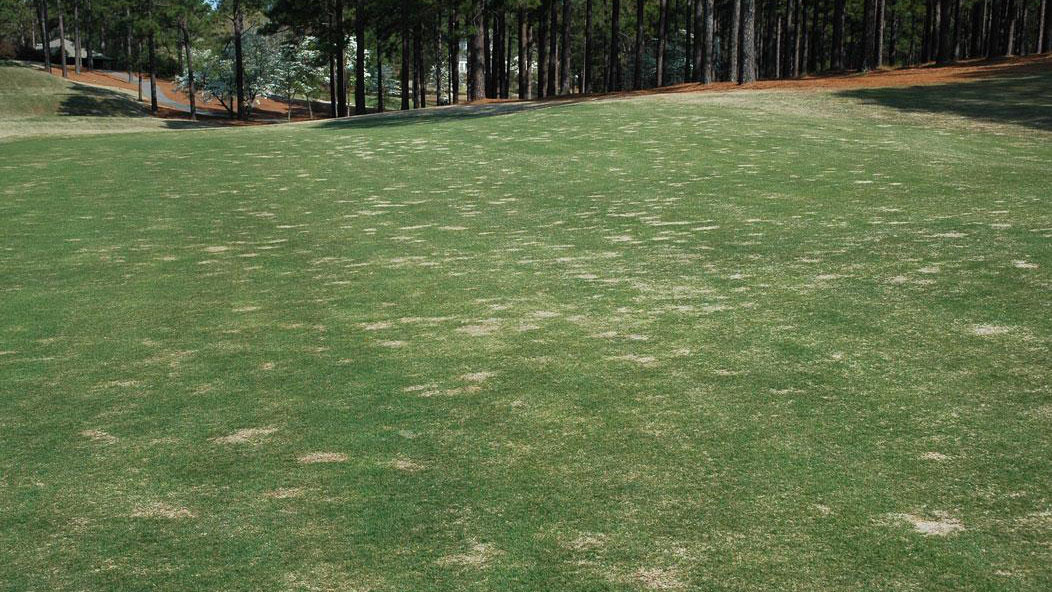
Figure 7. Spring dead spot stand symptoms.
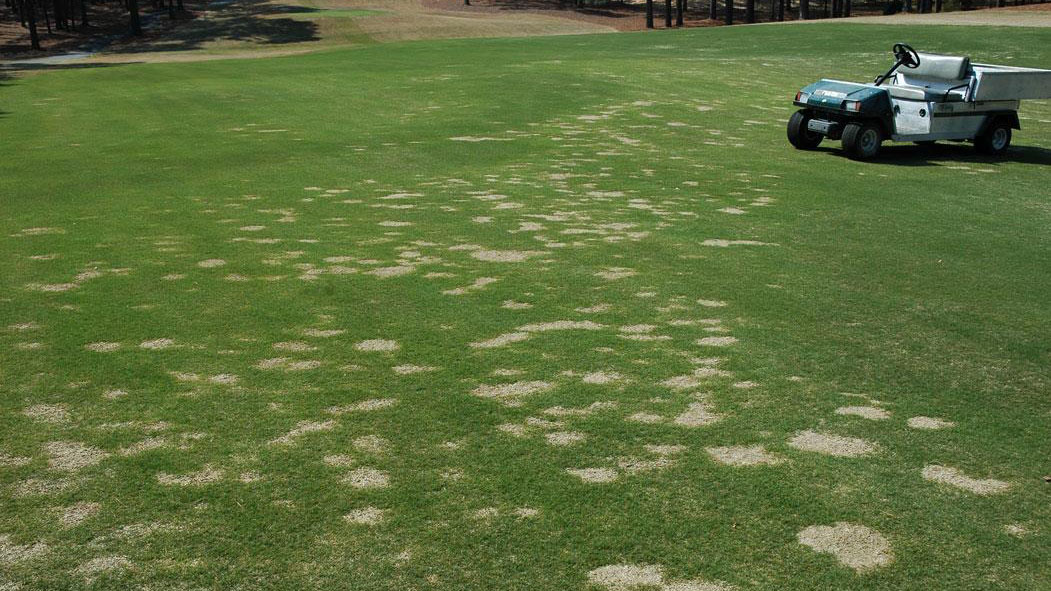
Figure 8. Spring dead spot stand symptoms.
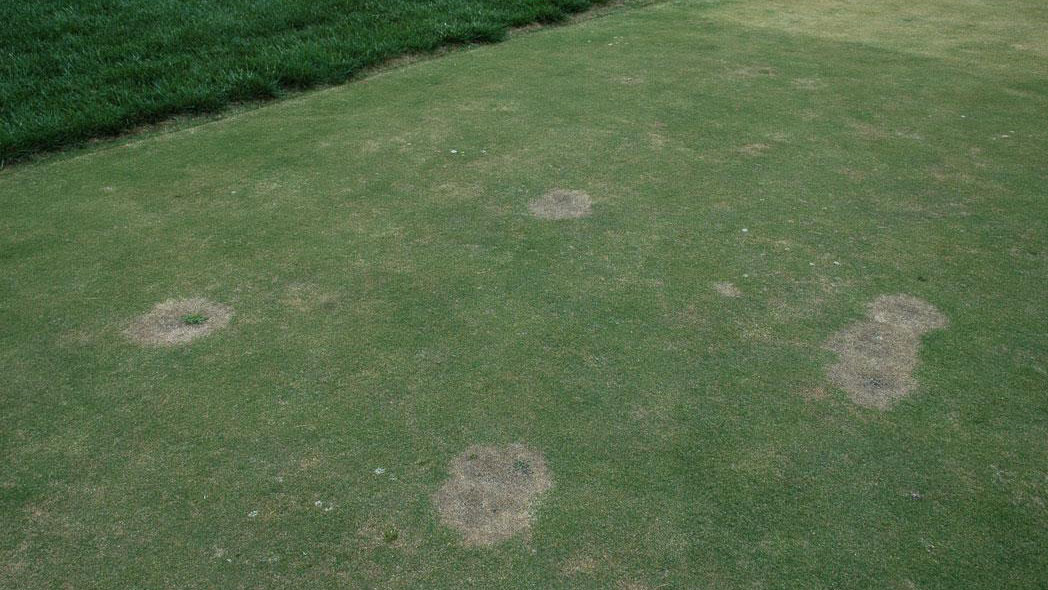
Figure 9. Spring dead spot stand symptoms.
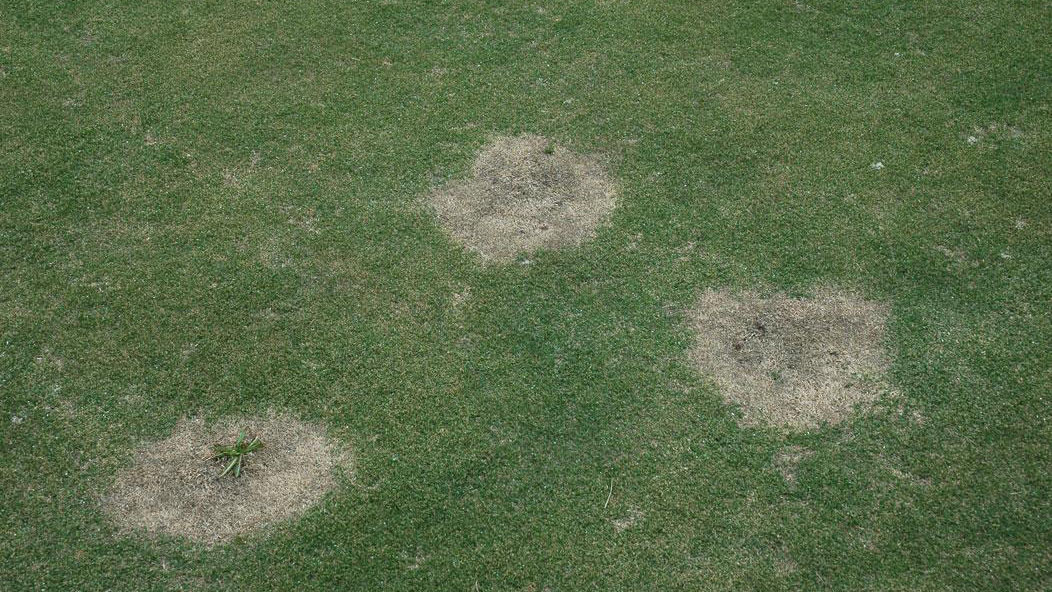
Figure 10. Spring dead spot stand symptoms.
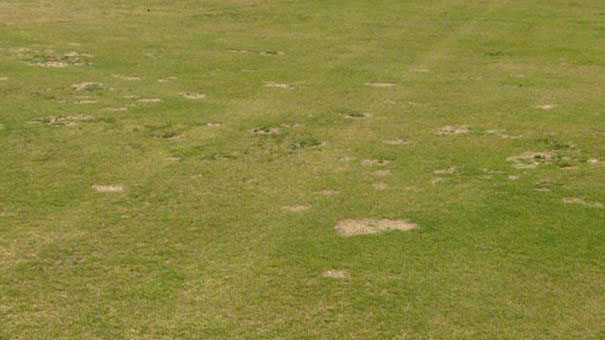
Figure 11. Spring dead spot stand symptoms.
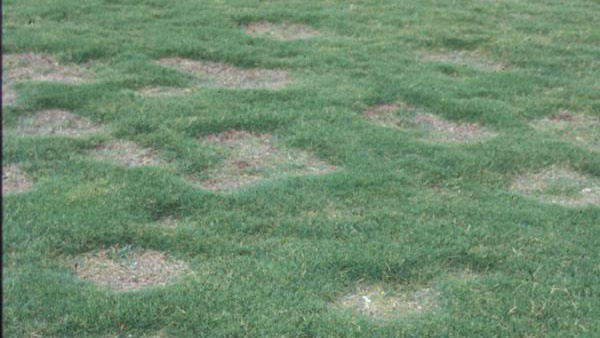
Figure 12. Spring dead spot stand symptoms.
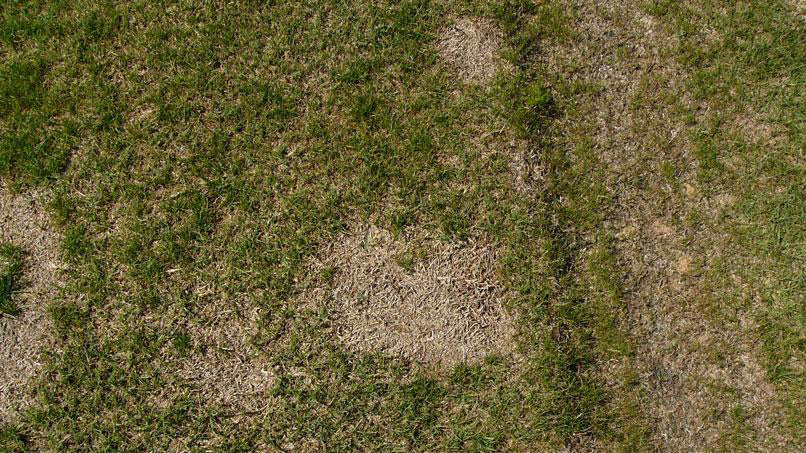
Figure 13. Spring dead spot stand symptoms.
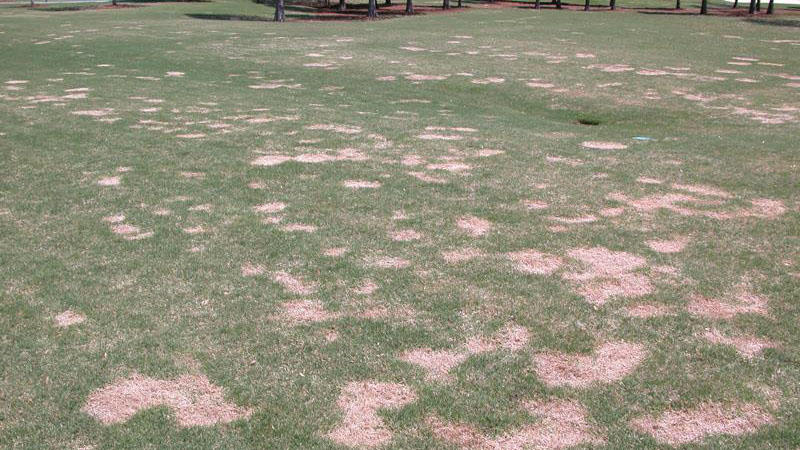
Figure 14. Spring dead spot stand symptoms.
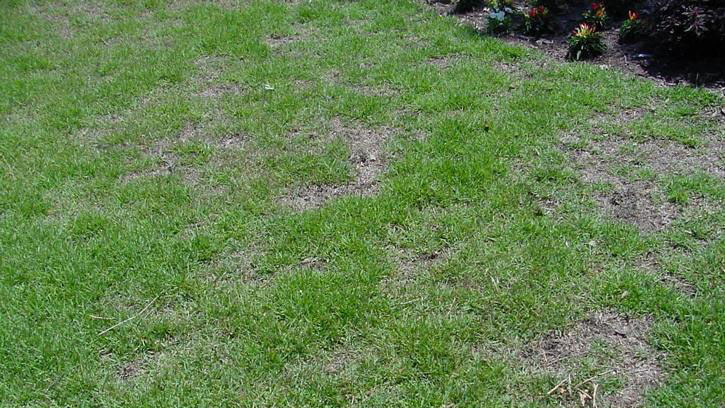
Figure 15. Spring dead spot stand symptoms.
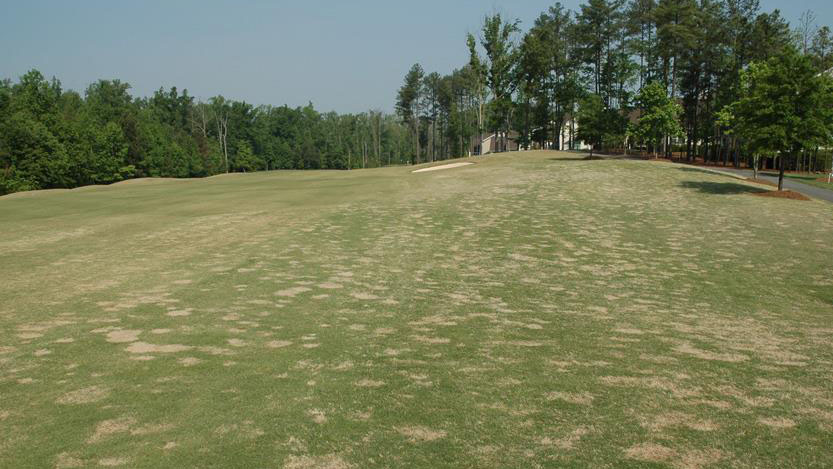
Figure 16. Spring dead spot stand symptoms.
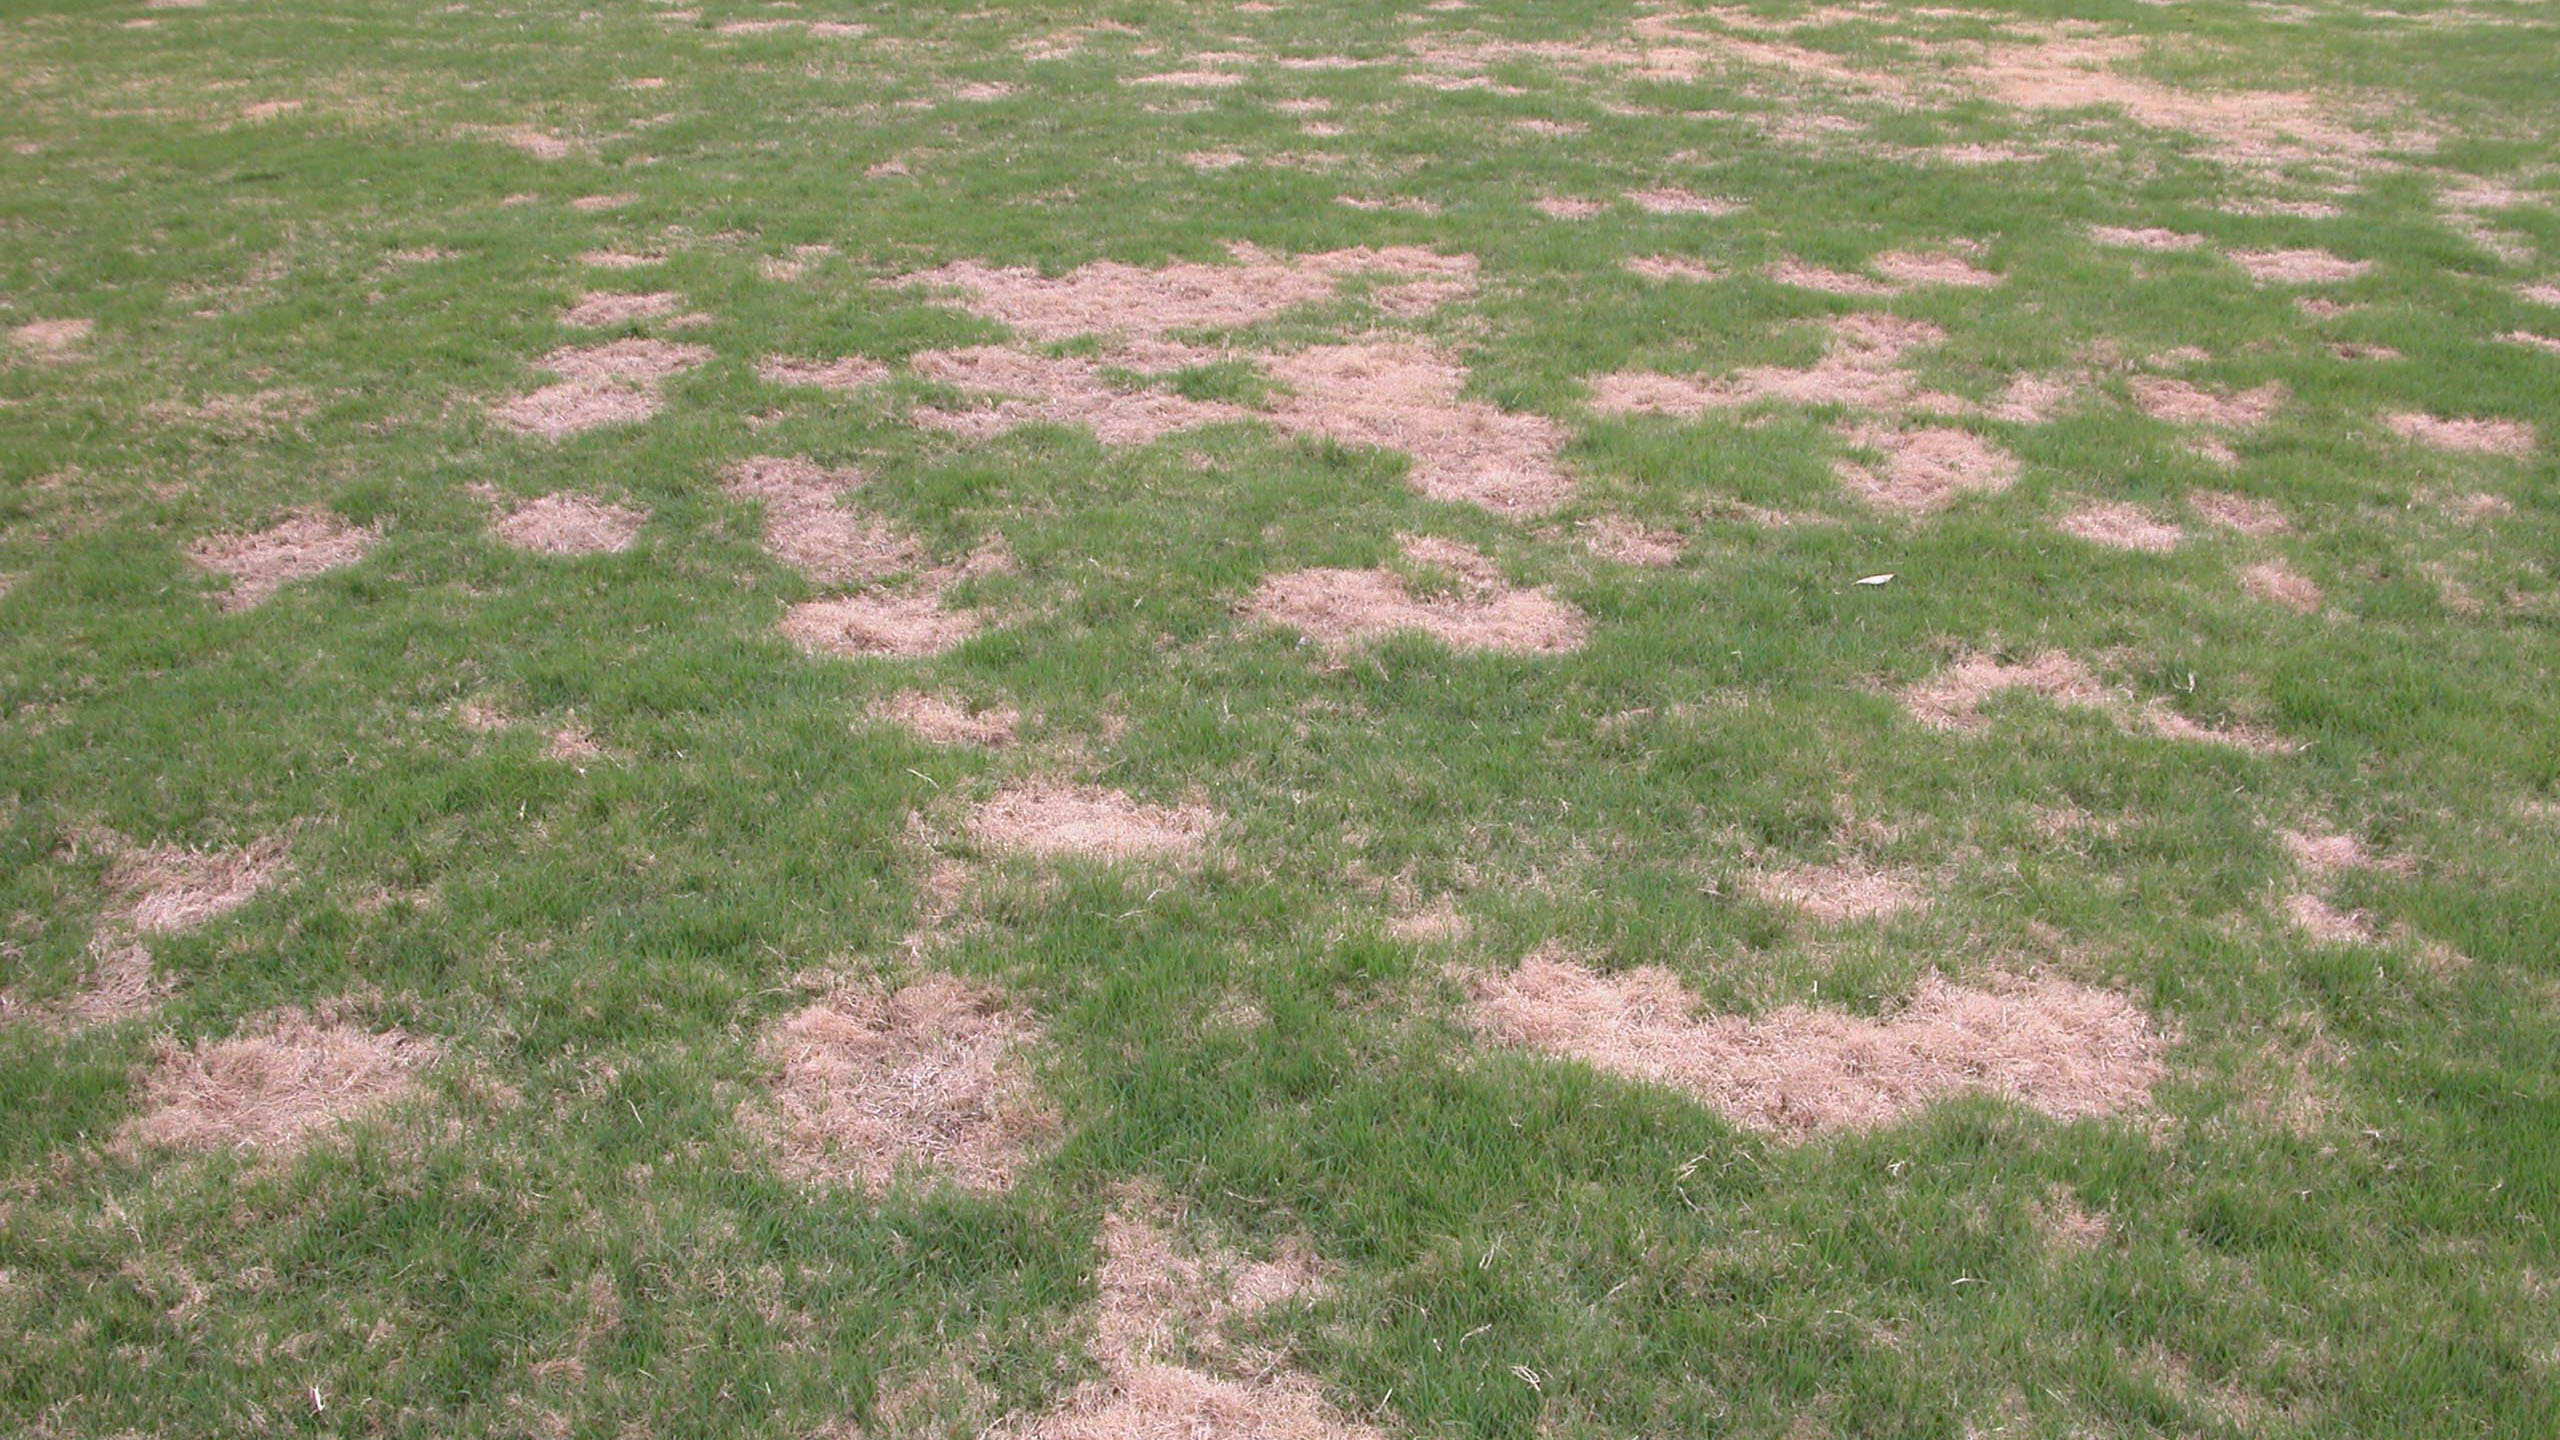
Figure 17. Spring dead spot stand symptoms.
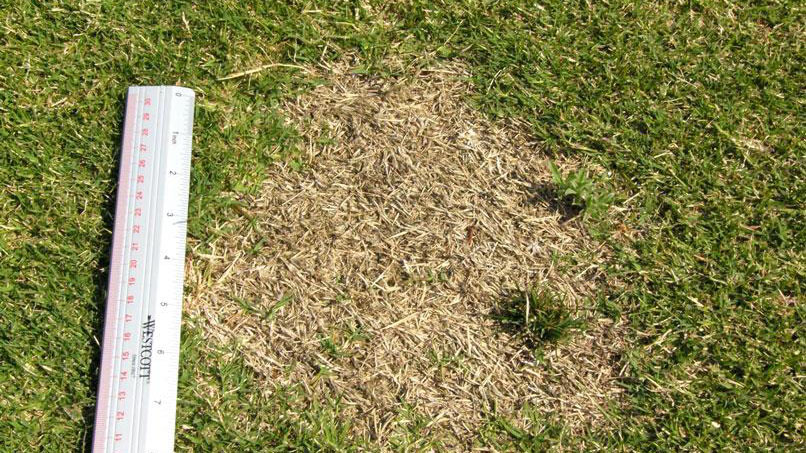
Figure 18. Spring dead spot stand symptoms.

Figure 19. Spring dead spot stand symptoms.
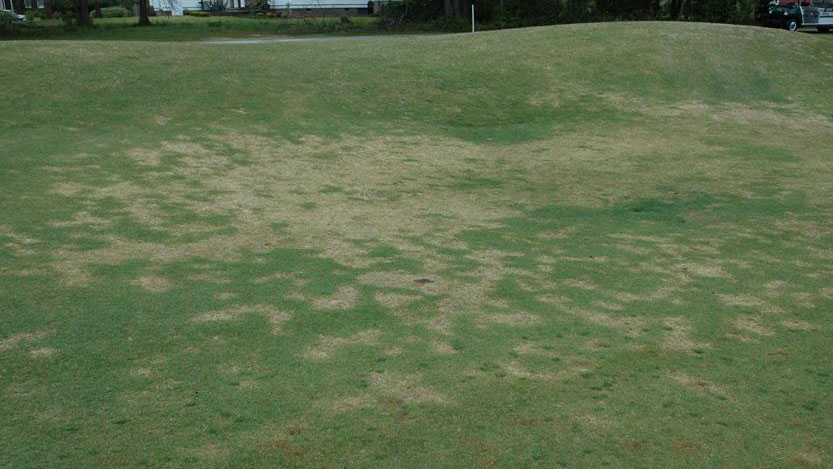
Figure 20. Spring dead spot stand symptoms.
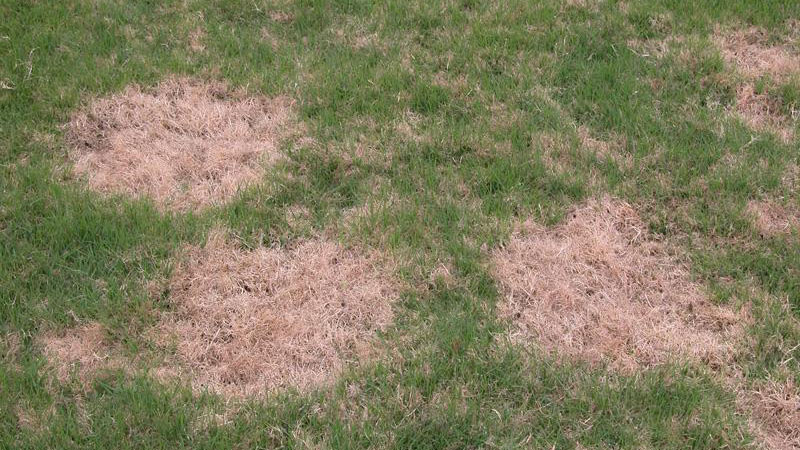
Figure 21. Spring dead spot stand symptoms.
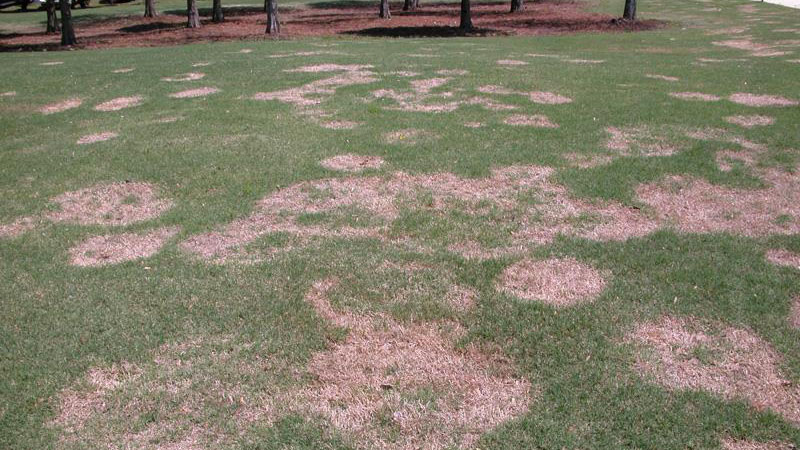
Figure 22. Spring dead spot stand symptoms.
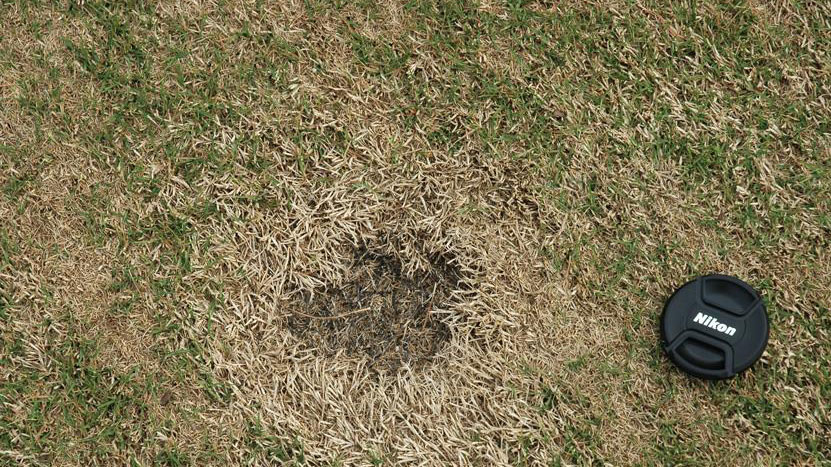
Figure 23. Spring dead spot stand symptoms.
Figure 24. Spring dead spot stand symptoms.
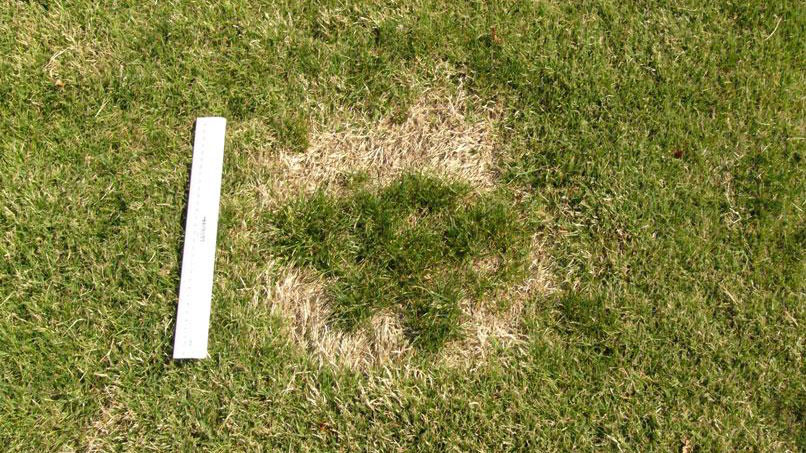
Figure 25. Spring dead spot stand symptoms.
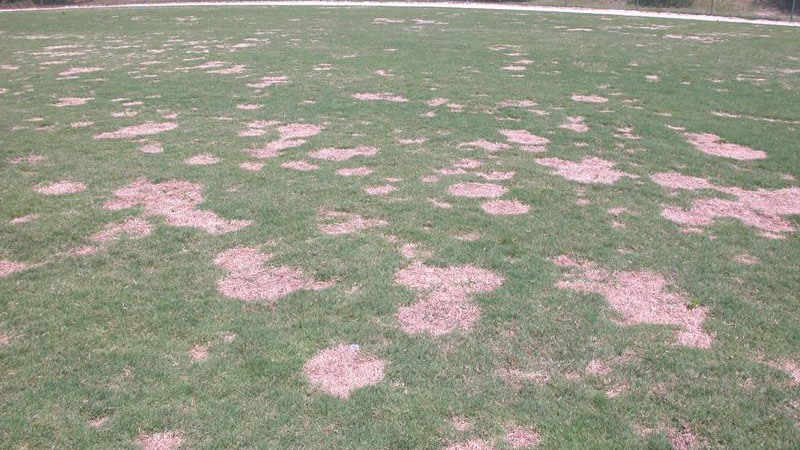
Figure 26. Spring dead spot stand symptoms.
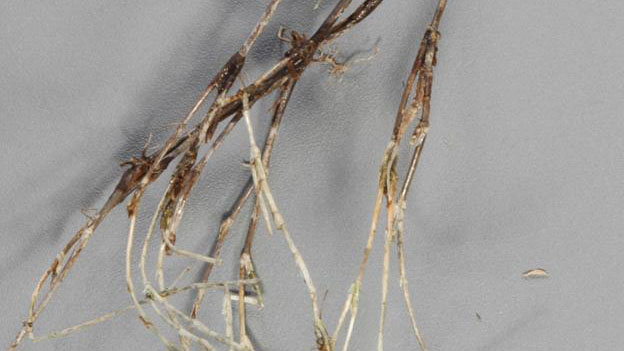
Figure 27. Spring dead spot root / crown symptoms.

Figure 28. Spring dead spot root / crown symptoms.
Publication date: Nov. 14, 2017
Reviewed/Revised: Dec. 16, 2019
Recommendations for the use of agricultural chemicals are included in this publication as a convenience to the reader. The use of brand names and any mention or listing of commercial products or services in this publication does not imply endorsement by NC State University or N.C. A&T State University nor discrimination against similar products or services not mentioned. Individuals who use agricultural chemicals are responsible for ensuring that the intended use complies with current regulations and conforms to the product label. Be sure to obtain current information about usage regulations and examine a current product label before applying any chemical. For assistance, contact your local N.C. Cooperative Extension county center.
N.C. Cooperative Extension prohibits discrimination and harassment regardless of age, color, disability, family and marital status, gender identity, national origin, political beliefs, race, religion, sex (including pregnancy), sexual orientation and veteran status.