
Contents
References and Related Publications
Appendix II: General Standard Procedures of Experimentation
The research reported in this publication was funded by the North Carolina Agricultural Research Service (NCARS) and by the United States Department of Agriculture, Agricultural Research Service (USDA-ARS) as part of a joint forage-animal research program. Mention of trade names, proprietary products, or specific equipment does not constitute a guarantee or warranty by either NCARS or USDA-ARS and does not imply its approval to the exclusion of other products that may be suitable.
Photographs courtesy of the NCARS and the USDA-ARS.
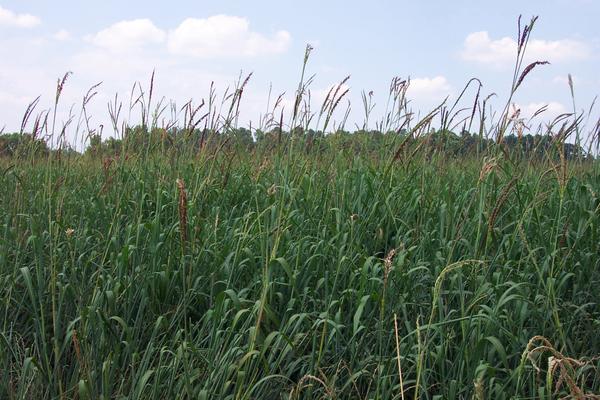
Gamagrass.
NCARS and USDA-ARS
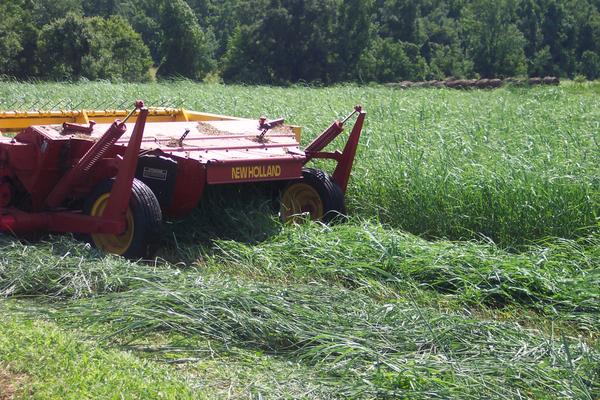
Immature Switchgrass.
NCARS and USDA-ARS

Mature Switchgrass.
NCARS and USDA-ARS
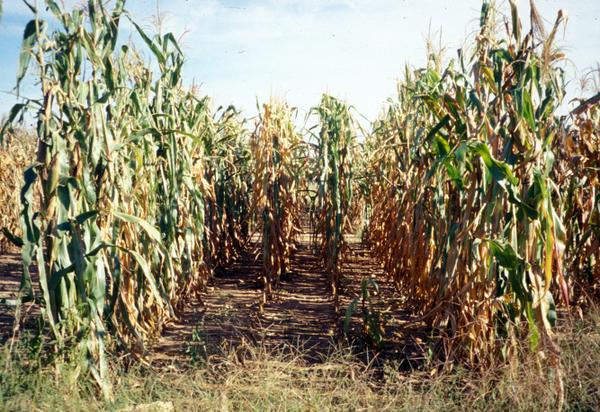
Corn Cultivar.
NCARS and USDA-ARS
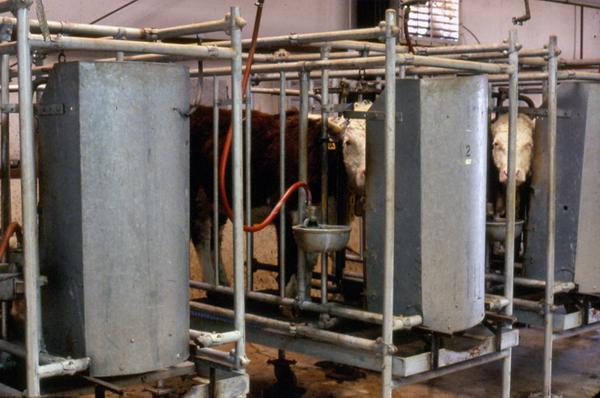
Digestion Facilities.
NCARS and USDA-ARS
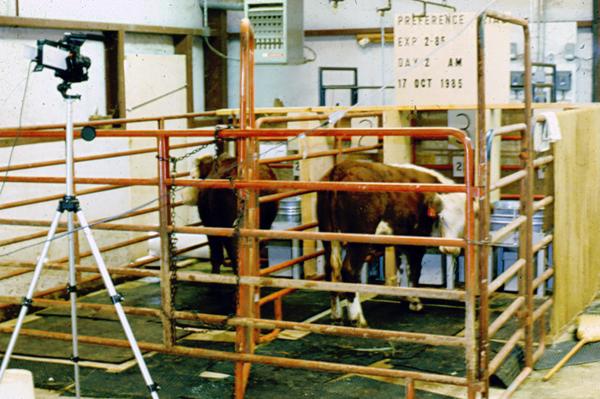
Preference Facilities.
NCARS and USDA-ARS
Abstract
The dry matter yield of perennial, native warm-season grasses increases with advancing maturity through heading. The nutritive value of the forage, however, declines during this process. Especially evident is the decline in crude protein and increase in neutral detergent fiber. In this bulletin, we summarize the results of three experiments that involve either eastern gamagrass or switchgrass when supplemented with crude protein and energy (grain) to improve their nutritive value and subsequent quality (greater animal response). In a fourth experiment, we examined the supplementation of silages of annual temperate and tropical corns, which may be limited in crude protein and differ in energy concentration. We also addressed steers’ potential preferences among the silages from six annual forages consisting of one temperate and two tropical corns, two forage sorghums, and one pearlmillet.
We present original research data in a summarized format, with associated methodology for future reference. We include a brief Results and Discussion section for each experiment, followed by a Summary section highlighting the major findings. Consequently, we direct the interested reader to these sections for an assessment of the findings that are not reiterated elsewhere.
Introduction
The native, perennial warm-season grasses, although productive, frequently lack sufficient crude protein and energy concentrations for acceptable animal performance. This becomes increasingly important with advancing plant maturity, and especially when the grass exhibits greater stem-to-leaf proportions. Even annual tropical corn cultivars lack adequate energy concentration despite a greater proportion of the whole plant dry matter consisting of leaf and stem tissue as opposed to the grain component normally present in temperate corn cultivars.
In this bulletin, we present animal response data from four separate experiments in which we examined the use of a crude protein and corn (grain) supplement under a specific set of forage conditions within each experiment. We evaluated gamagrass (Tripsacum dactyloides [L. L.]), a perennial, leafy, native, warm-season grass, in Experiment 1 at three concentrations of crude protein (CP). Switchgrass (Panicum virgatum L.), also a perennial, native, warm-season grass, but with an appreciable stem component, was evaluated as a common hay source with supplementation in Experiment 2 and as an immature and mature forage in Experiment 3. In Experiment 4, we conducted two studies: In one study (Experiment 4A), we compared temperate and tropical corn (Zea mays L.) silages for animal digestibility responses over a range of corn (grain) supplementation. In the second study (Experiment 4B), we compared the steers’ preferences among six silages from an annual temperate corn, two tropical corns, two forage-type sorghums (Sorghum bicolor [L.] Moench), and a pearlmillet (Pennisetum americanum [L.] Leeke, previously Pennisetum glaucum [L.] R. Br.). We use the term nutritive value to refer to plant composition, whereas the term quality refers to animal responses based on the nutritive value of the forage.
Experiment 1. Gamagrass Hay Supplemented with Two Levels of Crude Protein: Dry Matter Intake and Digestibility
Gamagrass is a native, perennial warm-season grass that has potential as either a pasture forage or as a stored (hay or silage) crop in the Mid-Atlantic region. Gamagrass has a greater proportion of leaf than stem, and the leaves are rather broad compared with most perennial grasses. When used as a stored crop, gamagrass dry matter yield potential increases if cutting is delayed until the onset of heading. At this stage of maturity, however, crude protein (CP) concentrations are generally decreased and may not be adequate for acceptable animal performance. In this experiment we examined the quality of gamagrass hay harvested in the heading stage and fed with and without CP supplements.
Materials and Methods
A well-established field of ‘Iuka’ gamagrass served as the experimental site. The field was flail harvested to a 3-inch stubble on March 13 to remove all residual forage and then top-dressed on March 14 with ammonium nitrate at 80 lb/acre of actual nitrogen. The gamagrass was then cut on June 9 at heading (20% heads had seeds forming) with a conventional hay conditioner set to leave a 4-inch stubble. The forage was field cured and subsequently baled with a conventional square baler. The bales were transported to an experimental hay barn and stored on wooden pallets until processed for feeding (see Appendix GP-1 for details).
We evaluated CP supplementation (S) using three treatments:
- Control (S-0)—No CP supplement; hay fed with natural CP concentrations (CP = 8.32%)
- Supplement 1 (S-1)—CP supplement fed at 1.61 lb/head/day (CP = 15.1%)
- Supplement 2 (S-2)—CP supplement fed at 1.61 lb/head/day (CP = 29.3%)
Although the two isocaloric CP supplements were fed at similar amounts per day, the S-2 supplement had 4.36 times more soybean oil meal and double the urea content compared with the S-1 supplement (Appendix Table 1.1).
At each morning feeding, the appropriate steer was provided 1.61 lb of supplement weighed into plastic containers and placed in its hay manger for consumption. After the supplement was consumed, hay was then fed ad libitum to all the experimental steers (see Appendix GP-2 for details). We determined the nutritive value of the hay and weighback according to general laboratory procedures (Appendix GP-6).
The experiment was a randomized complete block design with five steers (replicates) per treatment. Fifteen steers were blocked by weight into five groups of three steers each. The three steers within a group were then randomly assigned to one of the three crude protein treatments. We analyzed the data according to the design and examined the treatments’ main effects by an orthogonal set of contrasts (Appendix GP-7).
Results and Discussion
Steers were fed at a similar daily ad libitum level averaging 12.9% in excess of consumption (Table 1.1). The nutritive values of the corn and soybean oil meal fed as supplements reflect their natural energy and CP characteristics (Table 1.2). Consumption per day of hay was greater for S-0. When the weight of hay and supplement were added, however, the daily dry matter consumption and DMI on a body weight basis were similar among treatments (Table 1.1). Supplementation, compared with no supplementation, increased both dry matter digestion (DMD) and digestible dry matter intake (DDMI), but there were no differences between supplements in either variable (Table 1.1).
The nutritive value of the as-fed hays, although from a common source, indicates that some differences occurred among the three supplement treatments in in vitro true dry matter disappearance (IVTD), neutral detergent fiber (NDF), acid detergent fiber (ADF), and cellulose (CELL) (Table 1.2). These differences, however, were very small and were not considered biologically important. It is note-worthy that some selective consumption apparently occurred as the weigh-back samples were consistently lesser in IVTD and CP and greater in NDF and constituent fiber fractions (Table 1.2). This shift would be consistent with selective consumption of the leafy portion of the hay.
Fecal composition also reflected supplementation of the hay diet: increasing the CP supplementation from S-0 to S-2 increased the CP concentration in the feces (Table 1.3). This result indicates an increasing reduction in nitrogen use efficiency at greater CP levels.
Summary and Conclusion
- The dry matter intake of the headed gamagrass was not altered significantly.
- The addition of the S-1 supplement significantly increased dry matter digestion compared with S-0, but no benefit was noted over S-1 when fed S-2.
The positive influence of CP supplementation (S-1 and S-2) on dry matter digestion resulted in greater digestible dry matter intake from supplementation, but not between supplementation levels (S-1 and S-2).
| Treatment1 |
Steer Weight (lb) |
Daily Intake |
DMI (lb/ 100 lb) |
DMD (%) |
DDMI (lb/100 lb) |
|||
|---|---|---|---|---|---|---|---|---|
| Ad Lib.2 (%) | Hay (lb) | S (lb) | Hay + S (lb) | |||||
| S-0 | 5963 | 12.8 | 12.3 | 0.00 | 12.2 | 2.04 | 53.7 | 1.10 |
| S-1 | 599 | 13.0 | 10.8 | 1.61 | 12.4 | 2.06 | 55.8 | 1.30 |
| S-2 |
614 |
12.8 | 11.5 | 1.61 | 13.1 | 2.13 |
56.4 |
1.35 |
| Significance (P): | ||||||||
| Treatment | 0.51 | 0.79 | 0.02 | -- | 0.97 | 0.56 | 0.12 | <0.01 |
| S-0 vs. (S-1 + S-2) | 0.47 | 0.63 | 0.01 | -- | 0.11 | 0.47 | 0.05 | <0.01 |
| S-1 vs. S-2 | 0.38 | 0.65 | 0.11 | -- | 0.11 | 0.44 | 0.62 | 0.37 |
|
1 S-0 = No supplement (CP of hay = 8.32%); S-1 = supplement fed with lesser CP concentration; S-2 = supplement fed with greater CP concentration.↵ 2 Ad Lib. = ad libitum.↵ 3 Each value is the mean of five steers (n = 5).↵ |
||||||||
| Treatment2,3 | IVTD | CP | NDF | ADF | CELL | Lignin | ||||||
|---|---|---|---|---|---|---|---|---|---|---|---|---|
| AF % | WB % | AF % | WB % | AF % | WB % | AF % | WB % | AF % | WB % | AF % | WB % | |
| S-0 | 64.4 | 61.7 | 7.58 | 4.70 | 77.8 | 81.4 | 41.5 | 47.1 | 35.7 | 40.7 | 4.74 | 5.28 |
| S-1 | 65.0 | 63.0 | 7.55 | 4.40 | 78.8 | 82.4 | 42.0 | 47.7 | 36.4 | 41.5 | 4.68 | 5.13 |
| S-2 | 64.4 | 62.2 | 7.71 | 4.96 | 78.0 | 80.8 | 41.7 | 46.5 | 36.0 | 40.1 | 4.75 | 5.23 |
| Significance (P): | ||||||||||||
| Treatment | 0.04 | 0.10 | 0.69 | 0.43 | 0.03 | 0.10 | 0.11 | 0.20 | 0.02 | 0.13 | 0.10 | 0.28 |
| S-0 vs. (S-1+S-2) | 0.12 | 0.07 | 0.75 | 0.96 | 0.07 | 0.63 | 0.07 | 0.95 | 0.02 | 0.90 | 0.43 | 0.19 |
| S-1 vs. S-2 | 0.03 | 0.17 | 0.44 | 0.21 | 0.03 | 0.04 | 0.30 | 0.09 | 0.07 | 0.05 | 0.05 | 0.30 |
|
1 IVTD = in vitro true dry matter disappearance; CP = crude protein; NDF = neutral detergent fiber; ADF = acid detergent fiber; CELL = cellulose.↵ 2 S-0 = no supplement (crude protein of hay = 8.32 ); S-1 = supplement fed with lesser crude protein concentration; S-2 = supplement fed with greater crude protein concentration.↵ 3 Each value is the mean of five steers (n = 5).↵ |
||||||||||||
| Treatment2 | CP % | NDF % | Fiber Fractions | |||||||||
|---|---|---|---|---|---|---|---|---|---|---|---|---|
| ADF % | CELL % | Lignin % | ||||||||||
| S-0 | 9.473 | 67.3 | 35.8 | 26.0 | 8.68 | |||||||
| S-1 | 10.04 | 67.0 | 36.2 | 26.4 | 8.58 | |||||||
| S-2 | 10.75 | 67.5 | 36.0 | 26.2 | 8.72 | |||||||
| Significance (P): | ||||||||||||
| Treatment | <0.01 | 0.43 | 0.59 | 0.48 | 0.74 | |||||||
| S-0 vs. (S-1 + S-2) | <0.01 | 0.77 | 0.36 | 0.29 | 0.85 | |||||||
| S-1 vs. S-2 | 0.03 | 0.22 | 0.67 | 0.59 | 0.46 | |||||||
|
1NDF = neutral detergent fiber; ADF = acid detergent fiber; CELL = cellulose. ↵ 2S-0 = no supplement (CP of hay = 8.32%); S-1 = supplement with lesser CP concentration; S-2 = supplement fed with greater CP concentration. ↵ 3Each value is the mean of five steers (n = 5). ↵ |
||||||||||||
Experiment 2. Mature Switchgrass Hay Supplemented with Corn, Crude Protein, or Both: Dry Matter Intake and Digestibility
Switchgrass is a native, perennial warm-season grass that has potential as either pasture or a hay crop in the Mid-Atlantic region. Unlike gamagrass, switchgrass has a rather coarse stem component with modest leaf size. Like gamagrass, when used as a hay crop, switchgrass dry matter yield potential increases if cutting is delayed until the onset of heading. At this stage of maturity, however, crude protein concentrations have decreased and will probably not be adequate for acceptable animal performance. In this experiment we examined the quality of switchgrass hay harvested at the heading stage of maturity and fed with supplemental concentrates of either corn or soybean oil meal (SBOM), or both, to increase CP concentrations of the diet while keeping the energy concentrations similar.
Materials and Methods
A well-established field of ‘Alamo’ switchgrass served as the experimental site. The field was burned in late February and flail harvested to a 3-inch stubble to remove all residual forage and was then top-dressed in March with ammonium nitrate at 80 lb/acre of actual nitrogen. On August 29, at full heading, one batch of switchgrass was cut with a field chopper, blown into a self-unloading wagon, and transported to a bulk-hay drier and dried overnight. The next day the dried hay was baled directly out of the bulk drier with a conventional square baler. This was repeated August 30 to acquire sufficient hay for the experiment. The bales from the two cuttings were stored on wooden pallets in an experimental hay barn until processed for feeding (Appendix GP-1).
The three treatments we evaluated consisted of the natural concentrations of crude protein (CP) in the mature hay (CP = 4.01%) plus either a corn (CP = 8.7%) or SBOM (CP = 45.5%) supplement and a combination of both:
- H+C = Hay + Corn (0.21 lb CP)
- H+CS = Hay + Corn (0.10 lb CP) + SBOM (0.59 lb CP) for a total of 0.69 lb CP
- H+S = Hay + SBOM (1.16 lb CP)
The three supplements were isocaloric but varied in CP concentration and were fed at similar amounts per day. Each morning, each steer was provided the appropriate supplement weighed into a plastic container (2.36 lb of corn for H+C; 1.17 lb of corn and 1.30 lb of SBOM totaling 2.47 lb for H+CS; and 2.56 lb of SBOM for H+S) and placed in its hay manger for consumption. After the supplement was consumed, the bulk hay, common to all treatments, was then fed ad libitum to all the experimental steers. We conducted the intake and digestion phases according to normal procedures (Appendix GP-2). We determined the nutritive value of the hay and weighback and chemical composition of the urine and feces according to general laboratory procedures (Appendix GP-6). Fecal samples were further processed by separating into three particle-size classes according to GP-5.
The experiment was a randomized complete block design with four steers (replicates) per treatment. Twelve steers were blocked by weight into four groups of three steers each. The three steers within a group were then randomly assigned to one of the three crude protein treatments. We analyzed the data according to the design and examined the treatment main effect for the relationship between CP fed and animal response using trend analyses. These analyses consisted of estimating the linear response and the resulting lack of fit (i.e., the quadratic component) (Appendix GP-7).
Results and Discussion
Increasing the CP supplementation of the mature switchgrass hay did not alter DMI of steers, which averaged 8.09 lb/day or 1.79 lb/100 lb of body weight (Table 2.1). Furthermore, DMD was similar among CP supplementations of switchgrass, averaging 57.0%. Similar results were observed for DDMI, which averaged 1.02 lb/100 lb of body weight.
The nutritive values of the concentrates are presented in the upper portion of Table 2.2 with both corn and soybean oil meal averaging similar in in vitro dry matter disappearance (IVMD) but differing widely, as expected, in CP concentration. The nutritive value of pooled samples of the hay fed in the intake phase reflects the maturity of the switchgrass hay having an IVMD of only 30.9% with a CP concentration of only 4.75% and NDF of about 80%. The analysis of the weighback samples, consisting of only the hay, shows differences mainly in the linear decrease of CP concentration as supplementation of CP increased (lower portion of Table 2.2).
CP supplementation resulted in a significant increase of CP concentration in both urine and feces (Table 2.3). The CP concentration in urine increased quadratically, whereas the response was linear for feces. The NDF showed a quadratic response in feces with CP supplementation and is probably associated with the greater concentration of NDF in the corn constituent of the supplement, which was not present in the H+S treatment (Table 2.3). Both hemicellulose and cellulose concentrations showed linear responses with hemicellulose increasing and cellulose decreasing with increasing CP supplementation. These shifts, however, are probably of minor biological importance.
Separation of fecal dry matter into particle-size classes of large, medium, and small revealed no difference among CP supplementation for either medium or small particles. The former composed an average of 18.9% and the latter 79.9% of the total dry matter (Table 2.3). While the proportion of large particles was reduced linearly with increased CP supplementation, their proportion of the total dry matter constituted < 2% and is probably of little biological significance.
Summary and Conclusion
- Switchgrass, when fully headed, is of poor nutritive value averaging < 5.0% crude protein with a neutral detergent fiber concentration of about 80% and lignin concentrations of about 9%.
- Steers fed an increasing crude protein supplement (0.21 to 1.16 lb/day) composed of corn grain and soybean oil meal showed no significant increase in dry matter intake, dry matter digestibility, or digestible dry matter intake of mature switchgrass.
- The major response from crude protein supplementation was evident in the feces and urine with a linear increase from 6.45% to 8.78% in the feces and a quadratic increase in the urine from 1.03% to 5.96% to 5.22% for the respective supplementations of 0.21, 0.69, and 1.16 lb/day.
| Treatment | Steer WT1 (lb) | Hay2 | SUP | DMI | DMD (%) | DDMI | ||||||
|---|---|---|---|---|---|---|---|---|---|---|---|---|
| Item3 | CP (lb) | Fed (lb) | WB (lb) | INT (lb) | Ad Lib (%) | Fed (lb) | Daily (lb) | Animal (lb/ 100 lb) |
Daily (lb) | Animal (lb/ 100 lb) |
||
| H+C | 0.21 | 4524 | 6.85 | 1.29 | 5.56 | 18.5 | 2.36 | 7.98 | 1.75 | 54.9 | 4.35 | 0.96 |
| H+CS | 0.69 | 451 | 6.93 | 1.33 | 5.60 | 19.4 | 2.47 | 8.04 | 1.78 | 58.9 | 4.69 | 1.04 |
| H+S | 1.16 | 448 | 7.21 | 1.51 | 5.70 | 21.2 | 2.56 | 8.26 | 1.83 | 57.2 | 4.70 | 1.05 |
| Significance (P): | ||||||||||||
| Treatments | 0.95 | 0.94 | 0.51 | 0.99 | 0.13 | -- | 0.95 | 0.86 | 0.47 | 0.77 |
0.63 |
|
| Crude Protein: | ||||||||||||
| Linear | 0.77 | 0.75 | 0.29 | 0.88 | 0.06 | -- | 0.77 | 0.60 | 0.49 | 0.54 | 0.39 | |
| Lack of fit | 0.91 | 0.92 | 0.70 | 0.97 | 0.71 | -- | 0.92 | 0.92 | 0.32 | 0.73 | 0.72 | |
|
1WT = weight. ↵ 2WB = weighback; INT = intake; Ad Lib = ad libitum. ↵ 3H = hay; C = corn; S = soybean oil meal. ↵ 4Each value is the mean of four steers (n = 4). ↵ |
||||||||||||
| Treatment2 | IVMD (%) | CP (%) | NDF (%) | Fiber Fractions (%) | CELL (%) | Lignin (%) | |||
|---|---|---|---|---|---|---|---|---|---|
| Item | CP (lb) | HEMI (%) | ADF (%) | ||||||
| Concentrate:3 | |||||||||
| Corn (H+C & H+CS) | 88.4 | 8.70 | 15.2 | 2.82 | 12.40 | 2.37 | 0.45 | ||
| SBOM (H+CS & H+S) | 88.5 | 45.52 | 10.1 | 6.43 | 3.72 | 5.26 | 1.16 | ||
| Hay:4 | |||||||||
| As-Fed |
30.9 |
4.75 | 79.7 | 47.3 | 32.3 | 37.7 |
9.05 |
||
| Weighback:5 | |||||||||
| H+C | 0.21 | 29.5 | 3.51 | 80.1 | 49.0 | 31.1 | 38.5 | 9.59 | |
| H+CS | 0.69 | 23.3 | 3.52 | 81.3 | 50.6 | 30.7 | 40.0 | 9.72 | |
| H+S | 1.16 | 24.8 | 2.44 | 82.5 | 51.3 | 31.2 | 40.4 | 10.19 | |
| Significance (P): | |||||||||
| Treatment | 0.19 | 0.02 | 0.42 | 0.41 | 0.07 | 0.43 | 0.20 | ||
| Linear | 0.18 | 0.01 | 0.21 | 0.21 | 0.62 | 0.23 | 0.10 | ||
| Lack of fit | 0.21 | 0.08 | 0.98 | 0.79 | 0.03 | 0.68 | 0.55 | ||
|
1IVMD = in vitro dry matter disappearance; CP = crude protein; NDF = neutral detergent fiber; ADF = acid detergent fiber; HEMI = hemicellulose; CELL = cellulose. ↵ 2H+C = hay plus corn; H+CS = hay plus corn and soybean oil meal (SBOM or S); H+S = hay plus SBOM. ↵ 3Each value is the average of multiple samples. ↵ 4Each value is the composite of multiple samples and the mean of four replicates n = 4). ↵ 5Each value is the average of multiple samples and the mean of four replicates (n = 4). ↵ |
|||||||||
| Treatment1 | Crude Protein | NDF (%) | Fiber Fractions2 | Particle-size3 | ||||||||
|---|---|---|---|---|---|---|---|---|---|---|---|---|
| Item | CP (lb) | Feces (%) | Urine (%) | ADF (%) | HEMI (%) | CELL (%) | Lignin (%) | Large (%) | Medium (%) | Small (%) | ||
| H+C | 0.21 | 6.454 | 1.03 | 73.9 | 44.2 | 29.7 | 30.4 | 12.4 | 1.8 | 20.3 | 77.9 | |
| H+CS | 0.69 | 7.79 | 5.96 | 77.4 | 43.7 | 28.6 | 30.2 | 11.9 | 1.8 | 15.9 | 82.5 | |
| H+S | 1.16 | 8.78 | 5.22 | 73.6 | 45.4 | 28.2 | 31.5 | 12.3 | 0.6 | 20.4 | 79.0 | |
| Significance (P) | ||||||||||||
| Treatments | 0.04 | <0.01 | 0.12 | 0.10 | 0.07 | 0.03 | 0.70 | 0.02 | 0.24 | 0.24 | ||
| Crude Protein: | ||||||||||||
| Linear | 0.02 | <0.01 | 0.69 | 0.12 | 0.03 | 0.03 | 0.92 | 0.01 | 0.72 | 0.72 | ||
| Lack of fit | 0.77 | <0.01 | 0.05 | 0.11 | 0.57 | 0.07 | 12.3 | 0.84 | 0.11 | 0.11 | ||
|
1 H+C = hay plus corn; H+CS = hay plus corn and soybean oil meal (SBOM or S); H+S = hay plus SBOM. ↵ 2 NDF = neutral detergent fiber; ADF = acid detergent fiber; HEMI = hemicellulose; CELL = cellulose. ↵ 3 Large = ≥ 1.7 mm; Medium = < 1.7 ≥ 0.5 mm; Small = < 0.5 mm. ↵ 4 Each value is the mean of four steers (n = 4). ↵ |
||||||||||||
Experiment 3. Immature and Mature Switchgrass Hays Supplemented with Four Levels of Crude Protein
As noted in Experiment 2, switchgrass has potential as either pasture or as a hay crop in the Mid-Atlantic region. When used as a hay crop, switchgrass dry matter yield potential increases if cutting is delayed until the onset of heading. Furthermore, a large proportion of the switchgrass canopy is stem, and this component increases with advancing maturity compared with leaf. As switchgrass matures, however, CP concentrations decrease and will probably not be adequate for acceptable animal performance. In this experiment, we examined the quality of switchgrass hay harvested at the vegetative (immature) stage compared to harvesting at the heading (mature) stage. Each hay was fed with soybean oil meal, corn, or both to provide increasing concentrations of CP while keeping the energy concentrations similar.
Materials and Methods
A well-established field of ‘Alamo’ switchgrass served as the experimental site. The field was burned in late February and flail harvested to a 3-inch stubble to remove all residual forage. It was then top-dressed in March with ammonium nitrate at 80 lb/acre of actual nitrogen. Batches of switchgrass were cut when vegetative (May 14, 16, and 22) with a field chopper, blown into a self-unloading wagon, and transported to a bulk-hay drier and dried overnight. When dry, each batch of hay was baled directly out of the bulk drier with a conventional square baler. The bales from each cutting were then transported to an experimental hay barn and stored on wooden pallets as the immature hay treatment. On July 15 and 17, a second harvest of initial growth switchgrass hay was cut in the boot stage from the same field with batches cut and handled in the same manner as above for the immature hay treatment. Bales from these batches were transported as above, combined, and then stored on wooden pallets as the mature hay treatment. The two hays remained undisturbed until processed for feeding (Appendix GP-1).
We evaluated eight treatments that consisted of the natural concentrations of crude protein (CP) in each of the immature and mature stages of switchgrass hays. We then evaluated each hay at three crude protein levels (CPL) using corn or corn and soybean oil meal supplementation.
The eight treatments evaluated were as follows:
Immature hay:
- Hay + CPL1 = Hay (0.97 lb CP) = 0.97 lb CP
- Hay + CPL2 = Hay (0.97 lb CP) + Corn (0.22 lb CP) = 1.19 lb CP
- Hay + CPL3 = Hay (0.97 lb CP) + Corn (0.17 lb CP) + SBOM (0.27 lb CP) = 1.41 lb CP
- Hay + CPL4 = Hay (0.97 lb CP) + Corn (0.12 lb CP) + SBOM (0.54 lb CP) = 1.63 lb CP
Mature hay:
- Hay + CPL5 = Hay (0.40 lb CP) = 0.40 lb CP
- Hay + CPL6 = Hay (0.40 lb CP) + Corn (0.14 lb CP) + SBOM (0.43 lb CP) = 0.97 lb CP
- Hay + CPL7 = Hay (0.40 lb CP) + Corn (0.09 lb CP) + SBOM (0.70 lb CP) = 1.19 lb CP
- Hay + CPL8 = Hay (0.40 lb CP) + Corn (0.04 lb CP) + SBOM (0.97 lb CP) = 1.41 lb CP
The inherent CP concentration of each hay (immature stage = 7.31% CP and mature stage = 4.43% CP) served as the first level of CP (CPL1 and CPL5, respectively) and CP supplements, balanced for energy concentration (1.98 lb of total digestible energy) by adjusting the proportions of corn (10.5% CP) and soybean oil meal (SBOM, 50.7% CP), provided the other three levels within each of the two hays. The experiment was set up as a randomized complete block design with three Angus steers (replicates) per treatment. Twenty-four steers were blocked by weight into three groups of eight steers each. The eight steers within each group were then randomly assigned to one of the eight crude protein treatments. We determined the nutritive value of the hay and weighback according to general laboratory procedures (Appendix GP-6).
Each morning, steers were provided 2.21 to 2.28 lb of the appropriate supplement for the immature hay treatments and 2.26 to 2.33 lb of the appropriate supplement for the mature hay treatments for consumption. After the supplements (SUP) were consumed, the appropriate hay was then fed ad libitum to all the experimental steers according to general procedures (Appendix GP-2).
We analyzed the resulting animal response data and nutritive value estimates statistically according to the design with the treatment sums of squares (seven degrees of freedom) partitioned into five contrasts noted below (Appendix GP-7):
- Immature (IM) vs. mature (MA) switchgrass (1, 2, 3, 4 vs. 5, 6, 7, 8)
- IM switchgrass, greater CP vs. lesser CP (4 vs. 1, 2, 3)
- MA switchgrass, lesser CP vs. greater CP (5 vs. 6, 7, 8)
- Response to SUP (omitting 0 SUP) across maturity (1 and 6, 2 and 7, 3 and 8)
Linear
Lack of fit - Maturity × SUP interaction (omitting 0 SUP) across maturity (1 and 6, 2 and 7, 3 and 8)
Linear
Lack of fit
In a second phase, we compared the mastication characteristics of the two bulk hays fed in the intake and digestion phases. In this phase, four steers fitted with esophageal cannulas were used in a randomized complete block design for masticate collection (Appendix GP-3). Three particle-size classes were determined according to GP-5, and the nutritive value of the whole masticate and the particle-size classes were conducted according to GP-6. We analyzed the data according to the design, providing—in this case—comparisons of masticate characteristics for only the main effect of hay (Appendix GP-7).
Results and Discussion
Animal Response.
The importance of forage maturity and sufficient nutritive value of the diet, whether from the forage or a supplement, is evident from examining steer weights even from this short-term experiment. No differences in body weight were noted among the treatments, with the exception of Treatment 4 (Table 3.1). The mean body weight of steers on Treatment 4 was similar on average to the other steers at initiation of the experiment (559 lb) but averaged greater (619 lb) at the end of the experiment than the others. This result is consistent with greater DMI (daily or on a body weight basis), DMD, and DDMI (both daily and on a body weight basis) by steers fed this treatment. Increasing the CP supplementation of the immature hay resulted in linearly increasing intakes of both dry matter and digestible dry matter on both a daily and body weight basis. Dry matter digestibility, however, was not altered by supplementation.
The effect of increasing maturity of switchgrass hay on its quality is apparent for all measurements with immature hay being greater in quality than mature hay (Table 3.1). Increasing the crude protein supplement of the mature hay, however, increased its dry matter intake, digestibility, and digestible intake (both on a daily and body weight basis). These responses, although desirable, were still lacking relative to the responses noted for the immature hay.
It is surprising, and worth noting, that the CP supplementation × Hay Maturity interactions were not significant for any of the variables measured in this study (bottom, Table 3.1). While supplementation was expected to improve the nutritive value of the hays, and subsequently their quality, the similarity in relative magnitude of improvement was not expected.
Hay and Supplement Characteristics.
Examination of the two bulk-hay treatments clearly revealed their differences in nutritive value. The immature hay is far greater in IVTD and nitrogen (N) and lesser in NDF and its fiber constituents (Table 3.2). This difference is apparent for the hays fed in both the intake and digestion phases.
The composition of corn and SBOM composing the supplements used in both phases also differed in nutritive value (Table 3.2). The noted exceptions were NDF and ash, which were similar. The corn and SBOM components were adjusted as appropriate in the supplement to provide increasing CP concentration while maintaining the supplements isocaloric.
Masticate Characteristics.
Steers masticated the two hays differently, indicated by the greater median particle size (MPS) of the whole masticate compared to the immature hay (Table 3.3). This difference indicates that steers chewed the mature hay more than the immature hay, which is consistent with its greater NDF and lesser IVTD and CP concentrations. Examination of the particle-size classes also supports greater mastication of the mature hay with a lesser proportion of masticate dry matter present as large particles and greater proportions for both medium and small particles. The particles-size classes also reflect the difference in nutritive value, with the immature hay particles being of greater nutritive value compared with mature hay particles.
Composition of Urine and Feces.
The greater amount of CP fed with the immature hay increased the N concentration in both the urine and feces but did not alter the other constituents in the feces (Table 3.4). Increasing the CP supplement fed with the mature hay only resulted in an increase in the N concentration of the feces but decreased fecal NDF and its constituent fiber fractions (except hemicellulose) and ash. Chemical composition of the fecal samples also reflect the maturity differences noted for the fed hays, with feces from the mature hay being lesser in N and greater in NDF and its constituent fiber fraction compared with the immature hay (Table 3.4). Overall, CP supplementation of the hays linearly increased the N concentration in both the urine and feces. Some increase in fecal NDF and little change in ash after the supplement was fed resulted in a lack of fit or quadratic response (Table 3.4). The CP × Hay Maturity interaction was significant for the linear component of N, hemicellulose (HEMI), and lignin and for the quadratic component of ADF and ash. This result is attributed to lack of parallel trends and is considered of little importance.
Summary and Conclusion
- Switchgrass hay can be useful in a ruminant production system.
- Maturity at harvest has a major impact on the quality of the preserved forage.
- Steers consumed 1.89% of body weight of immature switchgrass that was 65.1% digestible compared with 1.08% of mature hay that was 51.6% digestible.
- Increasing crude protein through supplementation of immature hay increased dry matter intake to 2.41% of body weight and digestibility to 70.0%.
- Increasing crude protein through supplementation of mature hay increased dry matter intake to 1.86% of body weight and digestibility to 57.8%.
- Mastication of the immature and mature switchgrass hays revealed the differences noted above in terms of reduced particle size therefore implicating increased chewing of the mature hay.
Although crude protein supplementation was found to improve the nutritive value of a forage, the stage of maturity at harvest is the key element in the preservation of a forage relative to its potential subsequent quality.
| Treatment | Steer Weight (lb) |
Hay1 | SUP Fed (lb) |
DMI | DMD (%) |
DDMI | ||||||
|---|---|---|---|---|---|---|---|---|---|---|---|---|
| No | Hay (H) (lb CP) |
H+SUP (lb CP) |
Fed (lb) |
WB (lb) |
Ad Lib. (%) |
Daily (lb) |
Animal (lb/100 lb) |
Daily (lb) |
Animal (lb/100 lb) |
|||
| Immature (IM): | ||||||||||||
| 1 | 0.97 | -- | 5582 | 11.7 | 1.4 | 12.0 | 0 | 10.4 | 1.89 | 65.1 | 6.73 | 1.23 |
| 2 | -- | 1.19 | 529 | 9.0 | 1.1 | 12.4 | 2.2 | 10.1 | 1.90 | 67.8 | 6.83 | 1.29 |
| 3 | -- | 1.41 | 588 | 11.8 | 1.5 | 12.5 | 2.1 | 12.5 | 2.14 | 69.0 | 8.61 | 1.47 |
| 4 | -- | 1.63 | 619 | 14.6 | 1.8 | 12.3 | 2.3 | 15.0 | 2.41 | 70.0 | 10.54 | 1.68 |
| Mature (MA): | ||||||||||||
| 5 | 0.40 | -- | 563 | 7.0 | 0.9 | 13.6 | 0 | 6.0 | 1.08 | 51.6 | 3.11 | 0.56 |
| 6 | -- | 0.97 | 564 | 7.5 | 1.0 | 13.6 | 2.3 | 8.8 | 1.56 | 58.7 | 5.13 | 0.91 |
| 7 | -- | 1.19 | 556 | 8.9 | 1.1 | 12.7 | 2.3 | 10.1 | 1.83 | 56.6 | 5.72 | 1.04 |
| 8 | -- | 1.41 | 571 | 9.5 | 1.3 | 13.2 | 2.3 | 10.6 | 1.86 | 57.8 | 6.13 | 1.07 |
| Significance (P): | ||||||||||||
| Treatment | 0.29 | <0.01 | <0.01 | 0.55 | -- | <0.01 | <0.01 | <0.01 | <0.01 | <0.01 | ||
| IM vs. MA | 0.54 | <0.01 | <0.01 | 0.06 | -- | <0.01 | <0.01 | <0.01 | <0.01 | <0.01 | ||
| IM (4 vs. 1, 2, 3) | 0.03 | 0.01 | <0.01 | 0.98 | -- | <0.01 | <0.01 | 0.09 | <0.01 | <0.01 | ||
| MA (5 vs. 6, 7, 8) | 0.98 | 0.15 | 0.11 | 0.60 | -- | <0.01 | <0.01 | <0.01 | <0.01 | <0.01 | ||
| Crude Protein (CP): | ||||||||||||
| Linear | 0.41 | 0.31 | 0.15 | 0.96 | -- | 0.04 | 0.03 | 0.25 | 0.03 | 0.02 | ||
| Lack of Fit | 0.18 | 0.18 | 0.06 | 0.64 | -- | 0.56 | 0.95 | 0.68 | 0.49 | 0.89 | ||
| CP × Maturity: | ||||||||||||
| Linear | 0.62 | 0.34 | 0.41 | 0.45 | -- | 0.85 | 0.84 | 0.08 | 0.48 | 0.58 | ||
| Lack of Fit | 0.41 | 0.08 | 0.07 | 0.45 | -- | 0.26 | 0.27 | 0.30 | 0.39 | 0.42 | ||
|
1Fed = as-fed basis; WB = weighback; Ad Lib = ad libitum. ↵ 2Each value is the mean of three steers (n = 3). ↵ |
||||||||||||
| Item | IVTD (%) |
N (%) |
NDF (%) |
Fiber Fractions | Ash (%) |
||||
|---|---|---|---|---|---|---|---|---|---|
| ADF (%) |
ADFN (%) |
HEMI (%) |
CELL (%) |
Lignin (%) |
|||||
| Intake Phase: | |||||||||
| Hay: | |||||||||
| Immature | 73.82 | 1.22 | 73.6 | 37.5 | 0.20 | 36.1 | 31.5 | 4.9 | 1.1 |
| Mature | 51.4 | 0.64 | 79.7 | 45.3 | 0.17 | 34.4 | 35.9 | 7.9 | 1.4 |
| Significance (P) | 0.01 | 0.01 | <0.01 | <0.01 | 0.09 | 0.03 | 0.01 | <0.01 | <0.01 |
| Supplement: | |||||||||
| Corn | -- | 1.68 | 12.5 | 3.4 | -- | 9.1 | 2.9 | 0.7 | <0.01 |
| SBOM | -- | 8.12 | 10.9 | 7.0 | -- | 3.9 | 5.4 | 1.4 | 0.20 |
| Significance (P) | -- | <0.01 | 0.07 | <0.01 | -- | 0.01 | <0.01 | 0.01 | 0.08 |
| Digestion Phase: | |||||||||
| Hay: | |||||||||
| Immature | 73.8 | 1.21 | 73.7 | 38.1 | 0.19 | 35.6 | 31.9 | 4.9 | 1.2 |
| Mature | 52.8 | 0.65 | 79.3 | 44.4 | 0.16 | 34.9 | 35.4 | 7.7 | 1.3 |
| Significance (P) | <0.01 | 0.03 | <0.01 | 0.01 | 0.15 | 0.17 | 0.01 | 0.01 | 0.35 |
| Supplement: | |||||||||
| Corn | -- | 1.66 | 12.6 | 3.4 | -- | 9.1 | 2.7 | 0.6 | 0.1 |
| SBOM | -- | 8.23 | 11.2 | 6.7 | -- | 4.4 | 5.2 | 1.3 | 0.2 |
| Significance (P) | -- | <0.01 | 0.42 | <0.01 | -- | 0.10 | 0.02 | 0.02 | 0.26 |
|
1IVTD = in vitro dry matter disappearance; N = nitrogen; NDF = neutral detergent fiber; ADF = acid detergent fiber; ADFN = nitrogen concentration in the ADF fraction; HEMI = hemicellulose; CELL = cellulose. ↵ 2Each value is the mean of multiple subsamples. ↵ |
|||||||||
| Hay | Whole Masticate | Particle-size classes2 | |||||||||||
|---|---|---|---|---|---|---|---|---|---|---|---|---|---|
| Large | Medium | Small | |||||||||||
| MPS (mm) |
IVTD (%) |
CP (%) |
NDF (%) |
PROP (%) |
IVTD (%) |
NDF (%) |
PROP (%) |
IVTD (%) |
NDF (%) |
PROP (%) |
IVTD (%) |
NDF (%) |
|
| Immature | 1.413 | 77.2 | 7.3 | 73.5 | 40.4 | 73.9 | 74.8 | 48.1 | 79.3 | 72.0 | 11.4 | 81.1 | 69.1 |
| Mature | 1.10 | 63.2 | 4.43 | 79.0 | 25.6 | 56.8 | 80.3 | 55.2 | 64.1 | 77.8 | 19.2 | 72.6 | 74.1 |
| Significance (P) | <0.01 | <0.01 | <0.01 | <0.01 | <0.01 | <0.01 | <0.01 | <0.01 | <0.01 | <0.01 | <0.01 | <0.01 | <0.01 |
|
1IVTD = in vitro true dry matter disappearance; CP = crude protein; NDF = neutral detergent fiber. ↵ 2Large = ≥ 1.7 mm; Medium = < 1.7 and ≥ 0.5 mm; Small < 0.5 mm. ↵ 3Each value is the mean of four animals (n = 4). ↵ |
|||||||||||||
| Treatment | Urine | Feces | ||||||||
|---|---|---|---|---|---|---|---|---|---|---|
| No | H (lb CP) |
H+SUP (lb CP) |
N (%) |
N (%) |
NDF (%) |
ADF (%) |
HEMI (%) |
CELL (%) |
Lignin (%) |
Ash (%) |
| Immature (IM): | ||||||||||
| 1 | 0.97 | --- | 2.472 | 1.61 | 68.0 | 39.0 | 29.0 | 24.7 | 10.8 | 3.5 |
| 2 | --- | 1.19 | 2.72 | 1.90 | 65.3 | 34.0 | 31.3 | 22.3 | 9.0 | 2.7 |
| 3 | --- | 1.41 | 5.94 | 1.99 | 65.1 | 35.0 | 30.1 | 22.3 | 9.5 | 3.2 |
| 4 | --- | 1.63 | 8.06 | 2.17 | 64.7 | 35.6 | 29.1 | 21.9 | 10.5 | 3.1 |
| Mature (MA): | ||||||||||
| 5 | 0.40 | --- | 3.69 | 0.91 | 78.7 | 48.6 | 30.1 | 33.3 | 12.5 | 2.8 |
| 6 | --- | 0.97 | 3.50 | 1.33 | 76.3 | 44.4 | 31.8 | 30.9 | 11.0 | 2.5 |
| 7 | --- | 1.19 | 8.22 | 1.32 | 76.0 | 45.1 | 30.9 | 31.2 | 11.4 | 2.5 |
| 8 | --- | 1.41 | 7.16 | 1.39 | 76.0 | 45.5 | 30.5 | 31.1 | 11.9 | 2.4 |
| Significance (P): | ||||||||||
| Treatment | 0.02 | <0.01 | <0.01 | <0.01 | 0.01 | <0.01 | <0.01 | <0.01 | ||
| IM vs. MA | 0.37 | <0.01 | <0.01 | <0.01 | 0.01 | <0.01 | <0.01 | <0.01 | ||
| IM (4 vs. 1,2,3) | 0.01 | <0.01 | 0.23 | 0.64 | 0.07 | 0.14 | 0.09 | 0.84 | ||
| MA (5 vs. 6,7,8,) | 0.10 | <0.01 | 0.04 | <0.01 | 0.08 | 0.01 | 0.02 | 0.03 | ||
| Supplement: | ||||||||||
| Linear | 0.01 | <0.01 | 0.13 | 0.08 | 0.82 | 0.11 | 0.63 | 0.11 | ||
| Lack of fit | 0.53 | 0.64 | 0.41 | 0.05 | 0.08 | 0.33 | 0.07 | 0.01 | ||
| Maturity × CP: | ||||||||||
| Linear | 0.94 | 0.03 | 0.19 | 0.01 | 0.02 | 0.06 | 0.01 | 0.44 | ||
| Lack of fit | 0.07 | 0.25 | 0.53 | 0.04 | 0.02 | 0.22 | 0.09 | 0.01 | ||
|
1NDF = neutral detergent fiber; ADF = acid detergent fiber; HEMI = hemicellulose. ↵ 2Each value is the mean of three steers (n = 3). ↵ |
||||||||||
Experiment 4. Quality and Preference by Steers Among Silages Made from the Annuals Corn, Sorghum, and Pearlmillet
Temperate corn has long been the choice forage for preservation as silage because of its production potential, its relative ease of harvesting, its desirable fermentation characteristics, its resulting nutritive value after ensiling, and its degree of preference by ruminants resulting in desirable animal performance. Tropical corn has recently appeared, being generally a taller growing plant with greater dry matter productivity than temperate cultivars. Tropical corn, however, has a lesser proportion of the plant dry matter composed of grain than found in temperate corn cultivars (Teare and Brown, 1991). Also, the forage sorghums, as well as the millets, have shown potential and have been used successfully as silage crops.
We addressed two main objectives in this experiment: One objective, addressed in Experiment 4A, evaluates the effects of an added supplemental grain on the digestibility of silage from a cultivar representing a temperate corn and a cultivar representing a tropical corn. The second objective, addressed in Experiment 4B, compares steers’ preferences when selecting among silages made from several annual forage species consisting of corn (temperate and tropical), sorghum, and pearlmillet.
General Materials and Methods
Stands of the experimental annuals in Experiment 4A consisted of a temperate corn cultivar (Pioneer 3154) planted April 28 and a tropical corn cultivar (Dekalb 678C) planted June 15. In Experiment 4B, six annual forages were compared. These forages consisted of a temperate corn (Pioneer 3156), two tropical corns (subtropical Pioneer X304C and tropical Pioneer 3098), two sorghums (Pioneer 840F and Brandies, a release through New Mexico Crop Improvement Association, Las Cruces, New Mexico having increased sugar concentration and produced by Rose Seed Co., Inc., San Jon, New Mexico), and a pearlmillet (3-Mil-X Hybrid). All forages were seeded on June 4 and established at the Lake Wheeler Road Field Laboratory, except Dekalb 678C, which was produced off station but on the same soil type. A no-till corn planter was used for all plantings. The planter was set to a depth of 1.5 inches for corn and adjusted to seed 23,775 plants/acre. For the sorghums and pearlmillet, the planter was set to a depth of 0.75 inches. The sorghum was planted at 10 lb/acre, and pearlmillet was planted at 8 lb/acre. Normal cultural practices were followed at establishment, and the forages were later top-dressed with 80 lb/acre of nitrogen.
The forages to be evaluated for digestibility (Experiment 4A) were planted in long strips, field chopped, and preserved in upright experimental silos to provide adequate silage for animal evaluation.
The forages we evaluated in preference trials (Experiment 4B) were planted in a randomized complete block design with four replicates. These smaller plots (25 feet by 15 feet) provided sufficient forage for ensiling in miniature silos (5-gallon plastic containers) and quantities were adequate for preference evaluations. Forages were harvested and ensiled at the dough stage with all forages harvested between September 17 and 30. The exception was Brandies sorghum, which was not mature enough until October 28. Prior to harvest, two rows were randomly selected from within each plot and a 15-foot length was randomly selected within each row and used for evaluation. First, 10 random plant heights were taken from each sample area within each plot. The forage was then cut and weighed for dry matter determination and passed through a forage field chopper in preparation for ensiling. Two subsamples of the chopped forage were taken: one was used for dry matter determination (dried at 170°F in a forced-air oven), and the other was frozen, freeze dried, ground to pass through a 1-mm screen, and stored in a freezer for subsequent nutritive value analyses. The remainder of the chopped sample was placed, with packing, into 5-gallon plastic containers. These miniature silos were then sealed with a plastic lid (containing a rubber seal) fitted with a gas release valve for fermentation. We determined the nutritive value of the fresh forage, silage, and weighback according to general laboratory procedures (Appendix GP-6)
Experiment 4A. The Influence of Increasing Supplemental Grain (Corn) on Dry Matter Digestibility of Temperate and Tropical Corn
Interest exists in replacing temperate corn with a tropical corn because of its greater yield potential. The two differ, however, in the proportion of grain that composes the total plant dry matter. Tropical corn cultivars typically have a lesser grain component as a proportion of the total plant dry matter, which may alter its nutritive value and consequently its quality. Our objective in this experiment was to ensile representative temperate and tropical corn cultivars under standard conditions and to determine the effect of increasing the grain component at feeding on the dry matter digestibility of the silage.
Materials and Methods
We selected two representative cultivars for dry matter digestibility evaluation: the temperate Pioneer 3154 and the tropical DeKalb 678C. Forages were produced and ensiled as noted in General Materials and Methods above. After allowing at least 60 days for fermentation and stabilization to occur, the silos were opened, any evident surface mold was removed, and the digestion phase of the two silages was initiated.
We evaluated six treatments in this experiment:
Temperate (TM) Corn Silage (Pioneer 3154):
- TM0 = Silage (7.53% CP and 13.3% grain), no corn supplement
- TM10 = Silage, corn supplement fed at 10% of DM intake
- TM20 = Silage, corn supplement fed at 20% of DM intake
Tropical (TP) Corn Silage (Dekalb 678C):
- TP0 = Silage (8.59% CP and 8.0% grain), no corn supplement
- TP10 = Silage, corn supplement fed at 10% of DM intake
- TP20 = Silage, corn supplement fed at 20% of DM intake
The experiment was arranged as a randomized complete block design with three steer replicates per treatment. Eighteen steers were blocked by weight into three groups of six steers each and each steer within each group was randomly assigned to a treatment. The quantity of corn fed was based on the previous day’s dry matter intake. Prior to the morning feeding, the previous day’s weighback was determined and the previous day’s intake (on an “as-fed” moisture basis) was calculated. This value was then multiplied by 10% and by 20%, and that quantity of corn was weighed into plastic containers that were each placed into the feeding manger of the appropriate steer. After the grain was consumed, the appropriate silage was fed to each steer in sufficient amounts to allow 15% ad libitum intake.
Because no estimate of dry matter intake was obtained, the experimental period was shortened compared with normal protocol. In this case, steers were fed the experimental diets for 14 days for adjustment and then moved into digestion crates to begin the 12-day digestion phase. This phase consisted of a seven-day adjustment to the crates followed by the experimental period consisting of a five-day total fecal collection (Appendix GP-2). We statistically analyzed the digestion data and associated silage data according to the design (Appendix GP-7).
Results and Discussion
Silages of both forages differed in dry matter concentrations averaging 27.5% for the temperate corn and 29.4% for the tropical corn (Table 4A.1). Both forages ensiled similarly, however, with a pH averaging 3.9, but the temperate corn silage had greater concentrations of both acetic and propionic acids and lesser lactic acid.
Steers digested both corn silages similarly, averaging 69.3% for the temperate corn and 66.8% for the tropical corn (Table 4A.2). The DMD of both silages increased linearly, however, with increasing corn supplementation and with no interaction (silage type × corn supplementation) noted. We noted that the nutritive value of the silages differed, with temperate corn being generally greater in IVTD and lesser in fiber fractions than tropical corn (Table 4A.3). This difference is attributed, in part, to tropical corn’s greater proportion of grain. This difference is also reflected in DMD but was not of sufficient magnitude to be significant.
The composition of the feces also reflect the greater nutritive value noted above for the fed silages with the concentrations of crude protein greater and the fiber fractions lesser in feces from silages of temperate corn vs. tropical corn (Table 4A.2). Furthermore, corn grain supplementation increased fecal crude protein of both silages fed the 10% corn but not the 20% corn. In the latter case, feces from temperate silage declined in crude protein while feces from the tropical silages increased. This effect resulted in a significant silage type × corn supplementation interaction (Table 4A.2). All fiber fractions in the fecal samples showed a significant linear decline in concentration with increasing corn supplementation.
Summary and Conclusion
- Both the temperate and tropical corns ensiled well at 27.5% and 29.4% dry matter respectively and having a similar pH of 3.9.
- Dry matter digestibility did not differ between temperate and tropical corn silage for the representative cultivars used in this experiment.
- Dry matter digestibility increased linearly for both corn silages when increasing corn supplementation from 0% to 20% of dry matter intake.
These data indicate that dry matter yield potential and daily dry matter intake by cattle may be more important than DMD when assessing which type of silage to use in a production system.
| Silage | Dry Matter (%) | pH | Alcohol | Fatty Acids | ||||
|---|---|---|---|---|---|---|---|---|
| Meth (g/kg) | Ethanol (g/kg) | Acetic (g/kg) | Prop (g/kg) | Buty (g/kg) | Lactic (g/kg) | |||
| Digestion trial with corn silages (Experiment A1): | ||||||||
| Temperate (P3154) | 27.5 | 3.68 | 0.24 | 5.91 | 41.9 | 4.52 | 1.72 | 50.0 |
| Tropical (D678C) | 29.4 | 3.70 | 0.13 | 2.75 | 15.5 | 0.17 | 0.31 | 63.5 |
| Significance (P): | <0.01 | 0.61 | 0.09 | 0.07 | 0.01 | 0.03 | 0.07 | 0.03 |
| Preference Trial with corn, sorghum, and millet silages (Experiment B2): | ||||||||
| Corn Cultivars: | ||||||||
| Pioneer 3156 | 35.6ab | 3.81abc | 0.20a | 4.61b | 13.1c | 0.47a | --- | 59.5b |
| Pioneer X304C | 31.8bc | 3.78bc | 0.15a | 3.33b | 21.3ab | 0.16a | --- | 66.2ab |
| Pioneer 3098 | 36.8a | 3.87ab | 0.20a | 3.80b | 14.5c | 0.16a | --- | 63.4b |
| Sorghum Cultivars: | ||||||||
| Pioneer 840F | 25.9cd | 3.73c | 0.21a | 8.67b | 16.5bc | 0.21a | --- | 70.8ab |
| Brandies | 26.8de | 3.77bc | 0.21a | 23.04a | 16.3bc | 0.28a | --- | 66.1ab |
| Millet Cultivar: | ||||||||
| 3-Mil-X Hybrid | 24.4e | 3.88a | 0.22a | 2.26b | 24.4a | 0.17a | --- | 75.3a |
| Significance (P): | ||||||||
| Treatment | <0.01 | 0.02 | 0.78 | <0.01 | <0.01 | 0.22 | --- | 0.05 |
| MSD3 | 4.34 | 0.10 | 0.17 | 10.63 | 5.09 | 0.36 | --- | 11.4 |
| Specific set of orthogonal comparisons: | ||||||||
| Corn vs. Sorghum | <0.01 | 0.03 | 0.46 | <0.01 | 0.93 | 0.85 | --- | 0.09 |
| Millet vs. Others | <0.01 | 0.02 | 0.51 | 0.11 | <0.01 | 0.41 | --- | 0.01 |
| Sorghum: | ||||||||
| P840F vs. Brandies | 0.22 | 0.40 | 0.93 | 0.01 | 0.97 | 0.61 | --- | 0.33 |
| Interaction lack of fit | 0.12 | 0.64 | 0.43 | 0.01 | <0.01 | 0.16 | --- | 0.06 |
|
1Each value is the mean of three steers (n = 3). ↵ 2Each value is the mean of four replicates (n = 4). ↵ 3MSD = minimum significant difference from the Waller-Duncan k-ratio (k = 100) t-test and can be used to compare any two treatments (treatments with the same superscript are similar). ↵ |
||||||||
| Treatment | DMD | Composition1 of Feces | |||||
|---|---|---|---|---|---|---|---|
| Silage | Corn2 (%) | CP (%) | NDF (%) | ADF (%) | CELL (%) | Lignin (%) | |
| Temp | 0 | 66.13 | 15.6 | 57.5 | 34.2 | 24.3 | 8.72 |
| 10 | 72.1 | 17.3 | 51.4 | 29.6 | 21.8 | 7.02 | |
| 20 | 69.6 | 16.6 | 52.7 | 27.7 | 21.3 | 5.94 | |
| Trop | 0 | 63.4 | 12.5 | 65.2 | 39.0 | 26.9 | 9.78 |
| 10 | 65.8 | 15.2 | 57.5 | 33.1 | 23.7 | 7.78 | |
| 20 | 71.2 | 15.8 | 53.9 | 30.1 | 21.4 | 7.38 | |
| Significance (P): | |||||||
| Treatment | 0.15 | <0.01 | <0.01 | <0.01 | 0.02 | <0.01 | |
| Temp vs. Trop | 0.24 | <0.01 | 0.01 | 0.01 | 0.09 | <0.01 | |
| Corn: | |||||||
| Linear | 0.04 | <0.01 | <0.01 | <0.01 | <0.01 | <0.01 | |
| Lack of fit | 0.52 | <0.01 | 0.11 | 0.22 | 0.41 | 0.09 | |
| Silage × Corn: | |||||||
| Linear | 0.39 | <0.01 | 0.12 | 0.35 | 0.22 | 0.59 | |
| Lack of fit | 0.20 | 0.74 | 0.61 | 0.95 | 0.77 | 0.43 | |
|
1CP = crude protein; NDF = neutral detergent fiber; ADF = acid detergent fiber; CELL = cellulose. ↵ 2Corn grain fed as a percent of the previous day’s dry matter intake. ↵ 3Each value is the mean of four steers (n = 4). ↵ |
|||||||
| Treatment | IVTD (%) | CP (%) | NDF (%) | Fiber Fractions | |||
|---|---|---|---|---|---|---|---|
| Silage | Corn2 (%) | ADF (%) | CELL (%) | Lignin (%) | |||
| Silage of cultivars fed3: | |||||||
| Pioneer 3154—Temperate | 79.0 | 7.53 | 48.6 | 29.2 | 24.4 | 4.29 | |
| DeKalb 678C—Tropical | 73.5 | 8.59 | 54.8 | 32.4 | 26.0 | 5.33 | |
| Significance (P) | 0.02 | 0.03 | 0.05 | 0.04 | 0.07 | 0.02 | |
| Silage left as weighback4: | |||||||
| P 3154 | 0 | 79.9 | 9.84 | 42.1 | 24.7 | 20.4 | 3.86 |
| 10 | 87.8 | 11.82 | 34.4 | 19.0 | 15.7 | 3.09 | |
| 20 | 89.5 | 11.81 | 34.5 | 17.7 | 14.6 | 2.84 | |
| D 678C | 0 | 76.5 | 10.32 | 52.4 | 30.1 | 24.4 | 5.01 |
| 10 | 78.0 | 11.69 | 45.1 | 25.7 | 20.5 | 4.44 | |
| 20 | 85.1 | 12.59 | 37.6 | 19.3 | 15.1 | 3.63 | |
| Significance (P): | |||||||
| Treatment | 0.01 | 0.31 | <0.01 | <0.01 | <0.01 | <0.01 | |
| Temperate vs. Tropical Corn | 0.01 | 0.62 | <0.01 | 0.01 | 0.02 | <0.01 | |
| Corn: | |||||||
| Linear | <0.01 | 0.04 | <0.01 | <0.01 | <0.01 | <0.01 | |
| Lack of fit | 0.93 | 0.45 | 0.39 | 0.69 | 0.70 | 0.77 | |
| Silage × Corn | |||||||
| Linear | 0.82 | 0.87 | 0.17 | 0.30 | 0.24 | 0.54 | |
| Lack of fit | 0.17 | 0.63 | 0.37 | 0.30 | 0.33 | 0.47 | |
|
1IVTD = in vitro true dry matter disappearance; CP = crude protein; NDF = neutral detergent fiber; ADF = acid detergent fiber; CELL = cellulose. ↵ 2Corn grain fed as a percent of the previous day’s dry matter intake. ↵ 3Composit sample of the silage from each cultivar fed. ↵ 4Each value is the mean of four steers (n = 4). ↵ |
|||||||
Experiment 4B. Steers’ Preference Among the Silages of Temperate Corn, Tropical Corn, Forage Sorghum, and Pearlmillet
As noted in Experiment 4A above, steers’ dry matter digestion did not differ between the silages of a temperate and tropical corn when a corn grain supplement was fed daily over a range of 0% to 20% of daily dry matter intake. Because dry matter digestion was similar between corn types, the quantity of daily dry matter intake becomes extremely important when selecting an annual cultivar to use as silage. A number of existing annual forages can be sources of silage in a production enterprise. It is important, however, to select a forage that the intended animal will like when ensiled. Our objective in this experiment was to assess steers’ preference among a number of selected adapted annual grasses when preserved as silage.
Materials and Methods
Six forage cultivars were selected for this experiment:
- Pioneer corn, 3156 (P3156)—adapted temperate cultivar
- Pioneer corn, X304C (PX304C)—adapted tropical cultivar
- Pioneer corn, 3098 (P3098)—adapted tropical cultivar
- Pioneer sorghum, 840F (P840F)—adapted forage cultivar
- Brandies sorghum (Brandies)—adapted sweeter forage cultivar
- Pearlmillet, 3-Mil-X Hybrid (3-Mil-X)—adapted cultivar
The selected cultivars, all adapted to the Mid-Atlantic Region, were handled according to normal procedures along with associated cultural, harvesting, and ensiling practices as noted under General Materials and Methods above. In addition to samples taken at harvest for dry matter and nutritive value determinations, whole-plant samples were also obtained. These samples consisted of eight randomly selected whole plants that were bulked and transported to the laboratory for morphological separations. Separations consisted of leaf, stem, and dead fractions for all forages; husk, tassel, and ear fractions for corn; and a head fraction for the sorghums and pearlmillet (millet). All fractions were oven-dried, and proportions were expressed on a dry matter basis.
The miniature silos (5-gallon plastic buckets) were left undisturbed for at least 60 days prior to opening and subsequent evaluation of the ensiled forage in preference trials. At initiation of each preference trial, the lid of each miniature silo of the appropriate treatments was removed and any obvious mold discarded. We conducted seven preference trials with the comparisons between or among silages within each trial as listed below:
Trial 1: Among corn cultivars (P3156 vs. PX304C vs. P3098)
Trial 2: Between tropical corn cultivars (PX304C vs. P3098)
Trial 3: Among temperate corn and forage sorghums (P3156 vs. P840F vs. Brandies)
Trial 4: Between forage sorghums (P840F vs. Brandies)
Trial 5: Among forage sorghums and millet (P840F vs. Brandies vs. 3-Mil-X)
Trial 6: Between millet and temperate corn (3-Mil-X vs. P3156)
Trial 7: Between millet and tropical corn (3-Mil-X vs. PX304C).
We evaluated each silage four times by four different steers randomly selected from a five-steer pool. Steers were assigned at random to each treatment comparison for each trial resulting in a randomized complete block design. Measurements consisted of short-term total as-fed (wet) and dry matter intakes (Kg), and time (minutes) eating for each treatment (Appendix GP-4). Intake rate (gram/minute) was then determined by dividing total intake by time eating. The data are presented in metric units because of the relatively small values resulting from short-term preference measurements. We statistically analyzed animal preference data according to the design (Appendix GP-7).
Results and Discussion
Forage Characteristics.
The mean yield potential, height at harvest, and morphological composition (a composite of four field replicates) provides a comparative overview of the differences among the six cultivars evaluated for preference (Table 4B.1). Although not tested for significance, appreciable differences existed among the forages evaluated. In general, the sorghums were greater yielders with millet least. Within the corn cultivars, the tropical corns were tallest at harvest and had greater proportions of the whole plant dry matter as leaf and stem but least in the proportion of grain. Between the sorghums, Brandies was a greater yielder, being taller than P840F with a greater proportion of the whole plant dry matter as stem and lesser as heads. The nutritive value of the morphological constituents of these cultivars at harvest (prior to fermentation) provides an assessment of their potential quality if fed as forage. For completeness, statistical comparisons among the cultivars in nutritive value constituents of each morphological component of the forage are presented in the appendix (Appendix Tables 4B.1 through 4B.6).
Silage Characteristics.
Forage of all six cultivars fermented well, regardless of species, with dry matter at harvest being greatest for corn silages, lesser for the sorghums, and least for the millet (see Experiment B in Table 4A.1). In all cases, however, silage pH was < 3.9 at feeding and reflective of good fermentation and stable silages. Alcohol production occurred in all silages, and although no difference in methanol production was noted among cultivars, ethanol production was greatest in Brandies and may have been associated with sugar concentration (not determined). Millet had the greatest concentrations of acetic and lactic acids, while the others were similar. All cultivars had similar propionic acid concentration.
The nutritive value of the silages varied greatly among the cultivars (Table 4B.2). For example, Brandies had the greatest IVTD (76.4%) but was numerically least in NDF (57.2%) and CP (6.4%) concentrations. On the other hand, 3-Mil-X had the least IVTD (61.6%), but greatest CP (10.61%) and NDF (68.7%) concentrations. These fermentation and nutritive value characteristics, as well as the physical condition of the silage, were all integrated in influencing the steers’ preferences in the following short-term preference trials.
Steer Preference among Silages.
When given a choice among silages of corn cultivars in Trial 1, steers preferred the tropical cultivar PX304C to both the other tropical cultivar (P3098) and the temperate cultivar (Table 4B.3). Our examination of the silage characteristics indicated that only acetic acid concentration differed among the three silages, with PX304C being greatest (Table 4A.1, Preference Trial). We noted essentially no difference in nutritive value among the three silages (Table 4B.2). When the two tropical corns were compared in Trial 2, steers again preferred PX304C to P3098 (Table 4B.3). In this comparison, the preferred silage had the least DM percentage, greater acetic acid concentration, and lesser NDF, ADF, and CP (Tables 4A.1, Preference Trial and 4B.2).
When the least preferred temperate corn silage was compared with the two sorghums in Trial 3, steers showed no preference among the three silages in terms of intake or intake rate (Table 4B.3), although Brandies had greater ethanol concentrations (Table 4A.1) and temperate corn was generally of lesser nutritive value (Table 4B.2).
When offered only P840F and Brandies sorghum silages in Trial 4, steers showed no preference between silages, although Brandies was generally of greater nutritive value (Tables 4B.4 and 4A.1). Millet was included with the two sorghum silages in Trial 5, but we also found no preference among the steers for the three silages in DM intake. Intake rate was, however, greatest for P840F and least for 3-Mil-X (P =0.06) (Table 4B.4). In this comparison, 3-Mil-X silage had the greatest pH and acetic acid concentrations, but Brandies silage was generally of greatest nutritive value and 3-Mil-X least (Tables 4A.1, Preference Trial, and 4B.2). Furthermore, steers expressed no preference in terms of DM intake between 3-Mil-X silage and silages of either temperate (Trial 6) or tropical corn (Trial 7), even though 3-Mil-X was generally lesser in nutritive value (Tables 4B.4 and 4B.2).
Summary and Conclusion
- All six cultivars evaluated in this experiment ensiled readily with a pH of 3.9 or less, indicating stable silages.
- All silages contained alcohol (methanol and ethanol), with no difference among cultivars, except for Brandies sorghum, which had greater concentrations of ethanol.
- Fatty acid concentrations among the silages differed with 3-Mil-X millet having greatest concentrations of acetic and lactic acids and temperate corn the least.
- The sorghum silages generally had greater nutritive value (greatest in IVTD and least in NDF), followed by corn silages, and millet had the least nutritive value.
- Preference trials using short-term steer dry matter intake revealed that, among the three corn silages, steers preferred the tropical cultivar PX304C to the other tropical and temperate cultivars.
- Preference between the two tropical cultivars was again in favor of PX304C.
- No preference was evident among silages of temperate corn and the two sorghum cultivars.
- No preference was noted between the silages of the two forage sorghums, among the silages of pearlmillet and the two sorghums, or between millet and the temperate and tropical corn silages.
- The tropical corn PX304C has ensiling and nutritive value characteristics that appear to be conducive to selective consumption by steers.
| Treatment | HT | Yield | Leaf | Stem | Dead | Husk | Tassel | Head | Ear | ||
|---|---|---|---|---|---|---|---|---|---|---|---|
| Total | Grain | Grain | |||||||||
| Feet | Ton/acre | ------------------% of whole plant dry matter ------------------- | % of ear | ||||||||
| Corn Cultivars: | |||||||||||
| Pioneer 3156-Temperate | 5.4 | 3.251 | 9.7 | 27.6 | 4.6 | 9.5 | 0.5 | --- | 47.9 | 38.8 | 80.6 |
| Pioneer X304C-Tropical | 9.5 | 4.09 | 15.6 | 46.5 | 3.9 | 12.0 | 1.0 | --- | 20.9 | 13.7 | 65.4 |
| Pioneer 3096-Tropical | 8.0 | 3.69 | 16.0 | 44.2 | 4.7 | 11.0 | 1.4 | --- | 22.7 | 15.9 | 67.9 |
| Sorghum Cultivars: | |||||||||||
| Pioneer 840F | 4.6 | 5.17 | 14.8 | 37.5 | 5.2 | --- | --- | 42.5 | --- | --- | --- |
| Brandies | 7.4 | 8.68 | 11.4 | 67.5 | 4.9 | --- | --- | 16.2 | --- | --- | --- |
| Millet Cultivar: | |||||||||||
| 3-Mil-X Hybrid | 5.5 | 2.64 | 20.6 | 57.0 | 1.6 | --- | --- | 20.8 | --- | --- | --- |
| 1Each value is the average of multiple estimates or samples and the mean of four agronomic replicates (n = 4). ↵ | |||||||||||
| Treatments2 | IVTD (%) | CP (%) | NDF (%) | Fiber Fractions | ||
|---|---|---|---|---|---|---|
| ADF (%) | CELL (%) | Lignin (%) | ||||
| Corn Cultivars: | ||||||
| Pioneer 3156 | 68.2c | 9.12cd | 60.7b | 32.7bc | 25.9b | 5.78d |
| Pioneer X304C | 67.3c | 8.61d | 58.1c | 31.1c | 25.1b | 5.89cd |
| Pioneer 3098 | 66.5c | 10.01cb | 61.3b | 33.7b | 26.7b | 6.10c |
| Sorghum Cultivars: | ||||||
| Pioneer 840F | 71.9b | 9.37bc | 59.2bc | 32.7bc | 25.7b | 6.44b |
| Brandies | 76.4a | 6.40e | 57.2c | 31.8c | 26.6b | 4.99e |
| Millet Cultivar: | ||||||
| 3-Mil-X Hybrid | 61.6d | 10.61a | 68.7a | 39.9a | 30.5a | 7.59a |
| Significance (P): | ||||||
| Treatment | <0.01 | <0.01 | <0.01 | <0.01 | <0.01 | <0.01 |
| MSD3 | 1.87 | 0.74 | 2.32 | 1.74 | 1.70 | 0.31 |
|
1IVTD = in vitro true dry matter disappearance; CP = crude protein; NDF = neutral detergent fiber; ADF = acid detergent fiber; CELL = cellulose. ↵ 2All values are the mean of four agronomic replicates (n = 4). ↵ 3MSD = minimum significant difference from the Waller-Duncan k-ratio (k = 100) t-test and can be used to compare any two treatments (treatments with the same superscript are similar). ↵ |
||||||
|
Item1 |
Intake | Time (minutes) | Intake Rate | |||
|---|---|---|---|---|---|---|
|
AF (kg) |
DM (kg) |
AF (g/min) |
DM (g/min) |
|||
| Trial 1 (Among corn cultivars): | ||||||
| Pioneer 3156 | 0.17b | 0.06b | 0.95b | 306.4a | 109.1a | |
| Pioneer X304C | 2.87a | 0.91a | 11.38a | 251.3a | 79.9a | |
| Pioneer 3098 | 0.33b | 0.12b | 1.31b | 308.8a | 113.9a | |
| Significance (P): | ||||||
| Treatment | <0.01 | <0.01 | <0.01 | 0.95 | 0.88 | |
| MSD2 | 0.89 | 0.30 | 3.51 | 553.4 | 199.2 | |
| Trial 2 (Between tropical corn cultivars): | ||||||
| Pioneer X304C | 3.03 | 0.96 | 15.57 | 214.8 | 68.3 | |
| Pioneer 3098 | 0.60 | 0.22 | 3.27 | 154.2 | 56.9 | |
| Significance (P) | 0.04 | 0.06 | 0.04 | 0.52 | 0.72 | |
| Trial 3 (Among temperate corns and sorghums): | ||||||
| Pioneer 3156 | 0.35a | 0.13a | 2.79a | 137.9a | 49.3a | |
| Pioneer 840F | 2.30a | 0.93a | 9.09a | 233.7a | 83.3a | |
| Brandies sorghum | 1.55a | 0.41a | 4.71a | 277.1a | 74.5a | |
| Significance (P): | ||||||
| Treatment | 0.55 | 0.43 | 0.53 | 0.58 | 0.69 | |
| MSD | 4.70 | 1.58 | 14.87 | 358.94 | 109.2 | |
|
1 Each value is the mean of four steers (n = 4). ↵ 2 MSD = Minimum significant difference from the Waller-Duncan k-ratio (k = 100) t-test and can be used to compare any two treatments (treatments with the same superscript are similar). ↵ |
||||||
| Item1 | Intake | Time (minutes) | Intake Rate | ||
|---|---|---|---|---|---|
| AF (kg) | DM (kg) | AF (g/min) | DM (g/min) | ||
| Trial 4 (Between sorghums): | |||||
| Pioneer 840F | 1.27 | 0.39 | 3.74 | 336.9 | 152.9 |
| Brandies Sorghum | 2.67 | 0.72 | 9.71 | 206.3 | 55.5 |
| Significance (P) | 0.50 | 0.56 | 0.33 | 0.49 | 0.35 |
| Trial 5 (Among sorghums and millet): | |||||
| Pioneer 840F | 2.57a | 1.14a | 6.71a | 346.8a | 132.4a |
| Brandies sorghum | 0.87a | 0.23a | 3.09a | 207.1ab | 55.7ab |
| 3-Mil-X Hybrid | 0.70a | 0.17a | 3.34a | 109.7b | 26.8b |
| Significance (P): | |||||
| Treatment | 0.40 | 0.30 | 0.63 | 0.07 | 0.06 |
| MSD2 | 3.80 | 1.69 | 11.01 | 213.5 | 93.7 |
| Trial 6 (Between millet and temperate corn): | |||||
| 3-Mil-X Hybrid | 1.67 | 0.41 | 5.96 | 134.3 | 33.2 |
| Pioneer 3156 | 2.67 | 0.77 | 15.51 | 198.6 | 57.3 |
| Significance (P) | 0.64 | 0.53 | 0.39 | 0.42 | 0.24 |
| Trial 7 (Between millet and tropical corn): | |||||
| 3-Mil-X Hybrid | 0.80 | 0.19 | 3.16 | 136.5 | 33.7 |
| Pioneer X304C | 2.67 | 0.79 | 8.15 | 325.7 | 97.6 |
| Significance (P) | 0.33 | 0.27 | 0.44 | 0.17 | 0.10 |
|
1Each value is the mean of four steers (n = 4). ↵ 2MSD = Minimum significant difference from the Waller-Duncan k-ratio (k = 100) t-test and can be used to compare any two treatments (treatments with the same superscript are similar). ↵ |
|||||
References and Related Publications
Association of Official Analytical Chemists. 1990. Official Methods of Analysis. 15th ed., Arlington, VA.
Burns, J. C., and W. A. Cope. 1974. Nutritive Value of Crownvetch Forage as Influenced by Structural Constituents and Phenolic and Tannin Compounds. Agron. J. 66:195-200.
Burns, J. C., K. R. Pond, and D. S. Fisher. 1994. Measurements of Intake. p. 494-532. In G.C. Fahey, Jr. et al. (ed.) Forage Quality, Evaluation, and Utilization. ASA, CSSA, and SSSA, Madison, WI.
Cochran, R. C., and M. L. Galyean. 1994. Measurements of In Vivo Forage Digestion by Ruminants. p. 613-643. In G.C. Fahey, Jr. et al. (ed.) Forage Quality, Evaluation, and Utilization. ASA, CSSA, and SSSA, Madison, WI.
Fisher, D. S., J. C. Burns, and K. R. Pond. 1988. Estimation of Mean and Median Particle Size of Ruminant Diets. J. Dairy Sci. 71:518-524.
Teare, I. D., and E. Brown (ed.) 1991. Proceedings Southern Regional Tropical Corn Symposium, Quincy, FL. 27-28 June, 1991. Potash and Phosphate Institute/Foundation for Agronomic Research. Technical Bulletin 1991-3. Potash and Phosphate Institute Atlanta, GA, 30329.
Tilley, J., and R. A. Terry. 1963. A Two-Stage Technique for In Vitro Digestion of Forage Crops. J. Br. Grassl. Soc. 18:104-111.
Van Soest, P. J., and J. B. Robertson. 1980. Systems of Analysis for Evaluating Fibrous Feeds. p. 49-60. In W.J. Pigden et al. (ed.) Standardization of Analytical Methodology for Feeds. International Development Res. Center, Ottowa, Canada.
Appendix I: Data Tables
| Treatment1 | Silage (%) | Forage | Ear | ||||||
|---|---|---|---|---|---|---|---|---|---|
| Leaf (%) | Stem (%) | Dead (%) | Husk (%) | Tassel (%) | Head (%) | Cob (%) | Grain (%) | ||
| Corn Cultivars: | |||||||||
| Pioneer 3156—Temperate | 68.2c | 72.7bc | 63.0c | 60.1b | 62.4b | 53.0b | -- | 61.7b | 96.7a |
| Pioneer X04C—Tropical | 67.3c | 70.7bc | 62.8c | 59.6bc | 65.9b | 54.7b | -- | 69.3a | 93.5a |
| Pioneer 3098—Tropical | 66.5c | 69.9c | 62.8c | 59.9b | 73.3a | 59.9a | -- | 73.9a | 96.1a |
| Sorghum Cultivars: | |||||||||
| Pioneer 840F | 71.9b | 73.5b | 70.3b | 64.7a | -- | -- | 76.0a | -- | -- |
| Brandies | 76.4a | 77.3a | 76.7a | 68.3a | -- | -- | 76.7a | -- | -- |
| Millet Cultivar: | |||||||||
| 3-Mil-X Hybrid | 61.6d | 71.7bc | 59.8c | 55.3c | -- | -- | 58.3b | -- | -- |
| Significance (P): | |||||||||
| Treatment | <0.01 | <0.01 | <0.01 | <0.01 | <0.01 | <0.01 | <0.01 | 0.01 | 0.16 |
| MSD2 | 1.87 | 3.50 | 3.86 | 4.23 | 3.94 | 1.95 | 2.11 | 6.01 | 4.00 |
|
1 All values are the mean of four agronomic replicates (n = 4). ↵ 2 MSD = minimum significant difference from the Waller-Duncan k-ratio (k = 100) t-test and can be used to compare any two treatments (treatments with the same superscript are similar). ↵ |
|||||||||
| Treatment1 | Silage (%) | Forage | Ear | ||||||
|---|---|---|---|---|---|---|---|---|---|
| Leaf (%) | Stem (%) | Dead (%) | Husk (%) | Tassel (%) | Head (%) | Cob (%) | Grain (%) | ||
|
Corn Cultivars: |
|||||||||
| Pioneer 3156—Temperate | 9.12cd | 13.0bc | 6.22b | 7.43a | 5.81a | 6.97a | -- | 5.03a | 12.6b |
| Pioneer X304C—Tropical | 8.61d | 12.2c | 6.68ab | 5.82ab | 5.78a | 5.63b | -- | 7.55a | 14.3a |
| Pioneer 3098—Tropical | 10.01ab | 12.3bc | 8.01a | 7.13a | 6.98a | 6.85a | -- | 8.01a | 14.2a |
| Sorghum Cultivars: | |||||||||
| Pioneer 840F | 9.37bc | 13.3b | 4.49c | 4.47b | -- | -- | 13.1a | -- | -- |
| Brandies | 6.40e | 10.9d | 2.99d | 4.00b | -- | -- | 10.4b | -- | -- |
| Millet Cultivar: | |||||||||
| 3-Mil-X Hybrid | 10.61a | 16.7a | 5.84bc | 7.81a | -- | -- | 12.5a | -- | -- |
| Significance (P): | |||||||||
| Treatment | <0.01 | <0.01 | <0.01 | 0.01 | 0.32 | <0.01 | <0.01 | 0.15 | <0.01 |
| MSD2 | 0.74 | 1.09 | 1.44 | 2.22 | 2.22 | 0.59 | 0.82 | 3.65 | 0.44 |
|
1 All values are the mean of four agronomic replicates (n = 4). ↵ 2 MSD = minimum significant difference from the Waller-Duncan k-ratio (k = 100) t-test and can be used to compare any two treatments (treatments with the same superscript are similar). ↵ |
|||||||||
| Treatment1 | Silage (%) | Forage | Ear | ||||||
|---|---|---|---|---|---|---|---|---|---|
| Leaf (%) | Stem (%) | Dead (%) | Husk (%) | Tassel (%) | Head (%) | Cob (%) | Grain (%) | ||
| Corn Cultivars: | |||||||||
| Pioneer 3156 - Temperate | 60.7b | 63.5b | 64.4b | 72.1c | 77.4a | 81.7a | -- | 76.6a | 21.4a |
| Pioneer X304C - Tropical | 58.1c | 62.2b | 60.3bc | 74.7b | 72.1ab | 77.7b | -- | 62.5b | 25.9a |
| Pioneer 3098 – Tropical | 61.3b | 62.5b | 62.3bc | 74.6b | 69.5b | 77.0b | -- | 64.3b | 29.5a |
| Sorghum Cultivars: | |||||||||
| Pioneer 840F | 59.2bc | 68.1a | 59.7c | 77.3a | -- | -- | 37.8c | -- | -- |
| Brandies | 57.2c | 64.3b | 48.2d | 79.6a | -- | -- | 58.5b | -- | -- |
| Millet Cultivar: | |||||||||
| 3-Mil-X Hybrid |
68.7a |
63.1b | 69.6a | 69.7c | -- | -- | 75.4a | -- |
-- |
| Significance (P): | |||||||||
| Treatment | <0.01 | 0.01 | <0.01 | <0.01 | 0.04 | 0.01 | <0.01 | 0.02 | 0.14 |
| MSD2 | 2.32 | 2.99 | 4.50 | 3.79 | 6.08 | 2.34 | 6.66 | 9.77 | 9.03 |
|
1 All values are the mean of four agronomic replicates (n = 4). ↵ 2 MSD = minimum significant difference from the Waller-Duncan k-ratio (k = 100) t-test and can be used to compare any two treatments (treatments with the same superscript are similar). ↵ |
|||||||||
| Treatment1 | Silage (%) | Forage | Ear | ||||||
|---|---|---|---|---|---|---|---|---|---|
| Leaf (%) | Stem (%) | Dead (%) | Husk (%) | Tassel (%) | Head (%) | Cob (%) | Grain (%) | ||
| Corn Cultivars: | |||||||||
| Pioneer 3156—Temperate | 32.7bc | 30.9a | 35.7bc | 44.0a | 34.9a | 44.3a | -- | 38.7a | 4.3b |
| Pioneer X304C—Tropical | 31.1c | 30.2a | 34.5bc | 44.1a | 30.9b | 42.0b | -- | 31.8a | 6.9a |
| Pioneer 3098—Tropical | 33.7b | 30.1a | 36.3b | 42.8a | 31.1b | 42.7ab | -- | 31.4a | 6.1a |
| Sorghum Cultivars: | |||||||||
| Pioneer 840F | 32.7bc | 32.7a | 35.1bc | 45.5a | -- | -- | 20.9c | -- | -- |
| Brandies | 31.8c | 31.1a | 32.1c | 44.7a | -- | -- | 26.5b | -- | -- |
| Millet Cultivar: | |||||||||
| 3-Mil-X Hybrid | 39.9a | 30.6a | 42.0a | 43.6a | -- | -- | 40.3a | -- | -- |
| Significance (P): | |||||||||
| Treatment | <0.01 | 0.31 | <0.01 | 0.47 | 0.04 | 0.05 | <0.01 | 0.08 | <0.01 |
| MSD2 | 1.74 | 3.10 | 3.71 | 3.72 | 3.34 | 1.89 | 2.73 | 7.54 | 0.78 |
|
1 All values are the mean of four agronomic replicates (n = 4). ↵ 2 MSD = minimum significant difference from the Waller-Duncan k-ratio (k = 100) t-test and can be used to compare any two treatments (treatments with the same superscript are similar). ↵ |
|||||||||
| Treatment1 | Silage (%) | Forage | Ear | |||||||
|---|---|---|---|---|---|---|---|---|---|---|
| Leaf (%) | Stem (%) | Dead (%) | Husk (%) | Tassel (%) | Head (%) | Cob (%) | Grain (%) | |||
| Corn Cultivars: | ||||||||||
| Pioneer 3156—Temperate | 25.9b | 25.0ab | 28.7b | 31.4d | 29.6a | 35.0a | -- | 32.6a | 3.47b | |
| Pioneer X304C—Tropical | 25.1b | 24.2b | 27.6bc | 34.7bc | 26.2b | 33.8a | -- | 26.0b | 4.29a | |
| Pioneer 3098—Tropical | 26.7b | 24.7ab | 29.2b | 33.6c | 26.9b | 35.0a | -- | 26.2b | 4.39a | |
| Sorghum Cultivars: | ||||||||||
| Pioneer 840F | 25.7b | 26.7a | 27.8bc | 36.1ab | -- | -- | 14.6c | -- | -- | |
| Brandies | 26.6b | 25.0ab | 24.8c | 33.7a | -- | -- | 20.6b | -- | -- | |
| Millet Cultivar: | ||||||||||
| 3-Mil-X Hybrid | 30.5a | 24.6ab | 33.4a | 31.7d | -- | -- | 31.3a | -- | -- | |
| Significance (P): | ||||||||||
| Treatment | <0.01 | 0.14 | <0.01 | <0.01 | 0.04 | 0.27 | <0.01 | 0.05 | 0.03 | |
| MSD2 | 1.70 | 2.26 | 3.32 | 3.79 | 2.61 | 2.04 | 2.30 | 5.89 | 0.66 | |
|
1 All values are the mean of four agronomic replicates (n = 4). ↵ 2 MSD = minimum significant difference from the Waller-Duncan k-ratio (k = 100) t-test and can be used to compare any two treatments (treatments with the same superscript are similar). ↵ |
||||||||||
| Treatment1 | Silage (%) | Forage | Ear | ||||||
|---|---|---|---|---|---|---|---|---|---|
| Leaf (%) | Stem (%) | Dead (%) | Husk (%) | Tassel (%) | Head (%) | Cob (%) | Grain (%) | ||
| Corn Cultivars: | |||||||||
| Pioneer 3156—Temperate | 5.78d | 4.55a | 6.95b | 5.88b | 5.30a | 8.00a | -- | 6.17a | 1.25b |
| Pioneer X304C—Tropical | 5.89cd | 4.52a | 7.11ab | 6.38ab | 5.31a | 7.45b | -- | 5.95a | 1.98a |
| Pioneer 3098—Tropical | 6.10c | 4.59a | 7.07b | 6.35ab | 4.96a | 7.21b | -- | 5.18a | 1.99a |
| Sorghum Cultivars: | |||||||||
| Pioneer 840F | 6.44b | 4.86a | 6.78b | 6.70ab | -- | -- | 5.37b | -- | -- |
| Brandies | 4.99e | 4.47a | 5.05c | 6.49ab | -- | -- | 4.99b | -- | -- |
| Millet Cultivar: | |||||||||
| 3-Mil-X Hybrid |
7.59a |
4.55a | 7.75a | 7.36a | -- | -- | 6.96a | -- |
-- |
| Significance (P): | |||||||||
| Treatment | <0.01 | 0.64 | <0.01 | 0.17 | 0.29 | 0.01 | <0.01 | 0.27 | <0.01 |
| MSD2 | 0.31 | 0.72 | 0.66 | 1.23 | 0.61 | 0.40 | 0.68 | 1.54 | 0.37 |
|
1 All values are the mean of four agronomic replicates (n = 4). ↵ 2 MSD = minimum significant difference from the Waller-Duncan k-ratio (k = 100) t-test and can be used to compare any two treatments (treatments with the same superscript are similar). ↵ |
|||||||||
Appendix II: General Standard Procedures of Experimentation
The general standard procedures (GP) followed in conducting the various experiments presented in this bulletin are noted below and are not repeated elsewhere. Departure or specific details related to any one experiment are noted under the Materials and Methods section of each experiment with reference to the appropriate GP outlined below. We conducted all animal experiments in the months of October through April, and occasionally into May, thereby avoiding the hot summer months.
GP-1. Hay Handling.
All hays evaluated in the various experiments were harvested from well-established stands. When hay was field cured, the forage was cut with a mower-conditioner and baled with a conventional square baler. When hay was artificially dried, the forage was cut with a flail-chopper and blown into a self-unloading wagon and transported to a bulk drying barn at the NC State University Forage-Animal Metabolism Unit in Raleigh, North Carolina. After drying, the hay was baled with a conventional square baler. Prior to feeding, field cured hay bales were passed through a hydraulic bale press (Van Dale 5000, J. Starr Industries, Fort Atkins, Wisconsin) with stationary knives spaced at 4 inches. This process reduced hay into 3- to 5-inch lengths with essentially no visible leaf loss and both aided feeding and minimized the potential for the hay to be tossed out of the manger. Forage that was flail-chopped was reduced into 3- to 6-inch lengths when cut and required no further processing prior to feeding.
GP-2. Dry Matter Intake and Apparent, Whole-Tract Digestibility.
We evaluated forages at the NC State Forage-Animal Metabolism Unit in an animal facility consisting of a metal structure partitioned into a feed preparation area on one end, an enclosed but well ventilated middle area equipped with digestion crates with moderate temperature control (ambient air maintained > 50°F and < 85°F), and a third section on the opposite end equipped with a raised, basket weave, metal platform fitted with electronic gates (American Calan Inc., Northwood, New Hampshire) used to control animal access to mangers for individual intake measurements. The intake area was beneath an extension of the roof with three open sides. In the intake phase, each animal wore an electronically keyed collar to allow access to only one manger, but all animals had free access to trace mineralized salt and water and could lounge with other animals. Prior to each experiment, animals were conditioned to the electronic gates before random assignment to the appropriate forage treatment.
The intake phase of each experiment consisted of a 21-day period with the first 7 days used for adjustment and the last 14 days to estimate daily dry matter intake (Burns et al., 1994). A recorded weight of hay was fed twice daily allowing about 13% to 15% excess. A daily sample of the fed hay was obtained for each animal and composites were made on a weekly basis. The unconsumed hay (weighback) was weighed twice daily, saved separately for each animal and treatment combination, and composited each week.
The digestibility phase consisted of 12 days and either immediately followed an intake period or was conducted as a separate digestibility evaluation. In either case, animals were moved into digestion crates. The digestion phase was conducted for 12 days and consisted of a 7-day adjustment period followed by a 5-day total fecal and urine (if applicable) collection (Cochran and Galyean, 1994). A recorded weight of forage was fed twice daily at about 15% excess. A daily sample of the fed hays was obtained and weighback was saved separately for each animal by treatment combination and composited for the five-day collection period.
Feces were collected on a plastic sheet placed on the floor immediately in back of each digestion crate. Feces were removed periodically throughout the day, and the daily total was weighed for each of five consecutive days. Feces were thoroughly mixed daily, and 5% of the fresh weight was placed in a freezer (5°F). When part of the experimental objectives, a second sample was obtained and placed in a freezer for particle size determination.
When part of the objective, urine was collected in containers acidified with 6N HCl to maintain acidic conditions. The volume was determined daily and a 5% daily aliquot was retained. The daily aliquots were pooled by steer and stored frozen for subsequent analysis.
The weekly forage samples from the 14-day intake phase, the 5-day composite forage and fecal samples from the 12-day digestion phase, and the associated weighback samples from the intake and digestion phases were oven-dried (131°F) and weighed for dry matter determination, thoroughly mixed, and a 300 to 500g sub-sample ground in a Wiley Mill to pass a 1-mm screen and stored at room temperature until analyzed. The samples for fecal particle-size determination remained in the freezer (5°F) until freeze dried and were dry sieved as noted below under GP-5.
In experiments using a randomized complete block design, the digestion phase followed the intake phase and completed the experiment for each animal. However, in Latin square-designs, once animals completed one period, they returned to the intake facility following the digestion phase to begin the next period.
GP-3. Masticate Collection and Processing.
Mature, esophageally-fistulated, grade British-bred steers (800 to 1,400 lb) were used in each experiment. Each steer was fed a standard hay about five days before initiation of an experiment. After adjustment to treatments (offered the previous afternoon), collections generally occurred at about 9:00 a.m. and 3:00 p.m. on two consecutive days. Animals were offered about 3 lb of hay at each collection. The esophageal cannulas were removed and boluses were collected by hand to ensure complete collection. The first five to six boluses were discarded and the following 10 to 15 were collected. The boluses were placed on a large plastic tray, gently mixed, placed into two plastic bags, and immediately quick-frozen in liquid nitrogen (-319°F). Samples were then stored in a freezer (5°F) until freeze dried and then returned to the freezer until analyzed. The dried boluses were sampled for nutritive value analyses and used for particle-size determination (see GP-5).
GP-4. Preference Experiments.
Preference experiments were conducted with steers in individual pens measuring 8 feet by 13 feet. Prior to an experiment, animals were fed each forage being evaluated to allow an association of the forage with any post-ingestive feedback produced by the forage. The forage feeding order was randomized separately for each animal. Steers were offered about 14 lb of silage in galvanized tubs. At approximately 30 minutes after offering the feed, an intermediate weight was obtained. This was used to calculate an intake rate by dividing forage disappearance over 30 minutes by the time in minutes spent eating.
Up to four mangers within a pen (16 feet by 26 feet) were available to a steer, allowing the maximum of four forages to be evaluated at a time. The forages and their positions were randomized at presentation. A video recorder was used to record and subsequently estimate total time spent at each feeder in order to calculate intake rate by dividing forage disappearance by minutes at a feeder.
In all preference experiments, the animals were disturbed periodically (2 to 3 minutes) after making a selection, requiring them to choose again. Care was taken to prevent consumption of all of the preferred forages. Also, sampling of all forages was conducted as appropriate for the experiment being carried out. It is notable that, in preference evaluations, some animals may eat considerable amounts of one forage and zero of another forage, although some eating time maybe recorded for the zero intake. Estimates and statistical analysis of the dry matter intake and time-eating data are valid, whereas the wide variation (including zero) makes calculation of the intake rate (g/min) data rather problematic; still, this data is included for completeness.
GP-5. Particle Size Determination.
Particle size estimates of the masticate (boluses) and feces were obtained by passing two 15-g subsamples through a Fritsch Vibrator system (Fritsch Analysette, the Tekmor Co., Cincinnati, Ohio). In the case of masticate, the two subsamples were separated into nine particle sizes consisting of dry matter retained on 5.60-, 4.00-, 2.80-, 1.70-, 1.00-, 0.50-, 0.25-, and 0.125-mm sieves and that which passed through the 0.125-mm sieve (< 0.125 mm). The resulting particles were weighed, the dry weight was recorded, and the percentages of cumulative particle weight oversize were determined and used to calculate median-particle size (Fisher et al., 1988). Samples were composited across days and feeding times for each sieve size.
Particle size estimates of fecal samples were also determined as noted above, except only one sample was passed through the sieves. Sieved samples of both masticate and feces were stored either separately by individual sieve size or composites of the dry matter were made to form three particle-size classes of large (≥ 1.7 mm), medium (< 1.7 and ≥ 0.50 mm), and small (< 0.50 mm) prior to chemical analyses. The composite samples were ground in a cyclone mill (Udy Corp., Fort Collins, Colorado) to pass a 1-mm screen and stored in a freezer until analyzed.
GP-6. Laboratory Analysis.
Nutritive value for all as-fed, weighback, and masticate samples and chemical composition of fecal samples, as appropriate for the various experiments, were either analyzed by wet chemistry and reported or used to develop calibration equations in association with the prediction of composition using near-infrared reflectance spectroscopy (NIRS). No distinction is made in an experiment regarding the analysis via wet chemistry or NIRS prediction.
Nutritive value estimates included in vitro dry matter disappearance (IVDMD) as determined by a modification (Burns and Cope, 1974) of the method by Tilley and Terry (1963). In vitro true dry matter disappearance (IVTD) was determined by 48-hour fermentation in a batch fermentation vessel (Ankom Technology Corp., Fairport, New York) with artificial saliva and rumen inoculum (Burns and Cope, 1974) and terminated with neutral detergent solution in an Ankom 200 fiber analyzer (Ankom Technology Corp., Fairport, New York). This practice removed the contribution of residual microbial dry matter. Ruminal inoculum was obtained from a mature rumen fistulated steer generally fed a mixed alfalfa (Medicago sativa L.)-orchardgrass (Dactylis glomerata L.) hay. Other nutritive value estimates of as-fed hay and masticate, and composition of feces, consisted of total nitrogen and the fiber fractions. Total nitrogen was determined colorimetrically (AOAC, 1990) with a Technicon Autoanalyzer (Bran and Luebbe, Buffalo, Illinois), and crude protein was estimated as 6.25 × nitrogen. The fiber fractions consisted of neutral detergent fiber (NDF), acid detergent fiber (ADF), lignin, and ash and were estimated using reagents according to Van Soest and Robertson (1980). Hemicellulose was determined by difference (NDF – ADF) as was cellulose (ADF − [lignin + ash]).
GP-7. Statistical Analysis.
The data from the intake, digestibility, and masticate phases for each experiment were analyzed and presented as least square means from the application of mixed model methodology, as appropriate, based on the design for the particular experiment. Particle sizes, when determined, were expressed as a percentage of cumulative particle weight oversize (sum of dry matter weight on each sieve vs. weight from all larger sieves) and were used to determine mean and median particle size (Fisher et al., 1988). Means for all variables found significant in each experiment were compared by either trend analysis, a set of orthogonal contrast, or by a set of meaningful comparisons, as appropriate, within the analysis of variance. A minimum significant difference (MSD) was also included at times to assist in determining differences between and among treatments not accommodated by the above mentioned statistical approaches.
Publication date: July 27, 2015
TB-343
The use of brand names in this publication does not imply endorsement by NC State University or N.C. A&T State University of the products or services named nor discrimination against similar products or services not mentioned.
N.C. Cooperative Extension prohibits discrimination and harassment regardless of age, color, disability, family and marital status, gender identity, national origin, political beliefs, race, religion, sex (including pregnancy), sexual orientation and veteran status.