
Cyanobacteria are microscopic organisms that can grow rapidly under the right environmental conditions. While cyanobacteria are technically bacteria, they are often referred to as algae. When cyanobacteria become overly abundant, they are called “blooms” and change the color of the water in proportion to the density of the cyanobacteria. The presence of cyanobacterial blooms in waterbodies can cause negative consequences. When blooms decay, oxygen in the water is used up, leading to fish kills and impairing other aquatic life. Additionally, some cyanobacteria produce toxins that harm humans and other animals. When cyanobacterial blooms produce toxins, they are called “Harmful Algal Blooms” (HABs). Monitoring and predicting blooms across surface waters is challenging because it requires extensive water quality sampling. One method of supporting field monitoring of blooms is through the use of satellite imagery. Satellites can capture the reflected color of cyanobacterial blooms and improve the understanding of when, where, and hopefully why blooms occur.
Many satellite data products are freely available to the public and can help provide a better understanding in long-term monitoring of blooms. To effectively use satellite imagery in management, it’s important to gain a fundamental understanding of satellite imagery and how products differ. This publication provides an overview of how satellite remote sensing can be used to help monitor cyanobacterial blooms. It also explains some of the limitations of using satellite imagery for this purpose.
Satellite imagery will be best suited to managers of surface waters that are prone to blooms and large enough to be seen by satellites. However, satellite images are limited in their abilities to specifically monitor cyanobacteria and should be used to supplement traditional field-based monitoring practices rather than replace them. For example, satellites can be limited by flyover frequency, cloud cover, image pixel size, and alteration of light as it travels through the earth’s atmosphere. Many shortcomings of satellite imagery can be compensated for by field and laboratory techniques, which are more precise than satellite sensors. Pairing satellite images with field and lab practices provides the potential for more intensive monitoring without increasing on-site monitoring efforts (Figure 1 and Figure 2).
Here is an illustration. Let’s say that you manage a water quality monitoring program for a lake, and your team visits the monitoring stations (labelled A, B, C, D) on the second week of each month to collect water samples, which are analyzed in a lab for chlorophyll concentrations. Figure 1 shows satellite images of the lake captured each week of the month.
Figure 2 shows the chlorophyll concentrations from each station fluctuating throughout the month, estimated from the satellite images. If satellite imagery were not included in bloom monitoring, only the values for water samples collected in Week 2 would be available for this month. Because your field monitoring program samples once per month and at fixed monitoring stations, your data provide an incomplete picture of blooms in the lake throughout the month. For example, the field data would not include the bloom event that occurred in Week 3 by station C.

Figure 1. Conceptual figures of how satellite imagery can supplement traditional algal bloom monitoring for a lake. The letters correspond to monitoring stations, and the colors illustrate the changing status of the water.
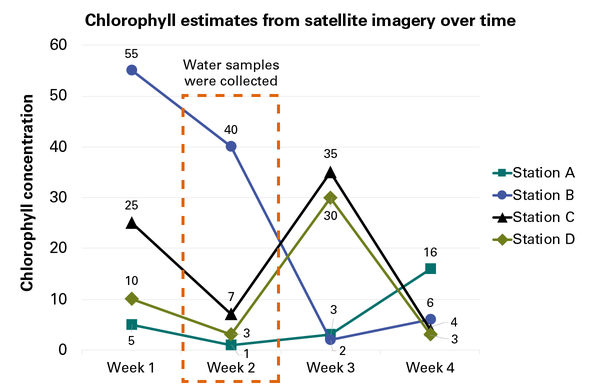
Figure 2. Combining data from satellite imagery and field monitoring provides the most complete view of cyanobacterial blooms on a waterbody.
What Is Satellite Remote Sensing?
Satellites orbit the earth and are equipped with sensors, some of which capture images of the earth. Most satellite imagery is produced from “passive sensors,” which detect and capture sunlight reflected from the earth’s physical environment (Figure 3). Different sensors collect imagery from wavelengths of reflected solar energy of different sizes. Most wavelengths sensed are in the visible spectrum, the range of light visible to the human eye. The captured wavelengths are referred to as bands, which capture different properties, such as the “blue,” “green,” or “red” portions of the spectrum.
Satellite images also come in different spatial and temporal resolutions. Spatial resolution refers to the pixel dimensions in the captured image and can range from centimeters to kilometers, depending on the data products (Figure 4). Temporal resolution refers to the time it takes a sensor to revisit the same spot above the earth’s surface and typically ranges between two and seven days, meaning each location on earth is imaged every two to seven days. Additional information regarding the fundamentals of satellite remote sensing can be found at NASA’s EarthData website.
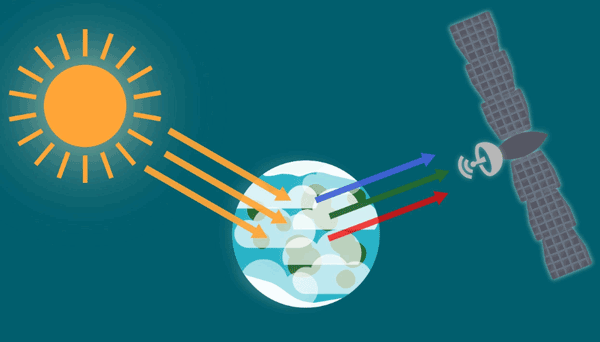
Figure 3. Passive satellite remote sensing captures different wavelengths of solar energy reflected from the earth’s surface. This information can be used to create images of the earth’s surface over long periods of time.
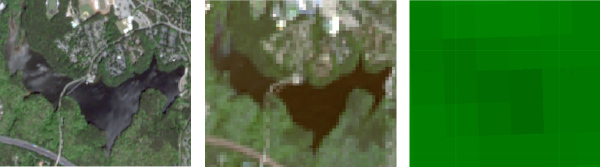
Figure 4. Lake Johnson Raleigh, NC shown in true color composite images of three satellite products: Sentinel-2 imagery (10 m resolution; left), Landsat 8 imagery (30 m resolution; middle), and Sentinel-3 imagery (300 m resolution; right).
How Do Satellites Detect Cyanobacterial Blooms?
Harmful Algal Blooms (HABs) are traditionally monitored by measuring the concentration of chlorophyll-a present in water. Chlorophyll-a, the pigment most commonly used for photosynthesis in plants and algae, typically indicates photosynthetic activity in waterbodies. Therefore, the concentration of chlorophyll-a often correlates with the amount of algae present. In addition to chlorophyll-a, cyanobacteria have other unique pigments. One of these pigments is called “phycocyanin,” which is blue. Because phycocyanin is blue rather than green like chlorophyll-a, it allows cyanobacteria to capture more energy from sunlight during photosynthesis. The presence of phycocyanin causes cyanobacterial blooms to reflect light differently than other chlorophyll-a-containing plants and algae, allowing cyanobacteria to be estimated separately from other photosynthetic organisms during satellite imagery processing (Urquhart et al. 2017). For an example of a processed satellite image that shows cyanobacteria blooms, see Figure 5. The imagery in this figure was obtained from Sentinel-3, developed by the European Space Agency, and the images were processed by the Cyanobacteria Assessment Network.
Some satellite data products, such as the European Space Agency’s Sentinel-3 Ocean and Land Colour Imager (OLCI) Level-2 water products, are preprocessed to produce chlorophyll-a estimates. Although Sentinel-3 can be used to detect phycocyanin—and, by extension, cyanobacteria—through additional processing, it is important to remember that the chlorophyll-a estimates correspond with all photosynthetic aquatic organisms rather than exclusively cyanobacteria. Accordingly, the chlorophyll-a band could be useful in monitoring all algae, not just cyanobacteria. OLCI water products are available through EUMETSAT’s CREODIAS Finder.
There is a publicly available dataset of Sentinel-3 OLCI images processed to specifically identify cyanobacteria called the Cyanobacteria Assessment Network (CyAN) (see Figure 5 for example imagery). This dataset is available for freshwater lakes in the contiguous U.S. and Alaska large enough to be detected by Sentinel-3’s 300 m resolution. More information about accessing and using the CyAN dataset can be found at NASA’s Ocean Color CyAN project web page.
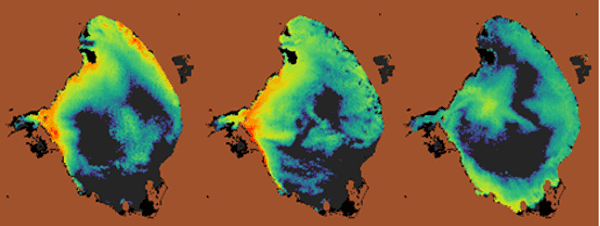
Figure 5. Processed Sentinel-3 imagery of cyanobacterial blooms in Lake Okeechobee, FL representing the highest concentration of cyanobacteria sensed over the course of three weeks.
Important Considerations When Using Satellite Imagery to Guide Management
Not all waterbodies are noticeable in satellite imagery. Because of variation in spatial resolution, different satellites can detect different water resources. According to the U.S. Geological Survey (USGS),
“Currently available satellites with the highest resolution, such as Landsat, can capture … 95 percent of the lakes with public drinking water intake locations. Unfortunately, these satellites make less frequent flyovers and are not equipped with sensors capable of distinguishing [Cyanobacterial Harmful Algal Blooms (CyanoHABs)] from other types of HABs. Lower resolution satellites capture less than 1 percent of waterbodies and only 33 percent of drinking water intakes but make flyovers that are more frequent and can identify CyanoHABs” (Loftin 2020).
Satellite imagery products with extremely fine spatial and temporal resolutions are commercially available if needed, but often come at a cost. However, as noted by the USGS, not every sensor can detect cyanobacteria. As shown in Figure 4, the same lake is not discernable at the resolution of Sentinel-3 imagery, which can specifically detect cyanobacterial blooms, even though it is clear in Sentinel-2 and Landsat 8 imagery, which cannot specifically detect cyanobacterial blooms. Key differences in these three satellite constellations are detailed in Table 1.
| Satellite Constellation | Agency | Spatial Resolution | Temporal Resolution | Can it Estimate Cyanobacteria? |
|---|---|---|---|---|
| Landsat 8
|
U.S. Geological Survey
|
30 m
|
8 days
|
No
|
| Sentinel-2
|
European Space Agency
|
10 m
|
2-5 days
|
No
|
| Sentinel-3
|
European Space Agency
|
300 m
|
1-3 days
|
Yes
|
Satellite images represent a snapshot in time, so a bloom that is present in one image may not be present all the time. Additionally, waterbodies may be obscured by cloud cover, making bloom detection difficult on overcast days.
Furthermore, the toxins produced by cyanobacteria cannot be detected by satellites. Because the amount of toxins produced by a cyanobacterial bloom is not necessarily correlated with the cell density of the bloom, the presence of a cyanobacterial bloom in imagery does not always equate to the presence of toxins. Additionally, it has been reported that satellite images may not identify all low-risk blooms as defined by the World Health Organization (Urquhart et al. 2017). The environmental triggers of toxin production in cyanobacteria are not yet fully understood, so the presence of toxins should be verified using additional methods.
Cyanobacteria can be distributed throughout the water column. Cyanobacteria can move vertically within the water column to access nutrients in deeper water when surface nutrients have been depleted. Given that satellites can only capture images of the surface of waterbodies, dense cyanobacterial blooms may be more intense than they appear in imagery. However, species containing gas vacuoles will most often congregate in the top 1 m of the water column to access light (Wynne 2011).
Ultimately, there are limits to what satellite imagery can capture. Although it is extremely helpful in understanding long-term trends in bloom formation, satellite imagery should supplement traditional monitoring techniques rather than replace them.
References
Loftin, K.A. 2020. “Satellite Imagery Used to Measure Algal Bloom Frequency—Steps Toward Understanding Exposure Risk.” USGS.
Urquhart, E. A., B. A. Schaeffer, R. P. Stumpf, K. A. Loftin, and P. J. Werdell. 2017. “A Method for Examining Temporal Changes in Cyanobacterial Harmful Algal Bloom Spatial Extent Using Satellite Remote Sensing.” Harmful Algae, 67, 144-152.
Wynne, T. T., R. P. Stumpf, M. C. Tomlinson, D. J. Schwab, G. Y. Watabayashi, and J. D. Christensen. 2011. “Estimating Cyanobacterial Bloom Transport by Coupling Remotely Sensed Imagery and a Hydrodynamic Model. Ecological Applications, 21(7), 2709-2721.
Publication date: Dec. 6, 2021
AG-902
N.C. Cooperative Extension prohibits discrimination and harassment regardless of age, color, disability, family and marital status, gender identity, national origin, political beliefs, race, religion, sex (including pregnancy), sexual orientation and veteran status.