
N.C. Plant Sciences Initiative (PSI) Extension Agent Network and Project Overview
Accurate, in-season assessment of blueberry yield and fruit maturity is critical for harvest timing, labor allocation, and market planning, yet it remains challenging under commercial field conditions. Through the N.C. Plant Sciences Initiative Extension Agent Network, researchers at North Carolina State University partnered with North Carolina Cooperative Extension agents and growers to evaluate an image-based application designed to estimate blueberry yield and maturity directly from field images. The application uses photos collected with handheld cameras or smartphones and applies deep learning models to detect berries, distinguish ripe and unripe fruit, and calculate maturity ratio. Field testing was conducted on commercial blueberry farms representing a wide range of farm sizes, production systems, and blueberry species. Extension agents played a central role in collecting images, validating model outputs, and providing grower-focused feedback, ensuring that the technology was evaluated under real-world conditions.
Across validations, maturity ratio (the proportion of ripe fruit) emerged as the most robust and practically useful output. Even when absolute berry counts varied, maturity estimates remained consistent, making this metric well suited for grower decision-making, particularly for harvest timing, labor planning, and U-pick readiness. In contrast, absolute berry counts were more sensitive to field and imaging conditions, including lighting intensity and angle; canopy density and fruit occlusion; image acquisition distance; and differences among blueberry species and cultivars. Results from this project also point to clear pathways for improvement. Model performance can be enhanced by incorporating newly collected images representing diverse lighting, canopy structures, and backgrounds. In parallel, adoption can be accelerated by refining image acquisition workflows through simple visual capture guidelines, standardized viewing angles, automated image-quality checks, and short, agent-led training demonstrations. Together, these refinements position the technology to transition from a research prototype to a practical, grower-ready decision-support tool, demonstrating the value of the PSI Extension Agent Network in advancing usable agricultural innovation.
Image-Based Blueberry Yield and Maturity Estimation
Accurate estimation of yield and maturity ratio is critical in blueberry production, particularly during the fruiting period when timely harvest, labor planning, and market decisions must be implemented quickly. To meet this need, an image-based application is being developed to automatically estimate blueberries counts and maturity ratio using photos captured in the field with handheld cameras or smartphones. Deep learning models process these images to identify berries and distinguish between ripe and unripe fruit, providing practical in-season decision-support metrics for growers. This tool supports blueberry growers seeking efficient ways to monitor crop development and also benefits Extension agents and researchers working to advance precision tools for specialty crops. The first version of the model was developed using breeding trial images from blueberry programs at the University of Georgia and NC State, and both the model and annotated image dataset are publicly available (Zhang et al. 2024).
Field Validation Across Diverse Farms and Conditions
For the blueberry yield-monitoring project's field-testing and validation stage, Extension agents played a central role in data collection and evaluation. The three agents participating in the PSI Extension Agent Network-led on-farm testing efforts were:
- Bruce McLean, Columbus County Center
- Cody Craddock, Randolph County Center
- Gabriella De Souza, New Hanover County Center
Together, the agents visited seven commercial blueberry farms and two research farms across North Carolina (Figure 1) and collected 126 images using handheld cameras and smartphones. The participating farms ranged widely in scale—from 2-acre U-pick operations to large commercial farms exceeding 1,000 acres. While southern highbush was the only species included in training the model, blueberry types tested also included northern highbush and rabbiteye varieties.
The agents ran the images through the blueberry counting application to obtain berry counts and maturity ratios (Figure 2). To evaluate accuracy, Craddock and De Souza conducted hands-on validation, harvesting berries from selected bushes and comparing physical counts with the artificial intelligence-generated results from images of the same plants. McLean explored a different question: whether berry counts varied depending on which side of the bush was imaged. He collected photos from both the north and south sides of plants and compared the results using the application, helping assess how image position may influence estimates.

Figure 1. Farms visited by Extension agents in 2024. Counties where the farms were located are highlighted in green.
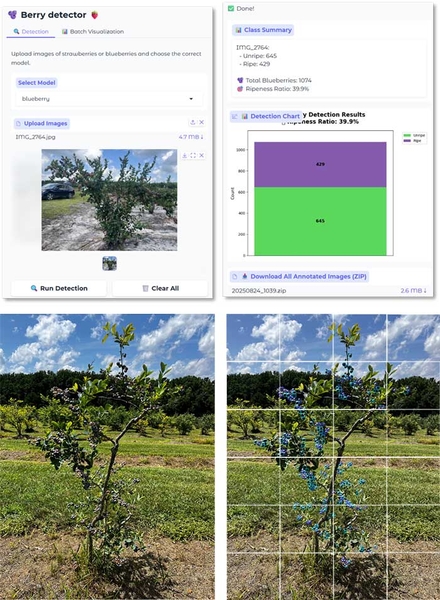
Figure 2. Web-based interface of the blueberry yield monitoring application and example field image alongside model-generated predictions
Key Findings
Validation of Berry Counts and Maturity Estimates
Two validation approaches were used to assess model performance. In the first validation, four rabbiteye blueberry bushes containing both ripe and unripe berries were hand-harvested and compared with image-based estimates (Table 1). The most consistent result across this validation was the maturity ratio, which showed a strong correlation between harvested and model-derived values (r = 0.96), with closely matched estimates. Total berry counts were also comparable for images 1 and 4; however, larger discrepancies were observed for images 2 and 3, indicating variability in berry count accuracy under certain conditions. The second validation focused exclusively on ripe berries and included visual field estimates of maturity ratio. Visual ratings, while commonly used by growers, are inherently subjective and categorical. In this validation, all bushes except for one received a maturity score of 8 on a scale of 1 to 9, corresponding to model-derived maturity ratios ranging from 87% to 99% (Table 2). Ripe berry counts from harvest and model prediction were moderately correlated (r = 0.73), though notable differences were observed for images 2, 4, 7, and 8.
Table 1. Results from the Harvested Berry Counts and the Counts Predicted by the Image-Based Model in Rabbiteye Blueberry
|
Image |
Harvested |
Model |
||||||
|
Unripe |
Ripe |
Total |
Maturity |
Unripe |
Ripe |
Total |
Maturity |
|
|
1 |
173 |
148 |
321 |
46% |
182 |
159 |
341 |
47% |
|
2 |
322 |
606 |
928 |
65% |
165 |
211 |
376 |
56% |
|
3 |
51 |
541 |
592 |
91% |
9 |
276 |
285 |
97% |
|
4 |
169 |
209 |
378 |
55% |
152 |
198 |
350 |
57% |
|
r* |
0.75 |
0.73 |
0.30 |
0.96 |
|
|
|
|
*r is the Pearson correlation coefficient between harvested-based and model-based results. A higher number means more positive correlation. ↲
Table 2. Results from the Harvested Berry Counts and the Counts Predicted by the Image-Based Model in Highbush Blueberry
|
Image |
Harvested |
Model |
||||||
|
Unripe |
Ripe |
Total |
Maturity |
Unripe |
Ripe |
Total |
Maturity |
|
|
1 |
|
203 |
|
8 |
24 |
161 |
185 |
87% |
|
2 |
|
467 |
|
8 |
14 |
297 |
311 |
99% |
|
3 |
|
248 |
|
8 |
12 |
274 |
286 |
96% |
|
4 |
|
530 |
|
8 |
21 |
788 |
809 |
97% |
|
5 |
|
188 |
|
8 |
31 |
232 |
263 |
88% |
|
6 |
|
246 |
|
8 |
37 |
385 |
422 |
91% |
|
7 |
|
241 |
|
8 |
22 |
402 |
424 |
95% |
|
8 |
|
207 |
|
7 |
281 |
24 |
305 |
92% |
|
r* |
|
0.73 |
|
|
|
|
|
|
*r is Pearson correlation coefficient between harvested-based and model-based results. A higher number means more positive correlation. ↲
Effect of Image Acquisition Orientation
Assessment of image acquisition orientation revealed informative patterns (Figure 3). Berry counts derived from images taken on the north and south sides of the same bush showed the weakest correlation for unripe berries, suggesting reduced robustness of the model in detecting unripe berries. This sensitivity may be related to lighting conditions, fruit color contrast, or occlusion effects, which can vary substantially with image orientation. In contrast, the maturity ratio remained relatively consistent, indicating that proportional estimates are more stable than absolute counts across viewing angles.
False Positives and Background Interference
The model occasionally produced false positives when encountering non-berry objects with similar color or reflectance characteristics. Identified sources of misclassification included black plastic mulch, white pickup trucks, and sunlight speckles within the canopy. These observations highlight the importance of incorporating more diverse background conditions into training datasets to improve model robustness under field conditions. Future model refinement can incorporate additional background-only training data, including curated farm images and selected samples from large-scale object recognition datasets (for example, Common Objects in Context, or COCO), to improve robustness and reduce misclassification of irrelevant objects.

Figure 3. Berry counts and ripe ratio from the images taken from the north versus the south. Green triangle symbols indicate unripe berries; purple and round symbols indicate ripe berries.
Practical Implications for Growers
Across field validations, the maturity ratio (ripe fruit as a proportion of total fruit) proved to be the most consistent and reliable output from the image-based model. Even when absolute berry counts varied, maturity estimates remained stable, making this metric especially useful for grower decision-making related to harvest timing, labor planning, and U-pick readiness. In contrast, absolute berry counts were more sensitive to field and imaging conditions, including lighting intensity and angle, canopy density and fruit occlusion, image acquisition distance, and differences among blueberry species and cultivars. These interacting factors help explain variability observed in absolute berry counts and highlight why counts are inherently more challenging than proportional metrics such as maturity ratio.
Next Steps Toward a Grower-Ready Tool
Model robustness can be improved by incorporating the newly collected images into training, particularly those representing diverse lighting conditions, canopy structures, and backgrounds. In parallel, making image acquisition more user-friendly will be critical for adoption. Simple visual guidelines, standardized best-practice viewing angles, automated image-quality checks, and short, agent-led training demonstrations can help ensure consistent image collection without increasing technical burden on growers. Together, these refinements will support the transition of the tool from a research prototype to a practical, grower-ready decision-support system that fits seamlessly into growers’ existing workflows.
Why Extension Agent Involvement Matters
For Extension agents, involvement in the PSI Extension Agent Network goes beyond testing new tools, reshaping how innovations are developed and delivered. Through the PSI network, we are flipping the script: Growers become partners. They enjoy seeing cutting-edge technology tested on their farm, and that creates a more reciprocal relationship. On-farm testing strengthens trust and relevance. The experience also gives agents insight into how technologies move from concept to prototype, helping them better communicate new tools and set realistic expectations for growers.
Reference Cited
Zhang, J., J. Maleski, H. Ashrafi, J. A. Spencer, and Y. Chu. 2024. "Open-Source High-Throughput Phenotyping for Blueberry Yield and Maturity Prediction Across Environments: Neural Network Model and Labeled Dataset for Breeders." Horticulturae 10 (12): 1332.
Publication date: April 22, 2026
AG-1006
N.C. Cooperative Extension prohibits discrimination and harassment regardless of age, color, disability, family and marital status, gender identity, national origin, political beliefs, race, religion, sex (including pregnancy), sexual orientation and veteran status.