
Summary
The goal of this trial was to evaluate different strawberry cultivars inoculated with Neopestalotiopsis (Neo-P) in yield performance and disease susceptibility. This was a no-spray trial, which means no fungicide sprays were conducted. The trial was planted in October 2025, grown under typical plasticulture practices, and inoculated with spore suspension of mixed Neo-P isolates shortly after planting and again in early spring. Yield data was evaluated from late March to mid-May 2026 and disease severity from late March to mid-June 2026. All 13 evaluated cultivars were propagated from tissue culture at the NC State University indoor strawberry nursery. Out of the 13 cultivars evaluated, the ones with the highest marketable yield were Rocco with 323 g per plant and Scarlet with 305 g per plant. The cultivars with the lowest yield were ‘921’ with 101 g per plant, and Ruby June with 119 g per plant. Rocco, Scarlet and ‘921’ did not show high disease incidence, promoting them to their natural yield potential. Ruby June, however, showed very high disease susceptibility, significantly lowering its yield potential. Similarly, Miss Jo, Fronteras, Camarosa and Chandler were significantly affected by Neo-P, compared to the most disease-tolerant cultivars.
Introduction
In recent years, Neo-P has emerged as a major threat to strawberry production on the East Coast, causing leaf spot, crown rot, and fruit rot. The first major outbreak of Neo-P-related disease took place in Florida in 2017, and the pathogen has since spread rapidly across all strawberry-growing regions in North America, with many reports being from the Southeastern United States. North Carolina experienced its first major outbreak of Neo-P during the 2024-25 growing season, with multiple fruiting fields showing signs of infection.
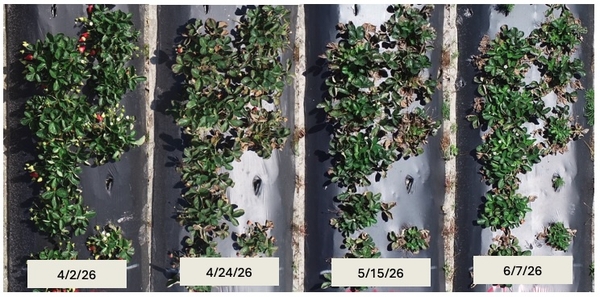
Neo-P can be spread through infected nursery stock, rain splash, wind, or contaminated tools and is able to infect the leaves, petioles, fruit, and crowns of strawberry plants (Figure 1). Leaf spots are often circular, tan to brown, and of various sizes. They can coalesce into larger, irregularly shaped lesions that eventually kill entire leaves. Petiole lesions are sunken and dark brown to black in color. Severe petiole lesions will kill all above leaf tissue and may spread to the crown tissue, resulting in the development of crown rot symptoms. Fruit rot symptoms appear as shriveled, dry, light-tan lesions. Neo-P leaf spot and fruit rot symptoms can resemble those caused by other pathogens (such as Anthracnose) but can be distinguished by the presence of black spore masses near the lesion’s center. Crown infections are the most devastating symptom in NC and cause wilting, stunting, and eventual death. Lower leaf reddening is often characteristic of a Neo-P infection and may be a sign of eventual crown collapse but is not diagnostic. Laboratory confirmation is often needed for accurate diagnosis, especially for crown rot symptoms, and growers are encouraged to reach out to their extension agents or plant disease diagnostic clinic for assistance.
Neo-P crown infections often begin at a young plant age and can travel with transplants. Plants can remain symptomless until well after planting. Thus, the most effective management practices for preventing disease progression are proactive: Using plant material that is less likely to be diseased, less susceptible strawberry cultivars if your market allows that, rigorous and frequent post-planting scouting, removing diseased plants if necessary, up-to-date spray equipment, and keeping a vigorous disease management program in fall and winter. If a farm has a history of Neo-P infection, it is important to bury old strawberry crowns, rotate fields if possible, and fumigate beds prior to planting, as infected plant tissue can harbor the pathogen between growing seasons. If infection is present during the season, removing symptomatic plants, working in infected fields last, and using sanitization practices are key to prevent further spread. Fungicides may be effective for preventing the fruit rot and leaf spot stage.
The goal of this study was to evaluate strawberry cultivars' tolerance to a mixed inoculum of Neo-P collected from NC isolates. Our hypothesis was that cultivars will vary in susceptibility and yield impact from Neo-P infections. This is the second year of the continuous evaluation of cultivar susceptibility to Neo-P (Preliminary Evaluation of NC Strawberry Cultivars For Susceptibility to Neopestalotiopsis Leaf and Fruit Rot).
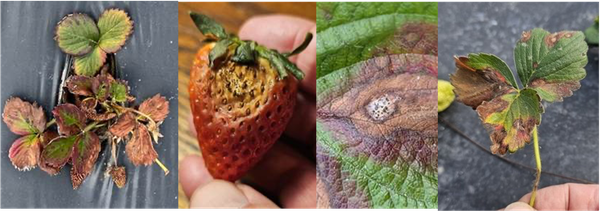
Figure 1. Typical symptoms seen from Neopestalotiopsis spp. infection on different plant parts.
This project featured 2 different individual trials:
Trial 1 was a replicated trial with 13 strawberry cultivars commonly grown throughout NC. These cultivars were Rutgers: Scarlet, 921 (unreleased); NC State University: Rocco, Liz; Lassen Canyone/Good Farms: Ruby June, Ashley Jay, Miss Jo; UC Davis: Chandler, Monterey, Fronteras, Camarosa, Finn, Portola. The trial had 3 replicates with 20 plants per plot. All plants were sourced from tissue culture and propagated for two generations in the NC State indoor strawberry nursery, rooted for 30 days in 50-cell trays in a greenhouse, and planted into research fields at the Horticulture Research Station in Castle Hayne, NC.
Trial 2 consisted of additional cultivars from the UC Davis Breeding program: Surfline, Monarch, Eclipse, Keystone, Golden Gate, Mojo, Finn. These plots had 20 plants per plot and were not replicated. Plants were bare-root plants derived from a California nursery.
Inoculation of Plants
All plants were planted on October 7, 2025. On November 6, 2025, all plants in Trial 1 were inoculated with a mixture of Neo-P strains collected from commercial NC strawberry fields. Inoculations were done by spraying a spore suspension on whole plants and targeting the crown using a hand pump sprayer until runoff (~10 ml per plant). Plants were inoculated earlier, and the crown was targeted in this season to try to promote crown rot infections and develop higher levels of infection. Plants in Trial 1 were inoculated using the same methods again on March 9, 2026, along with plants in Trial 2.
Yield and Disease Assessments
Plants were assessed for fruit yield and disease severity. Fruit yield was collected from March 27 to May 15, spanning a 7-week season. After picking, fruit was sorted based on marketable or unmarketable fruit. Fruit was considered unmarketable if it was small (approximately less than 10g), misshaped, or diseased. Disease severity was rated on a 10% ordinal rating scale with additional intervals <10% to capture early disease progression based on symptoms observed above-ground, including area of leaves with spots, amount of leaf death, and plant collapse. All plants in Trial 1 were rated weekly from March 27 to June 11, 2026. Ratings from Trial 1 were then used to create a disease progress curve for each variety showing the progression of disease throughout the season. The area under the disease progress curve (AUDPC) was then calculated using the midpoint method for all varieties to summarize the total disease over time and converted to the relative area under the disease progress curve (rAUDPC) to standardize the disease severity as a proportion for comparison between varieties. The number of dead plants in Trial 1 was counted at the end of the observation period to calculate the percent survival. All plants in Trial 2 were rated every other week from April 10 to June 4, 2026. The final average severity of plants in Trial 2 was used for comparison.
Results
Marketable Yield
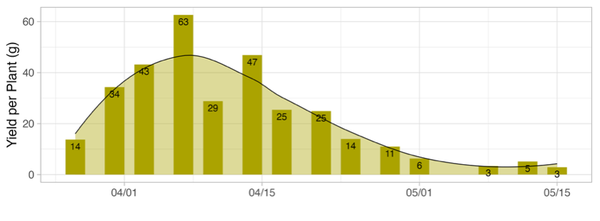
Trial 1: Plants were harvested twice a week from March 27 to May 15, totaling 14 harvests. (Figure 2). Top producers were Rocco with 323 g marketable yield per plant, Scarlet with 305 g, and Fronteras with 245 g. The smallest producers were 921 with 101 g, Ruby June with 119 g, and Finn 122 g. Cultivars with early-season high yields were Rocco, Fronteras, Camarosa, and Monterey.
Trial 2: Plants were harvested once a week from March 31 to May 12, tallying 6 harvests. Keystone had the highest marketable yield with 279 g, followed by Surfline with 219 g (Figure 3).
Disease Rating
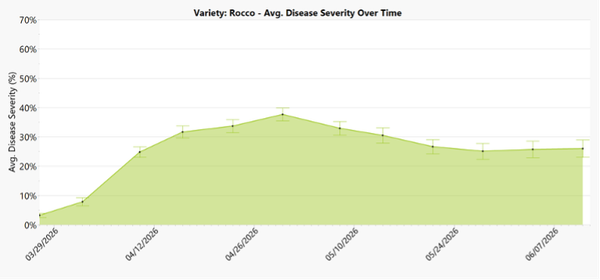
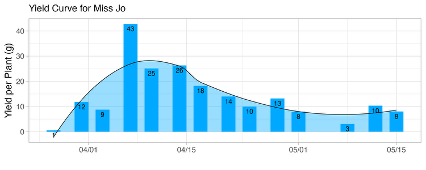
Trial 1: Disease progressed for all varieties throughout the season, with severity reaching its peak around the end of April (Figure 4). The cultivar with the highest rAUDPC was Ruby June at 51.72%, followed by Miss Jo at 42.46% and Portola at 37.83%. The cultivars with the lowest rAUDPC were 921 at 6.14%, followed by Scarlet at 10.28% and Liz at 22.49% (Figure 5). These rAUDPC values were converted to a susceptibility scale to characterize the level of tolerance among the cultivars in comparison to one another (Table 1). Ruby June was classified as Highly Susceptible; Miss Jo and Portola as susceptible; Fronteras, Camarosa, Monterey, Chandler, Finn, and Rocco as moderately susceptible; Liz as moderately tolerant; Scarlet as tolerant; and 921 as highly tolerant. No variety showed complete resistance to Neopestalotiopsis sp. infection. Ruby June and Miss Jo had the lowest stand survival at the end of the observation period, with Finn, Rocco, Liz, Scarlet, and 921 having the highest survivability (Figure 6). Neopestalotiopsis sp. was confirmed to be the cause of crown rot through isolation of crown tissue from partially collapsed and fully collapsed plants collected at the end of the observation period.
Trial 2: The variety showing the highest average disease severity at the end of the observation period was Eclipse at 33.82% followed by Golden gate at 30.00% and Finn at 27.11% (Figure 7). Keystone showed the lowest average disease severity at 10.14%, followed by Monarch at 13.17% and Surfline at 18.38%.
Figure 2. 2026 Yield per plant (in g) for replicated trial featuring commonly grown strawberry cultivars inoculated with Neo-P. Rocco and Scarlet had the highest yield with over 300 g yield per plant. Letter groupings above the bars represent statistical difference between cultivars. Here, ‘921’, Ruby June, Finn, and Portola yielded significantly less than Scarlet and Rocco. All other cultivar comparisons were not statistically different.
Figure 3. Yield per plant (g) for UC Davis cultivars inoculated with Neo-P through the 2026 season. This trial was comprised of one 20-plant plot per cultivar.
Figure 4. Disease progress curve showing the severity of foliar symptoms caused by Neopestalotiopsis sp. infection on the 12 different strawberry cultivars from 3/27/26-6/11/26 in the replicated trial at the Horticultural Crops Research Station in Castle Hayne, NC.
Figure 5. Mean relative area under the disease progress curve (rAUDPC) showing the relative disease intensity of Neopestalotiopsis sp. infection on the 12 different strawberry cultivars in the replicated trial at the Horticultural Crops Research Station in Castle Hayne, NC. Bars with the same letter above them are not significantly different according to Tukey’s HSD (α=0.05).
Figure 6. Percentage of alive plants (Survival) per variety at the end of the rating period for the replicated trial at the Horticultural Crops Research Station in Castle Hayne, NC. Bars with the same letter above them are not significantly different according to Tukey’s HSD (α=0.05).
Figure 7. Average severity of foliar symptoms caused by Neopestalotiopsis sp. infection on UC Davis cultivars at the end of the observation period (6/4/26).
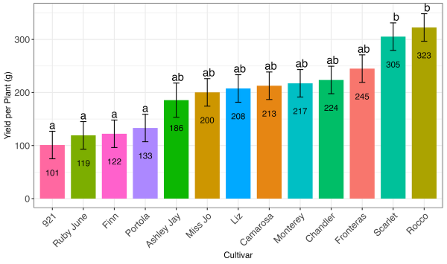
Figure 2. 2026 Yield per plant (in g) for replicated trial featuring commonly grown strawberry cultivars inoculated with Neo-P. Rocco and Scarlet had the highest yield with over 300 g yield per plant.
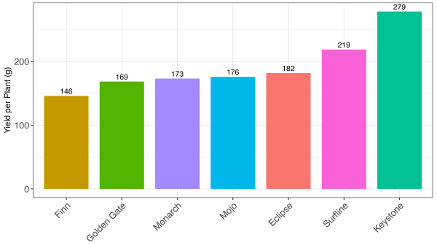
Figure 3. Yield per plant (g) for UC Davis cultivars inoculated with Neo-P through the 2026 season. This trial was comprised of one 20-plant plot per cultivar.
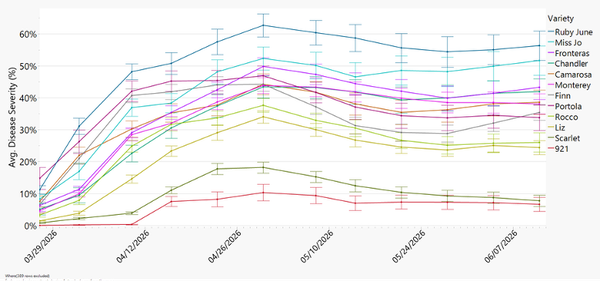
Figure 4. Disease progress curve showing the severity of foliar symptoms caused by Neopestalotiopsis sp. infection on the 12 different strawberry cultivars from 3/27/26-6/11/26.
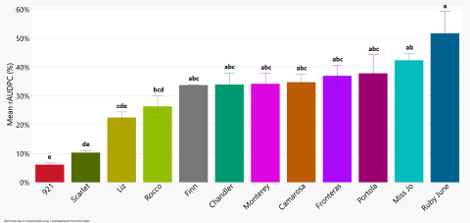
Figure 5. Mean relative area under the disease progress curve (rAUDPC) showing the relative disease intensity of Neopestalotiopsis sp. infection on the 12 different strawberry cultivars in the replicated trial at the Horticultural Crops Research Station in Castle Hayne, NC.
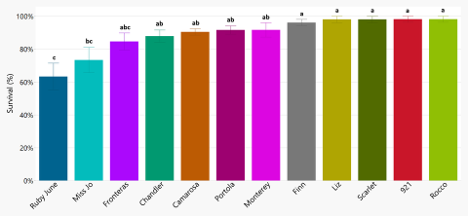
Figure 6. Percentage of alive plants (Survival) per variety at the end of the rating period for the replicated trial at the Horticultural Crops Research Station in Castle Hayne, NC. Bars with the same letter above them are not significantly different according to Tukey’s HSD (α=0.05).
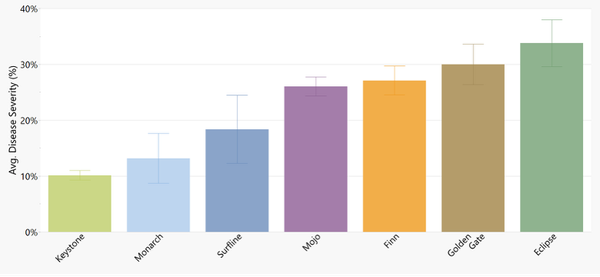
Figure 7. Average severity of foliar symptoms caused by Neopestalotiopsis sp. infection on UC Davis cultivars at the end of the observation period (6/4/26).
Discussion
Since this is the second year of the Neo-P inoculation, we were able to compare yields over both years. Cultivars had similar yield curves when compared between the 2025 and 2026 seasons (Figure 8). For example, Rocco and Fronteras start off with a high yield early in the season for both years. Furthermore, ‘921’ was the lowest producer both years, while Fronteras and Camarosa were in the top 4 producers both years, even under disease pressure.
Despite disease severity levels being lower overall when compared to last season, earlier inoculations and targeting of the crown led to crown rot infections and strong disease progression throughout the season. Ruby June and Miss Jo, two varieties that showed faster and more severe disease progression in the 2026 season, also ranked at the highest end of average disease severity in the 2025 season (Figure 9). The varieties that showed the lowest average disease severity at the end of last season, such as Liz, Scarlet,
Despite disease severity levels being lower overall when compared to last season, earlier inoculations and targeting of the crown led to crown rot infections and strong disease progression throughout the season. Ruby June and Miss Jo, two varieties that showed faster and more severe disease progression in the 2026 season, also ranked at the highest end of average disease severity in the 2025 season (Figure 9). The varieties that showed the lowest average disease severity at the end of last season, such as Liz, Scarlet, and 921, also showed the lowest rAUDPC in the 2026 season. The ability to achieve crown rot after earlier inoculations and targeting of the crown in the 2026 season shows that the timing of inoculation, length of the infection period, and the area of inoculation may play a role in the likelihood of whole plant collapse and types of symptoms seen from Neopestalotiopsis sp. infections. Survival data from 2026 also reflects the same patterns seen in susceptibility across both years.
For management of above-ground symptoms (leaf spot, fruit rot, and petiole lesions), fungicide options with proven effectiveness against NeoP are available. In fields that have NOT had NeoP problems in the last two years and plants are symptom-free upon planting, broad-spectrum fungicides like thiram or captan can be applied as needed or at 10-14 day intervals. If fields have had NeoP infections within the last two years, transplants arrive with symptoms, or above-ground symptoms become present in the growing season, more aggressive fungicide options may be needed. Broad-spectrum fungicides like thiram and captan should remain the backbone of your spray schedule to keep inoculum levels low, but rotation or tank mixes with products containing fludioxonil, propiconazole, difenoconazole, and flutriafol can help provide better disease management. NeoP also thrives in wet conditions, so tightening your spray program to 7-10 days is beneficial. Some of these fungicides, such as Switch or Miravis Prime, have limitations on the amount applied per season and are also needed for management of other pathogens such as Botrytis or Anthracnose Fruit rot. As a result, most, if not all, of their applications should be reserved for the spring, where they can help manage NeoP and fruit rot infections. For more details on fungicide options for management of NeoP, see articles on suggested Post-Planting and Spring Disease Control spray schedules.
|
Variety |
Mean rAUDPC (%)a |
Susceptibility scale valuesb |
Designationc |
Survival (%)d |
||
|---|---|---|---|---|---|---|
|
Ruby June |
51.72 |
a |
9.00 |
Highly susceptible |
63.29 |
c |
|
Miss Jo |
42.36 |
ab |
7.36 |
Susceptible |
73.33 |
bc |
|
Portola |
37.83 |
abc |
6.56 |
Susceptible |
91.62 |
ab |
|
Fronteras |
36.96 |
abc |
6.41 |
Moderately Susceptible |
84.64 |
abc |
|
Camarosa |
34.75 |
abc |
6.02 |
Moderately Susceptible |
90.41 |
ab |
|
Monterey |
34.20 |
abc |
5.93 |
Moderately Susceptible |
91.67 |
ab |
|
Chandler |
33.92 |
abc |
5.88 |
Moderately Susceptible |
87.87 |
ab |
|
Finn |
33.74 |
abc |
5.84 |
Moderately Susceptible |
96.08 |
a |
|
Rocco |
26.34 |
bcd |
4.55 |
Moderately Susceptible |
98.15 |
a |
|
Liz |
22.49 |
cde |
3.87 |
Moderately Tolerant |
98.04 |
a |
|
Scarlet |
10.28 |
de |
1.73 |
Tolerant |
98.04 |
a |
|
921 |
6.14 |
e |
1.00 |
Highly Tolerant |
98.15 |
a |
aMean relative area under the disease curve (rAUDPC) was calculated by dividing the area under the disease progress curve (AUDPC) by the total maximum area possible for the observation period. The rAUDPC tracks how fast infection progresses and how severe infection becomes over time scaled as a relative proportion for comparison between varieties. Means within a column followed by the same letter are not significantly different according to Tukey’s HSD (α=0.05). ↲
bSusceptibilty scale values are a 0-9 scale that reflects disease severity based on the number of observed healthy plants throughout the season in plots heavily infested with disease. The higher the susceptibility scale value, the more susceptible the variety is to disease. ↲
cThe designation is based on the 0-9 susceptibility scale. Designation goes as follows: SSV < 1.5 is "Highly tolerant", SSV < 2.5 is "Tolerant", SSV < 3.5 is "Moderately tolerant", SSV < 5.5 is "Moderately susceptible", SSV < 7.5 is "Susceptible", and SSV < 8.5 is "Highly susceptible." ↲
dSurvival (%) ratings are the percentage survival based on the number of alive plants at end of season in fields heavily infested with disease. High survival ratings indicate higher levels of tolerance. Means within a column followed by the same letter are not significantly different according to Tukey’s HSD (α=0.05). ↲
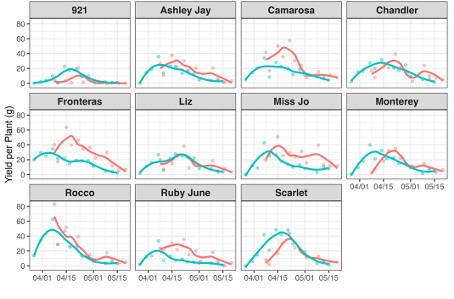
Figure 8. Yield per plant over time for cultivars grown in both the 2025 and 2026 Neo-P trials. For both years plants were picked twice a week for the duration of the harvest season.
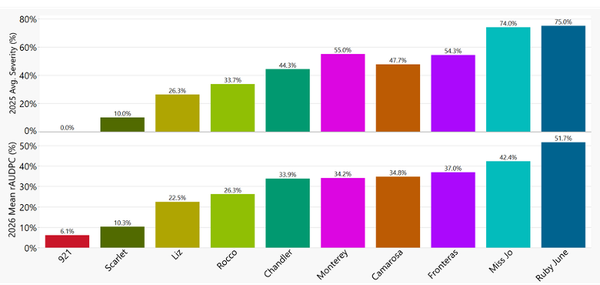
Figure 9. Comparison between 2025 % average disease severity at end of the observation period (top) and the 2026 mean rAUDPC (bottom).
Related Articles & Resources
Preliminary Evaluation of NC Strawberry Cultivars For Neo-P Susceptibility (2025)
Updated Post-Planting (Fall 2025) Recommendations for Managing Neopestalotiopsis
Individual Cultivar Performance in 2026
921
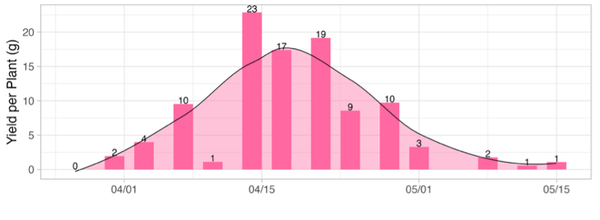
Variety: 921 — Yield
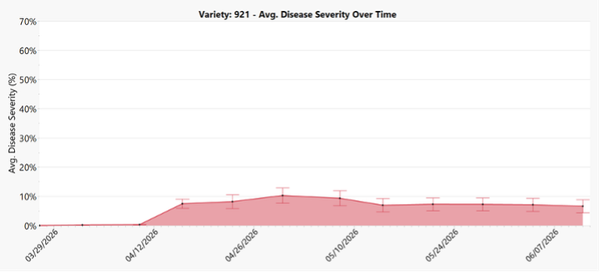
Variety: 921 — Average Disease Severity Over Time
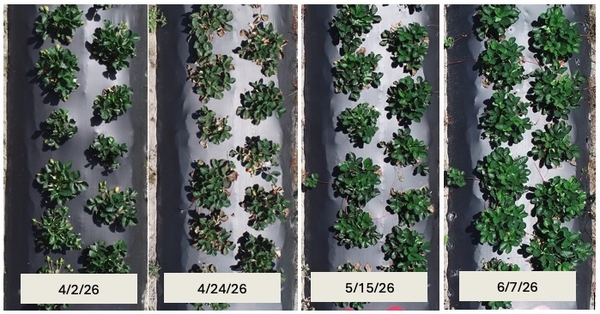
Variety: 921 — Photos
Ruby June
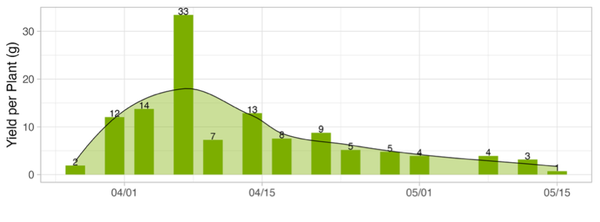
Variety: Ruby June — Yield
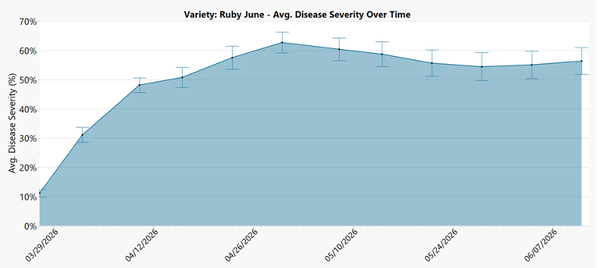
Variety: 921 — Average Disease Severity Over Time
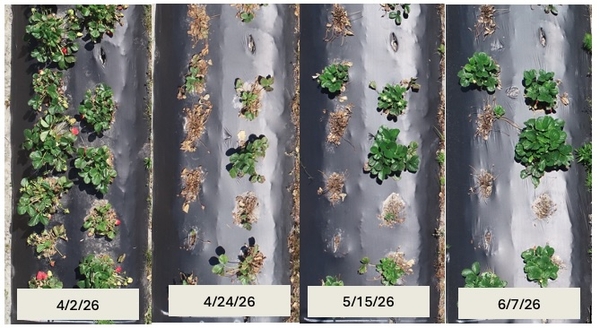
Variety: Ruby June — Photos
Finn
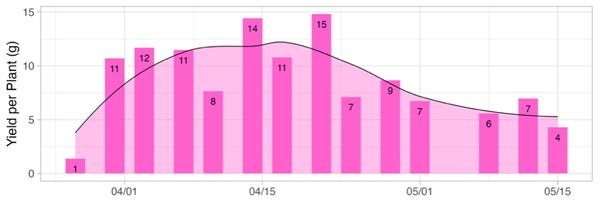
Variety: Finn — Yield

Variety: Finn — Average Disease Severity Over Time
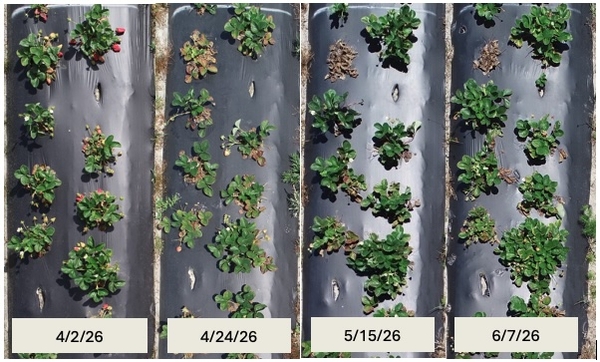
Variety: Finn — Photos
Portola
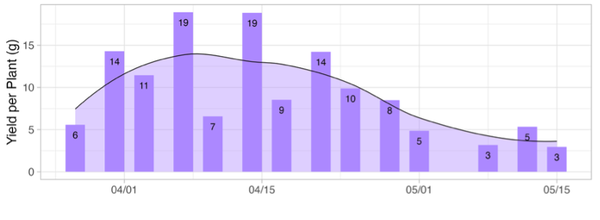
Variety: Portola — Yield
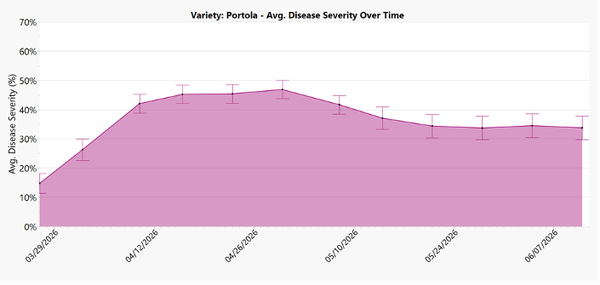
Variety: Portola — Average Disease Severity Over Time
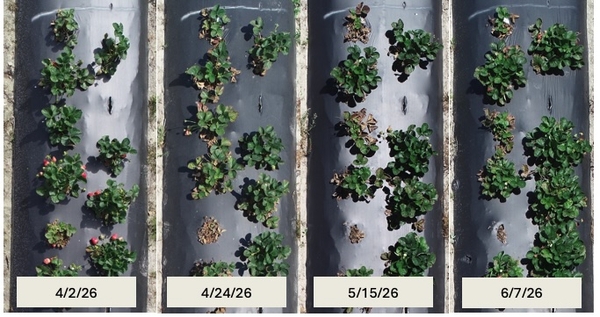
Variety: Portola — Photos
Ashley Jay
Ashley Jay not evaluated for Average Disease Severity due to low quantity of plants.
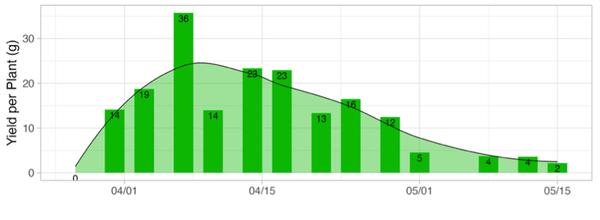
Variety: Ashley Jay — Yield
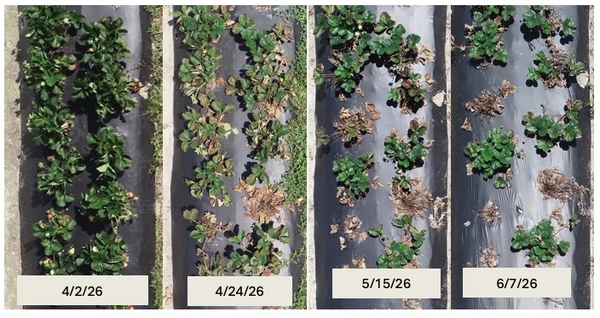
Variety: Ashley Jay — Photos
Liz
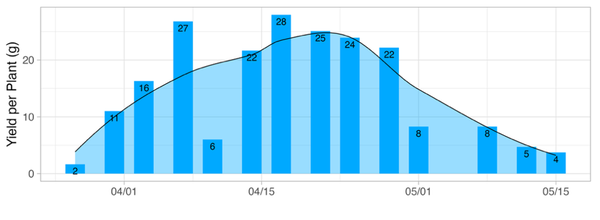
Variety: Liz — Yield
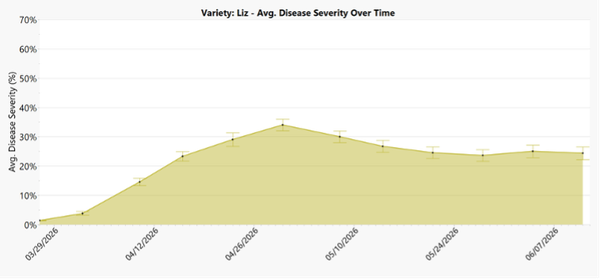
Variety: Liz — Average Disease Severity Over Time
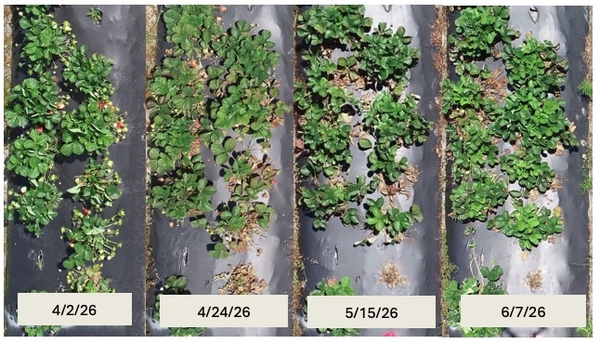
Variety: Liz — Photos
Camarosa
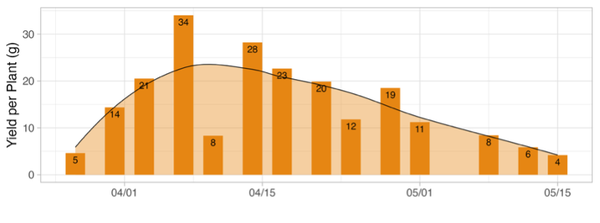
Variety: Camarosa — Yield
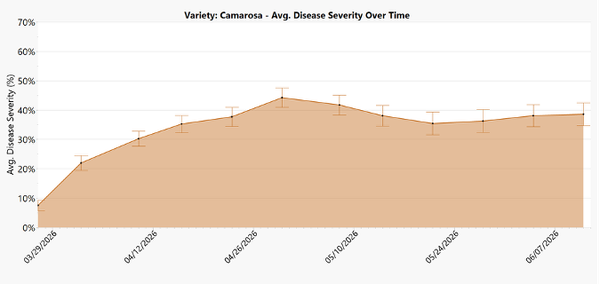
Variety: Camarosa— Average Disease Severity Over Time
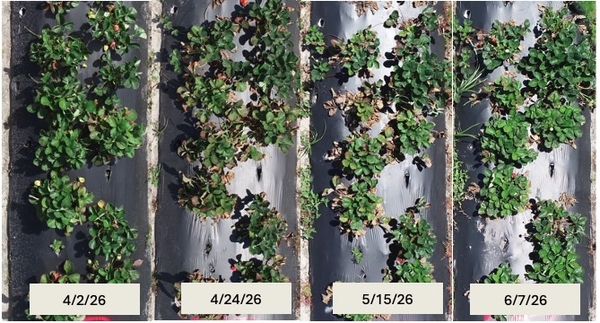
Variety: Camarosa — Photos
Monterey
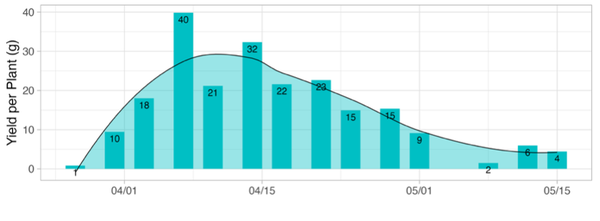
Variety: Monterey — Yield
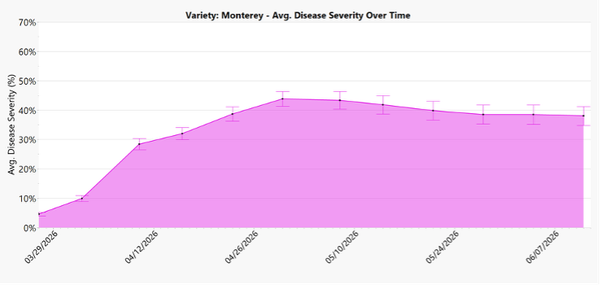
Variety: Monterey — Average Disease Severity Over Time
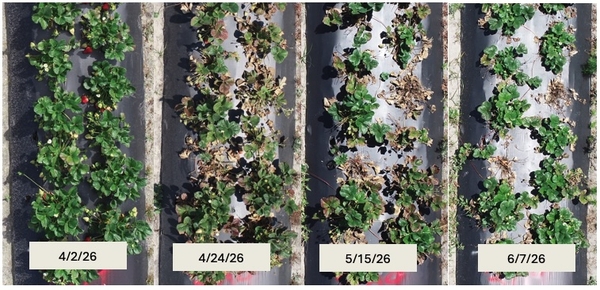
Variety: Monterey — Photos
Chandler
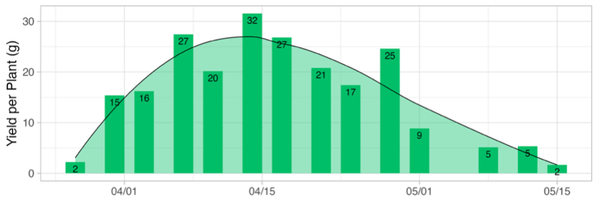
Variety: Chandler — Yield
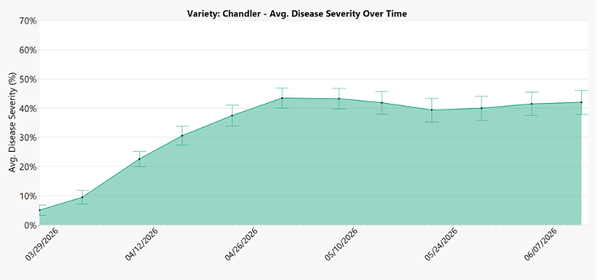
Variety: Chandler — Average Disease Severity Over Time
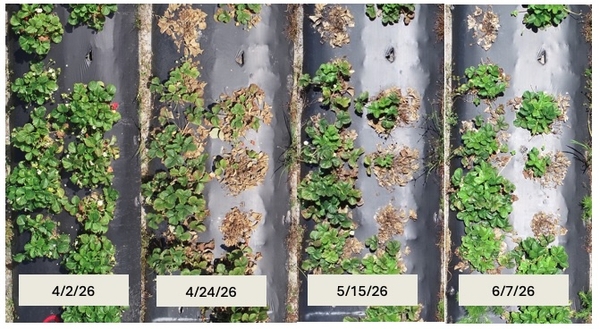
Variety: Chandler — Photos
Fronteras
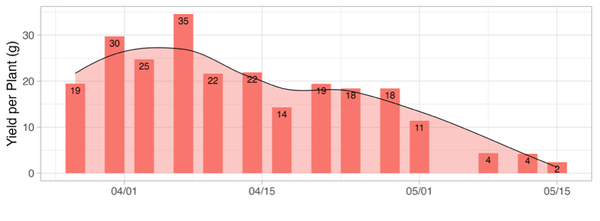
Variety: Fronteras — Yield
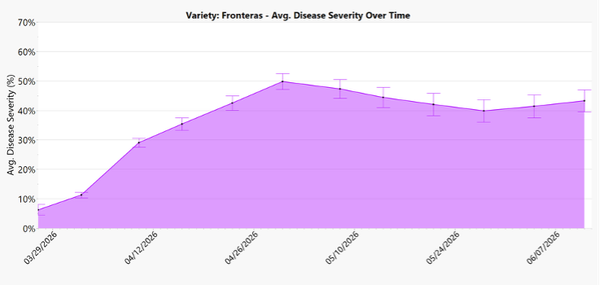
Variety: Fronteras — Average Disease Severity Over Time
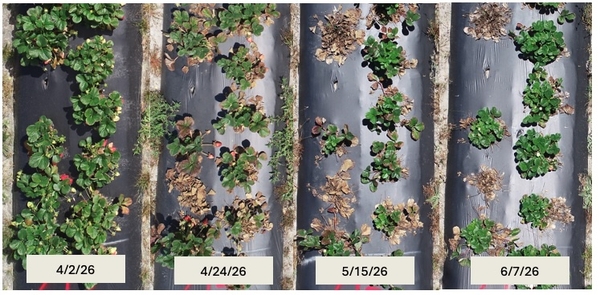
Variety: Fronteras — Photos
Scarlet
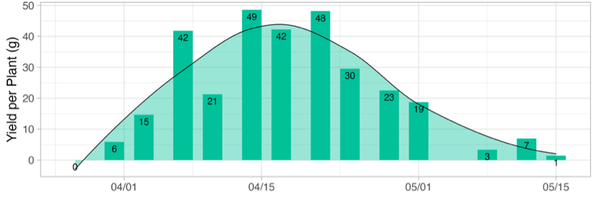
Variety: Scarlet — Yield
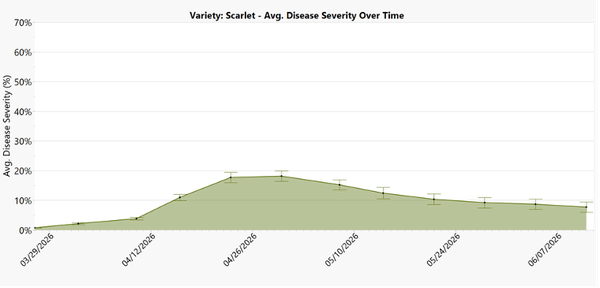
Variety: Scarlet — Average Disease Severity Over Time
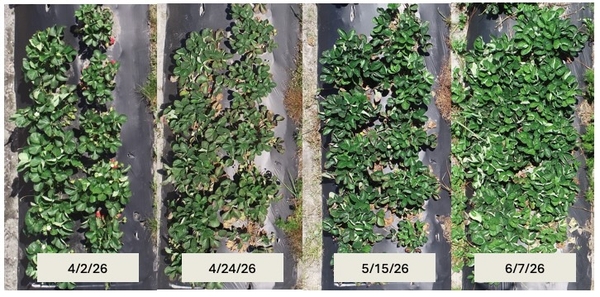
Variety: Scarlet — Photos
Rocco
Variety: Rocco — Yield
Variety: Rocco — Average Disease Severity Over Time
Variety: Rocco — Photos
Miss Jo
Variety: Miss Jo — Yield
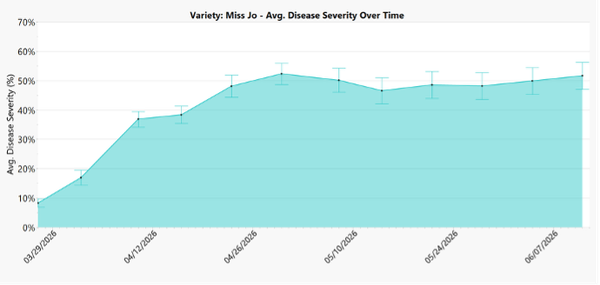
Variety: Miss Jo — Average Disease Severity Over Time
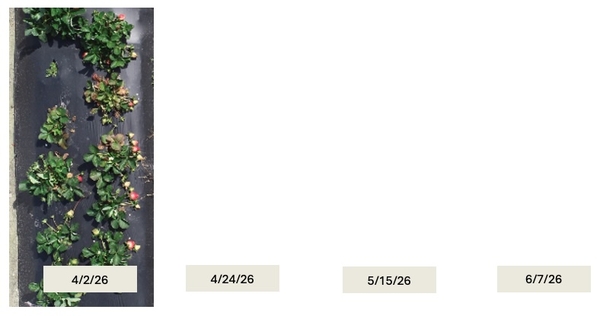
Variety: Miss Jo — Photos
Acknowledgements
This work was funded by:
NCDA&CS - North Carolina Agriculture Innovations and Research (NCAIR) grant number 25-025-4018.
NCDA&CS - North Carolina Specialty Crop Block Grant grant number 24-060-4011
NC Strawberry Grower Association
Publication date: Aug. 21, 2026
Reviewed/Revised: Aug. 6, 2026
N.C. Cooperative Extension prohibits discrimination and harassment regardless of age, color, disability, family and marital status, gender identity, national origin, political beliefs, race, religion, sex (including pregnancy), sexual orientation and veteran status.