Introduction
By routinely measuring the electrical conductivity (EC) and pH of growing media and irrigation water for container-grown nursery crops, growers can monitor nutrient availability and scout for problems. This does not have to be time-consuming, complicated, or difficult. Learn how to use the pour-through extraction procedure as part of your nursery’s quality control program.
The nutrients available to container-grown plants can be estimated by measuring how well the leachate (the solution that drains from containers) conducts electricity. Pure water does not conduct electricity. Electrical conductivity increases proportionally, however, with the dissolved salts (nutrients from fertilizers) present in the solution. Therefore, measuring electrical conductivity (EC) indicates the nutrient concentrations available to container-grown plants.
Pour-Through Extraction Procedure
The pour-through extraction procedure does not disturb plant roots as do other procedures that require removing potting media from containers or sending samples to a laboratory. When plants are watered to container capacity, fertilizer nutrients are dissolved in the water available for plant uptake. As additional water is gently “poured through” the container substrate (the growing media), it displaces the water in the perched water table at the container bottom, and this water can be collected as it leaches from the drainage holes. Because any dissolved nutrients available to the plant are in this leachate, its EC and pH become good diagnostics for nutrient levels and availability.
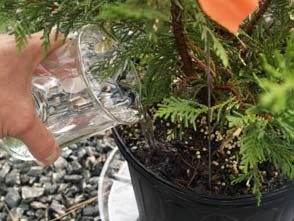
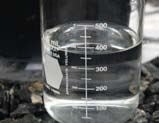
The goal is to collect approximately 50 ml (1.7 oz) of leachate from each container. To collect leachate, wait 30 minutes to 2 hours after a thorough irrigation (preferably, the substrate in the container would have reached container capacity). Next pour approximately 120 ml (4 oz) of irrigation water over the surface of a 4-liter (1 gal) container or growing bag. More water is required for larger containers, for substrates with high water-holding capacities, and for containers that may not have been irrigated thoroughly (Table 1).
zGallons, ounces, and their conversions to liters and milliliters are rounded.
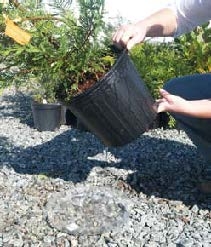
Leachate solutions can also be obtained by tipping a container slightly sideways to collect the drainage from holes in the container’s bottom. Tipping is usually successful for obtaining leachate 30 to 60 minutes after irrigation; it does not require a “pour-through” of water because it forces the water out of the perched water table by tipping rather than displacing.
The tipping and pour- through techniques both provide accurate but average readings of the EC and pH values of the solution surrounding a plant’s roots. When plants are irrigated, water dissolves salts from fertilizer in the substrate and these nutrients are carried through the container to the solution in the perched water table. When that leachate is measured, it provides an average reading of the nutrients available to the plant.
Water used to irrigate nursery crops also contributes to the pH, EC, and nutrient levels in the container leachate. To determine its contribution, sample nursery irrigation water from an irrigation nozzle just before it is applied to crops rather than collecting water from the surface of an irrigation basin or at the pump.
Subtract the EC value of the irrigation water from the EC value of the container leachate to determine the soluble salt concentrations in the container derived from the fertilizer in the substrate and the irrigation water applied.
Equipment
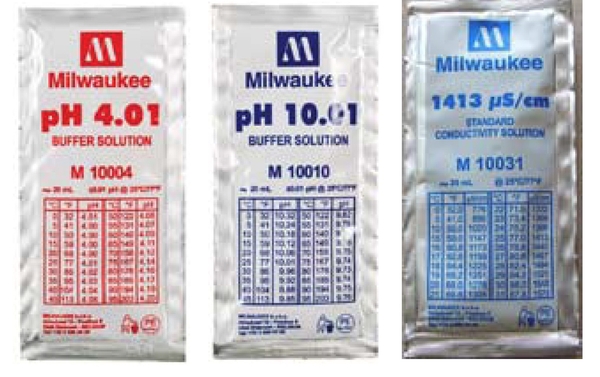
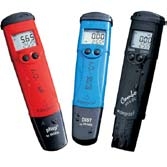
A variety of equipment can be used to monitor pH and EC separately (with two instruments) or together (with one instrument). Pens or meters are the standard instruments used to measure EC and pH, and both can be purchased from many horticulture or nursery supply retailers (see Cavins et al., 2000). Both variables, EC and pH, have separate calibration solutions—called standards for EC and buffers for pH—that are necessary to calibrate the instruments prior to sampling leachates. Both solutions come in convenient sachets containing enough solution for single calibrations.
Be sure to calibrate pH and EC on the instruments before each use (and occasionally between samples), especially if you will base critical decisions on the results or if the readings seem questionable. Small differences in pH or EC can indicate large changes in nutrient availability in substrates. For pH, calibration solutions come in buffers of either pH 4 or pH 7. Purchase both buffers because irrigation water can have a pH near 7, while the leachate can have a pH near 4. Most meters are manufactured to automatically make adjustments for temperature of the buffer solutions during calibration. Be sure to read the information that comes with the equipment to determine if any adjustments for environmental conditions are necessary during calibration. The calibration procedure is simple, takes only a few minutes, and ultimately will save time because it ensures precise measurements. Make sure batteries are fresh, and replace them when needed.
Instruments with glass electrodes are usually required for dependable pH readings, and glass electrodes lose sensitivity with age. When a pH pen or meter can no longer be adjusted to standard test solutions, replace it. Glass electrodes last two years if stored in pH buffer (4 or 7) rather than left dry. They are good investments if used and stored properly.
Make conductivity and pH equipment readily available to employees or store it in their work area so they can integrate checking EC and pH into the routine nursery scouting program. Train employees to use and calibrate the equipment using clean, fresh standards. If equipment is kept in a truck cab, an insulated drink cooler makes an efficient storage box that will moderate extreme temperatures and reduce exposure to evaporative conditions.
Interpretation of Results
Comparing readings from various meters or pens can seem difficult if the underlying relationship between the values is not understood. The mho used to be the accepted unit of electrical conductivity. The International System (SI) now recognizes the Siemens (S). Fortunately, both mho and Siemens represent the same amount of electrical conductivity (1 mho = 1 Siemens). For example, most new conductivity meters read in milliSiemens × 10-3/cm (abbreviated as mS/cm) or in deciSiemens × 10-3/m (dS/m).
Older texts published before acceptance of the Siemens may present results in millimhos (mmhos × 10-3/cm). One millimho is equivalent to mS × 10–3/cm and dS ×10-3/m: a mmho is 0.001 mho, the mS is 0.001 Siemens, and a dS/m is 0.001 Siemens (the prefix deci represents 0.1 and a cm is 0.01 m, which, when multiplied, equal 0.001).
Older meters called Solubridges (the Beckman Solubridge), read EC as mhos × 10-5/cm, so a reading of 0.5 mS × 10-3/cm would be equivalent to a reading of 50 mhos × 10-5/ cm. The North Carolina Department of Agriculture and Consumer Services (NCDA&CS) reports EC units in mhos × 10-5/cm (mhos/cm), but is in the process of referring to them as Siemens × 10-5 / cm (S/cm), which is the accepted SI unit designation. Although meters may use other units of measurement, conversions can be made between nearly all instruments used for measuring conductivity (Table 2).
New conductivity pens and meters may read EC in units called microSiemens (µS), µS × 10-6/cm. When converted, 0.5 mS × 10-3/cm = 500 µS x 10-6/cm. This information may seem complicated because it includes scientific notations of numbers; however, it is just a matter of understanding the units reported by the pen or meter, moving decimal places, and interpreting these results correctly in relation to the recommendations provided.
|
mS/cm dS/m mmhos/cmz |
Mhos/cm S/cmy |
μS/cmx |
| 0 | 0 | 0 |
| 0.5 | 50 | 500 |
| 1.0 | 100 | 1,000 |
| 1.5 | 150 | 1,500 |
| 2.0 | 200 | 2,000 |
| 2.5 | 250 | 2,500 |
| 3.0 | 300 | 3,000 |
Z mS/cm=MilliSiemens x 10-3/cm, dS/cm=DeciSiemens x 10-3/m, mmhos/cm=Millimhos x 10-3/cm.
YMhos/cm=Mhos x 10-5 /cm, S/cm=Siemens x 10-5/cm
XμS/cm=MicroSiemens x 10-6/cm.
Pour-through guidelines for most nursery crops suggest leachate EC values should range between 0.5 mS/cm to 2.0 mS/cm during periods of active growth (Table 3). This would be 50 to 200 mhos/cm or 500 to 2000 μS/cm.
Using EC and pH to Monitor and Manage Nutrient Availability
Three primary factors drive plant growth in containers:
- substrate physical and chemical properties;
- the quality of irrigation water; and
- the amount, timing, and availability of nutrients applied to containers.
All three factors can be monitored routinely using pour-through extraction. Decisions that affect plant growth and profit should be based on the EC and pH of substrates, irrigation water, and container leachates—all of which indicate nutrient availability.
Substrates and Amendments
Sampling the pH and EC of potting substrates (such as aged pine bark) and other organic amendments to substrates (including compost, animal manures, and
alfalfa meal) before potting can prevent poor growth and plant loss. If moisture, temperature, and oxygen are not managed correctly in substrate inventories, they can become anaerobic (no oxygen), which usually is accompanied by low pH and high EC. This combination can damage nursery crops. For example, a pH of 4.0 to 4.2 is expected for aged pine bark from loblolly or slash pine. If pine bark has some sand or grit in it, the pH may be higher—such as 4.8 to 5.0. If the pH is below 3.8, however, the pine bark inventory may have recently been decomposing under anaerobic conditions and is not aged sufficiently. In this case, don’t use the inventory until the pine bark is aged properly and pH increases.
Anaerobic bark supplies may also have very high EC readings—for example, 1.5 mS/cm to 2.5 mS/cm have been recorded. Irrigate substrates with these pH and EC characteristics to leach out organic acids and salts from the inventory, and also turn the inventory. Delaying use of the inventory may be required for several days or a week until an acceptable range of pH 4.0 to 4.2 is reached and EC readings below 0.5 mS/cm are measured. In some cases, where pH and EC readings are only marginally out of this desired range, growers can blend the affected inventory with other “good” inventories in a volume of 50:50 to reduce risk of damaging nursery crops.
Other organic amendments added to substrates should have a pH near 7.0 if composted properly. If the pH is lower, the composting process may be incomplete. The amendment may be used, however, if mixed with other organic materials that have composted completely. Composts with a very high EC can be blended safely only at volumes of 5 to 10 percent to avoid plant damage. High EC levels may indicate an overabundance of readily available nutrients that can burn new plants when potted.
Irrigation Water
An effective nutrient management plan for a nursery must include analysis and recognition of nutrients contributed by the irrigation water. Surface and groundwater can contain levels of minerals and nutrients that affect both plant growth and irrigation efficiency. Recaptured or recycled irrigation water frequently contains significant amounts of dissolved nutrients. Many irrigation sources already contain enough calcium (15 – 25 ppm) for plant growth without adding supplements, such as dolomitic limestone, to the container substrate. If irrigation water has an unusually high pH or high alkalinity, however, it can neutralize the nutrients available in the container substrate, thus weakening plant growth. Moreover, iron, boron, sodium, and chloride are occasionally high enough to make water supplies unsuitable for growing nursery container crops (Table 3). Avoid major nutritional disorders in crops by sending water samples to laboratories that analyze nutrient levels. Irrigation water should be analyzed at least once or twice a year (every spring or every spring and summer). Corrective action may be required if iron or sodium is too high (Bailey et al., 1996).
Table 3. Suggested limits and ranges for chemical capacity factors and individual nutrients for irrigation water, midseason substrate leachates, and plant tissues of woody ornamental nursery container crops
| Capacity Factor | Irrigation Water |
Leachates (BMP's & VTEM PTY) |
Plant Tissuez (General Guidelines) |
| pH | 5.4-7.0 | 5.2-6.3 | - |
| Conductivity (mS/cm) | 0.2-2.0 | 0.5-2.0 | - |
| Total Dissolved Salts | <1000 ppm | <1400 ppm | - |
| Bicarbonate | <122 ppm or <2 meq/L | - | - |
|
Alkalinity (carbonate + bicarbonate) [1 meq/L = 50 ppm CaCO3 |
<100 ppm CaCO3 or <2 meq/L |
- | - |
| Total Conductivity | <2 meq/L | - | - |
| Hardness (Ca+Mg) | <150 ppm CaCO3 or <3 meq/L | - | - |
| Sodium Absorption Ratio (SAR) | <10 meq/L | - | - |
| Individual Elements | |||
| Nitrogen (N) | --- | 100-150 ppm | 2-3.5% |
| Nitrate-N (NO3-N) | 10 ppm | 50 ppm | - |
| Ammonium-N (NH4 -N) | 2-10 ppm | 50 ppm | - |
| Phosphorus (P) | <1 ppm | 3-15 ppm | 0.2-0.5% |
| Potassium (K) | <10 ppm | <100 ppm | 1.1-2% |
| Calcium (Ca) | <60 ppm | 40-200 ppm | 1-2% |
| Magnesium (Mg) | <6-24 ppm | 10-50 ppm | 0.3-0.8% |
| Sulfur (S) | <24 ppm | 75-125 ppm | 0.2-0.7% |
| Iron (Fe) | 0.2-0.4 ppm | 0.3-3 ppm | 35-250 ppm |
| Manganese (Mn) | <0.5-2 ppm | 0.02-3 ppm | 50-200 ppm |
| Zinc (Zn) | <0.3 ppm | 0.3-3 ppm | 20-200 ppm |
| Copper (Cu) | <0.2 ppm | 0.01-0.5 ppm | 6-25 ppm |
| Boron (B) | <0.5 ppm | 0.5-3 ppm | 6-75 ppm |
| Molybdenum (Mo) | <0.1 ppm | 0-1 ppm | 0.1-2 ppm |
| Aluminum (Al) | 0.05-0.5 ppm | 0-3 ppm | <300 ppm |
| Fluoride (FI) | <1 ppm | - | - |
| Sodium (Na) | <3 meq/L or <50 ppm | <50 ppm | 0.01-0.1 % |
| Chloride (CI) | <70 ppm | <70 ppm | 50-200 ppm |
ZValues for foliar nutrient levels are most applicable for woody broadleaf evergreen nursery crops.
YBMP stands for “best management practice” and VTEM PT stands for “Virginia Tech Extraction Method Pour Through.”
Container Leachates
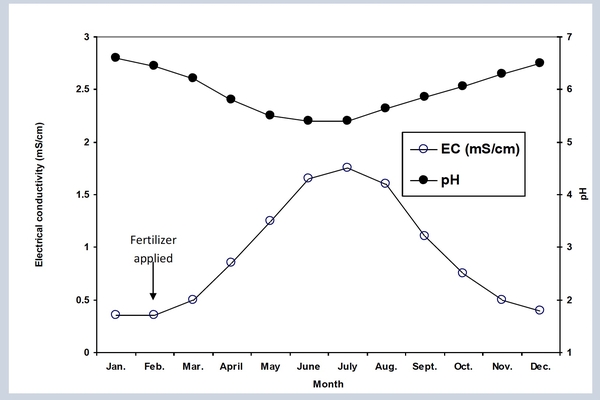
Routinely monitor and record the EC and pH of container leachates to troubleshoot nutritional status and guide irrigation practices over the growing season. For example, fertilizer is added to containers every February/March and June/July depending on the controlled-release fertilizer used. Often this is a routine practice, done without question. If the growing season is abnormally wet, however, nutrients may release prematurely and plants may lose vigor as a result. Monitoring EC would identify the low nutrient levels and signal that more fertilizer is needed to maintain strong growth.
In contrast, if the season is abnormally dry, fertilizers may not release effectively. In that case, more irrigation would be needed in addition to waiting an extended period before fertilizer is re-applied in summer. Some growers may be able to monitor EC/pH so precisely in the nursery that they can reduce nutrient and irrigation levels while still maintaining quality plant growth. This allows growers to stretch their irrigation and fertilizer budgets. It may require a little more work, but improves the management of water and nutrients and gives growers a skillful management tool to use when water supplies dwindle or nutrient prices increase.
Send leachate samples to a laboratory for nutrient analysis at least once during the growing season to compare actual nutrient levels in the container leachate with EC and pH data. If EC/pH levels are out of the desired range, take corrective action immediately. During hot and dry periods, EC can increase in irrigation water, though it may be mostly concentrations of chlorides and sulfates and not essential nutrients. Subtracting the EC of irrigation water from the container leachate would identify this problem, and sending a sample of both to a lab would also verify these findings.
Sampling growing areas correctly provides the strongest evidence of what the EC and pH are in the entire block. Choose three to five plants in an X pattern over a block of plants. If an entire irrigation zone is being sam- pled, use the same X pattern, but sample more plants, for example seven to ten. Use the same containers each time samples are collected by marking them with a flag.
Sampling containers diagonally across a growing block can also help diagnose poor uniformity in irrigation patterns, such as that caused by a plugged nozzle. Lack of uniformity will be evident from EC differences among containers when some plants receive more irrigation than others.
By using the average EC and pH values from three to five plants in an irrigation zone, growers can graph these data for the entire nursery. The graph will tell when the fertilizer is completely released, if irrigation volume is too low or too high, or if irrigation is not uniform because large differences will be noted among test containers. Some nurseries monitor irrigation blocks weekly and use the EC readings as part of their strategic planning for irrigation the following week. If
EC concentrations from representative containers in an irrigation zone are high, for example 1.8 mS/cm to 2.0 mS/cm at the end of a week, irrigation time (volume) would be increased the next week to increase leaching. If the EC readings were low, for example 0.2 mS/cm to 0.3 mS/cm, irrigation volume would be reduced in that zone the next week to decrease leaching of nutrients. Checking EC weekly will help to monitor if the effort was effective. For nurseries that use cyclic irrigation, watering time may be increased for the last irrigation cycle, which increases leaching and decreases the EC. Conversely, the last cycle’s irrigation time can be decreased to prevent excessive nutrient leaching, which will be indicated by higher EC readings afterwards.
When plant foliage becomes chlorotic or off-color, analyzing container leachate and leaf tissues simultaneously can help diagnose the nutritional disorders. A leaf tissue sample should include 20 to 100 leaves that have fully expanded recently (the number collected depends on the leaf size). Results generally provide insight into nutritional imbalances in the plant or substrate.
A pH meter is also useful to monitor pH in containers during the growing season. Leachate pH levels will change as nutrients, particularly Ca and Mg (dolomitic limestone) are used and leached from containers. Container plants often run out of Ca and Mg as well as minor nutrients a year after potting. This lack of Ca, Mg, and minor nutrients may cause a noticeable drop in pH. Alternatively, if the irrigation water has a high pH because of alkalinity or substantial amounts of Ca, then a rise in pH can occur. Loss of other nutrients over the year means a loss of buffering capacity, so pH is less stable. As a result, media may then reflect the pH of the irrigation water, which is often around pH 7.0.
Summary
Measuring EC and pH in container substrate leachates provides an effective way to understand the combined effects of nutrients, water quality, and irrigation efficiency on plant growth in the nursery. With very little experience and training, most employees can learn to calibrate, operate, and care for the instruments while producing data to guide irrigation and nutrient decisions. Many problems with plant health and poor growth can be linked to poor nutrient and irrigation management. The primary benefit of measuring EC and pH is knowing that they are in the correct ranges for vigorous plant growth and that current management decisions support optimum growth.
How to Conduct a Pour-through on Container Nursery Crops
Tools and Supplies
- Electrical conductivity (EC) meter
- pH pen or meter (or a measurement tool that monitors both variables)
- Calibration standards for EC
- Calibration buffers pH 4 and pH 7
- Tray or saucer to collect leachate from containers
- Small vial or tall, narrow jar that can hold 50 ml (1.7 oz.) of leachate and cover the measurement probe (such as an old medicine bottle)
- Large container for pouring water through container plant
- Liquid measuring device (such as a Pyrex measuring cup, soda bottle with known liquid amount, graduated cylinder or beaker)
- Notebook and pencil
- Coffee filter or paper towels to filter leachate before measuring (optional)
- Flags
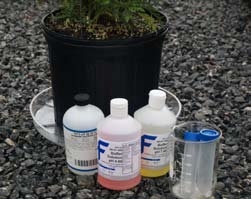
Assemble materials before beginning (Figure 1).
Procedure
-
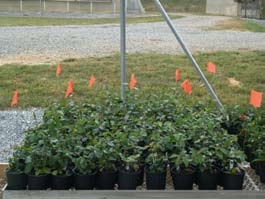
Sample blocks of plants by collecting leachate in a diagonal or “X” pattern depending on the size of the block. Larger blocks will require more plants sampled. To produce a trend over time, sample the same containers (or near them) at each collection date. Denote sample plants with flags (Figure 2). Alternatively, choose a few plants randomly for spot checks.
-
Irrigate nursery containers to container capacity (expect 10 to 20 percent leaching). Wait until after an event is completed rather than hand watering. This provides a sample based on the actual amount of irrigation received by plants.
- Wait 30 minutes to 2 hours for equilibration of nutrients in the container solution.
-
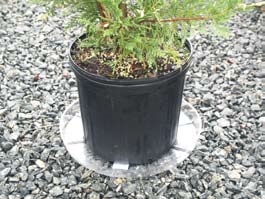
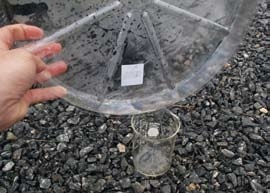
Before pouring water through containers, place containers to be tested in a shallow saucer to collect leachate. Try to elevate the container above the saucer (½-inch) for best results (Figure 3). Saucers used for house plants contain ridges to keep plants elevated slightly.
-
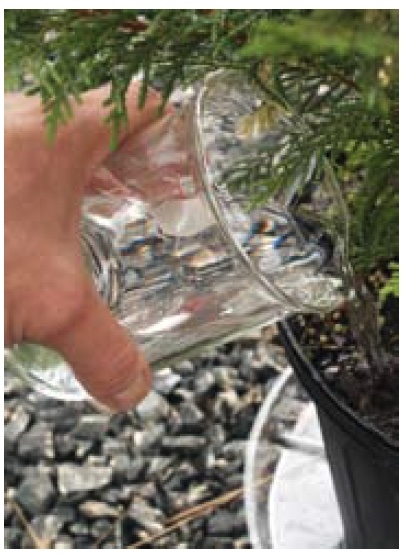
Gently pour 120 milliliters (4 oz) of water over the surface of a 4-liter (1 gallon) container or grow bag (Figure 4). Pour 350 milliliters (12 oz) over the surface of a 12-liter (3 gallon) container or bag (Figure 5). For larger container sizes, see Table 1.
-
An alternative for nursery containers is to lift and tip containers to drain leachate into a collection vessel (Figure 6). This can be done 30 minutes after irrigation has been completed.
-
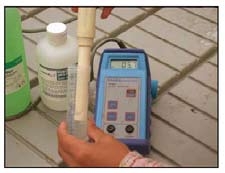
Pour 50 ml (1.7 oz) of leachate into a small container that can accommodate the size of the probe and allow the leachate to cover the probe’s sensors (Figure 7). If necessary, use a coffee filter or paper towel to remove sediment, bark, and debris from the leachate before testing.
-
Calibrate the pH and EC test equipment using manufacturer’s descriptions and appropriate buffers and standard solutions. Sachets (Figure 8) are one-use packets, which make calibrations easy in the field.
-
Read and record results from your equipment in a notebook. Equipment examples: EC/pHmeter and pens (Figure 9a and Figure 9b).
-
Develop a log book for crops, irrigation zones, and data gathered each season. Building a record of EC/pH for a specific nursery can provide a great tool for determining crop production cycles, diagnosing plant problems, and deciding on nutrient and irrigation use guidelines for the year (Figure 10).
References
Bailey, D., T. E. Bilderback, and D. Bir. 1996. Water considerations for container production of plants (Hort. Information Leaflet No. 557). Raleigh: N.C. Cooperative Extension, N.C. State University. Online: http://www.ces.ncsu.edu/depts/hort/hil/pdf/hil-557. pdf
Cavins, T. J., J. L. Gibson, B. E. Whipker, and
W. C. Fonteno. 2000. pH and EC meters – Tools for Substrate Analysis (Florex. 001). Raleigh: N.C. State University. Online: http://www.ces.ncsu.edu/depts/ hort/floriculture/Florex/PH%20EC%20Meter%20 Comparison.pdf
LeBude, A.V. and T. E. Bilderback. 2007. Managing drought on nursery crops (DRO-18). Raleigh: N.C. Cooperative Extension, N.C. State University. Online: http://www.ces.ncsu.edu/drought/nursery_crops.pdf
Wright, R.D. 1986. The pour-through nutrient extraction procedure. HortScience 21:227-229.
Yeager, T., T. Bilderback, D. Fare, C. Gilliam, J. Lea-Cox, A. Niemiera, J. Ruter, K. Tilt, S. Warren, T. Whitwell, and R.D. Wright. 2007. Best Management Practices: Guide for Producing Nursery Crops (2nd ed.). Marietta, Ga.: Southern Nursery Association. www.sna.org
Publication date: Jan. 1, 2009
AG-717
The use of brand names in this publication does not imply endorsement by NC State University or N.C. A&T State University of the products or services named nor discrimination against similar products or services not mentioned.
N.C. Cooperative Extension prohibits discrimination and harassment regardless of age, color, disability, family and marital status, gender identity, national origin, political beliefs, race, religion, sex (including pregnancy), sexual orientation and veteran status.

