Farmers who produce floral hemp (Cannabis sativa L.) walk a thin line between increasing the cannabidiol (CBD) content to the maximum and remaining below the U.S. Department of Agriculture (USDA) 0.3% total tetrahydrocannabinol (THC) compliance threshold. There is a wealth of information, which is often misleading, on the relationship between CBD and THC. This publication clarifies the relationship of CBD and THC production in floral hemp based on current scientific research.
Hemp Biochemistry
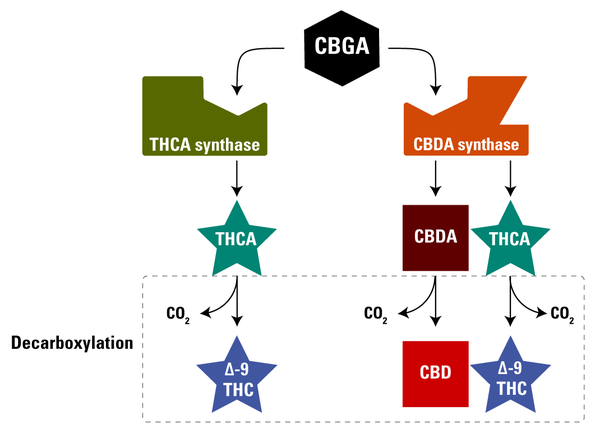
Although more than 90 different cannabinoids have been identified in hemp (Andre, Hausman, and Guerriero 2016, 19), current market demand has focused on THC, CBD, and, to a lesser extent, cannabigerol (CBG). Both tetrahydrocannabinolic acid (THCA) and cannabidiolic acid (CBDA), which are the acid forms of THC and CBD pre-decarboxylation, are synthesized from CBGA, the acid form of CBG, through the activity of two enzymes: THCA synthase and CBDA synthase (Figure 1). Decarboxylation, a process that usually involves heat, converts THCA and CBDA to their biologically active forms (∆-9 THC and CBD). These biologically active forms can be found in plants, although their concentrations are very small compared to the acid forms (Andre et al. 2016).
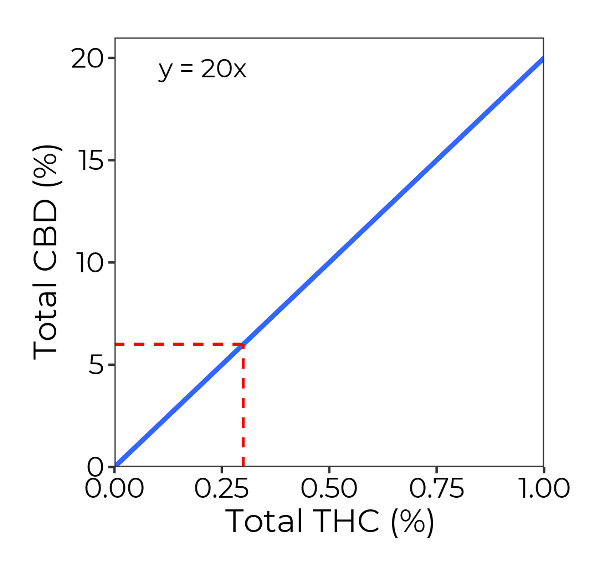
In 2018, researchers demonstrated that CBDA synthase is a promiscuous enzyme that produces multiple compounds (CBDA and THCA) from a single precursor, CBGA (Zirpel, Kayser, and Stehle 2018). This means that even in the absence of THCA synthase, a gene that is often lacking in many commercially available CBD cultivars, CBD hemp will always produce THC. The researchers further demonstrated that CBDA synthase produces a roughly 20:1 ratio of CBDA to THCA. Thus, a single molecule of THCA is synthesized for every 20 molecules of CBDA produced by CBDA synthase. This is a linear relationship that can be expressed as \(y\ =\ 20x\), where y is CBDA molecules and x is THCA molecules (Figure 2). We can calculate the expected amount of CBDA at the USDA THC compliance threshold of 0.3% by multiplying 0.3% × 20. This results in 6.0% total CBD. In other words, a CBD cultivar that exceeds 6.0% total CBD will also be likely to exceed the 0.3% total THC threshold.
When Zirpel et al. (2018) conducted these trials on pure CBDA synthase in vitro (in a glass tube inside a laboratory), the 20:1 CBD to THC ratio was not exact. In nature, there is variability. The CBD:THC ratio is known to be always close to 20:1, but can vary slightly due to genetics and the time of sampling (Stack et al. 2021).
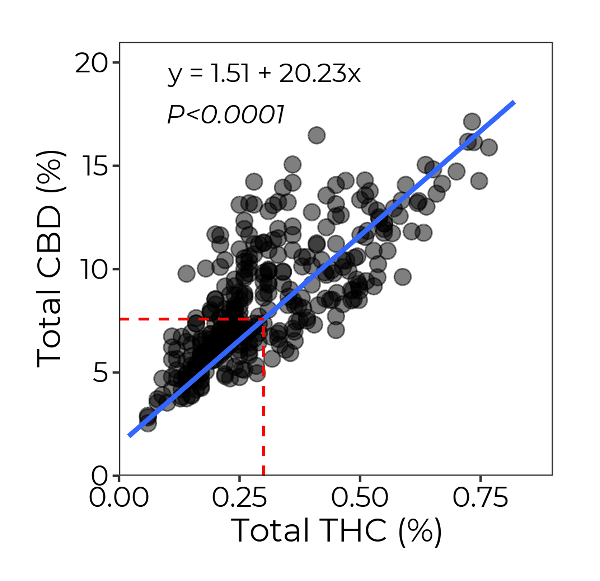
To demonstrate this, we compiled total THC and total CBD values from North Carolina State University outdoor floral hemp cultivar trials conducted in 2020 and 2021. This data set represents three locations per year (six site years), three blocks per location, and 17 varieties (n=408 data points). There was a strong linear relationship between total THC and total CBD (P <0.0001), which can be expressed as \(y\ =\ 1.51\ +\ 20.23x\) (Figure 3). With this equation, we calculated the predicted total CBD concentration to be slightly higher than reported by Zirpel et al. in 2018. On average, the cultivars contained 7.58% CBD after they reached the 0.3% USDA THC compliance threshold. Results from this analysis highlight the variability encountered in biological systems.
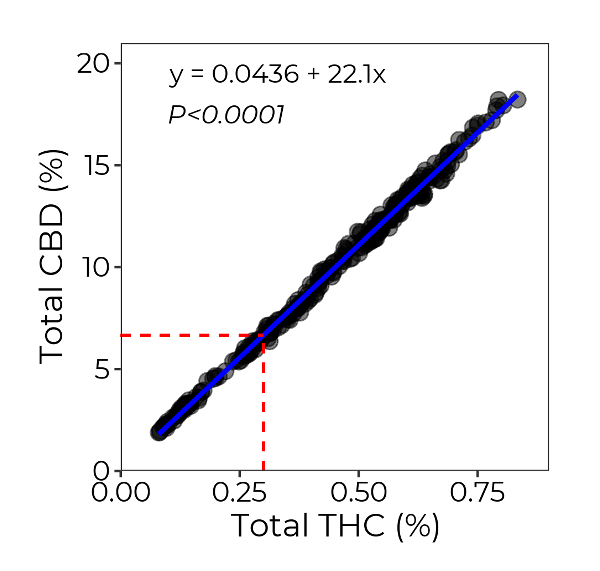
To demonstrate the stable genetic effect on the CBD:THC ratio, we analyzed data from 2019 field trials by using a single, clonally propagated CBD floral hemp cultivar, BaOx (n=303 data points). We found a strong linear relationship between the total CBD and total THC (P < 0.0001), which can be expressed as \(y\ =\ 0.0436\ +\ 22.1x\) (Figure 4). With this equation, we calculated the predicted total CBD concentration to be 6.67% at the 0.3% USDA THC compliance threshold. There was a much tighter relationship when we analyzed a single cultivar (Figure 4) compared to multiple cultivars and the years shown in Figure 3.
A crop has the ability to produce close to 20% total CBD, although this comes at the cost of a noncompliant level of total THC. Thus, when choosing a CBD hemp cultivar, farmers should scrutinize the descriptions provided by seed companies, especially those that suggest that their CBD cultivars produce little to no THC. Studies have shown, however, that some CBG cultivars may not exceed the threshold, even at final harvest. (See NC State floral hemp variety trial results.)
This information can sometimes be misleading by listing the maximum total CBD production without the associated total THC levels. In other cases, seed companies may provide a total CBD to ∆-9 THC ratio, which inflates the number. Under the final USDA rules, compliance is based on total THC, which is calculated as ∆-9 THC + 0.877×THCA. When in doubt, we recommend referring to the NC State floral hemp cultivar trial results, which provide an unbiased screening of floral hemp cultivar performance across our state since 2018.
Key Takeaways
Given the unique nature of CBDA synthase, producing a CBD hemp crop with currently available genetics that contains 0% THC is impossible. Growers should expect the total CBD content to be roughly 6% to 7% by the time the crop reaches the 0.3% USDA total THC limit. The timing of when the crop reaches the 0.3% total THC threshold appears to be dependent on the cultivar. In their screening of 30 floral hemp cultivars, Stack et al. (2021) found that the time required to reach 0.3% total THC threshold was dependent on the cultivar and ranged from one to four weeks after terminal flower initiation. Seed companies should provide a basic time course of THC accumulation for their cultivars, which would allow growers to determine the best time for compliance sampling and harvest.
Literature
Andre, Christelle M., Jean-Francois Hausman, and Gia Guerriero. 2016. “Cannabis sativa: The Plant of the Thousand and One Molecules.” Frontiers in Plant Science 7: 19.
Stack, George M., Jacob A. Toth, Craig H. Carlson, Ali R. Cala, Mariana I. Marrero‐González , Rebecca L. Wilk, Deanna R. Gentner, Jamie L. Crawford, Glenn Phillippe, Jocelyn K.C. Rose, Donald R. Viands, Christine D. Smart, and Lawrence B. Smart. 2021. “Season‐Long Characterization of High‐Cannabinoid Hemp (Cannabis sativa L.) Reveals Variation in Cannabinoid Accumulation, Flowering Time, and Disease Resistance.” GCB Bioenergy 13, no.4: 546-561.
Zirpel, Bastian, Oliver Kayser, and Felix Stehle. 2018. “Elucidation of Structure-Function Relationship of THCA and CBDA Synthase from Cannabis sativa L.” Journal of Biotechnology 284: 17–26.
Publication date: April 29, 2022
AG-926
N.C. Cooperative Extension prohibits discrimination and harassment regardless of age, color, disability, family and marital status, gender identity, national origin, political beliefs, race, religion, sex (including pregnancy), sexual orientation and veteran status.


