
Introduction
As wood dries below about 30% moisture content it begins to shrink. The exhibited cross grain shrinkage is anisotropic in nature, meaning that the radial shrinkage (from pith to bark of the tree like spokes of a wheel) and the tangential shrinkage (tangent to the annual rings) are not equal. The unequal nature of cross grain shrinkage causes distortion as the wood dries resulting in cupped lumber. Cup is defined as a distortion of a board in which there is deviation from flatness across the width of the board.
The USDA Forest Service Wood Handbook publishes the average total percent radial and tangential shrinkage from 30% to 0% moisture content for domestic (and some foreign) woods. The Wood Handbook presents an equation used to calculate an estimate of the expected dimensional changes as wood moisture decreases or increases based on the total radial and tangential shrinkage.
∆D = (Di (MCi – MCf)) ÷ ((FSP/S) – FSP + MCi)
where:
∆D = change in dimension
D = initial dimension
S = total fractional shrinkage from FSP to 0%
MCi = initial moisture content (below FSP)
MCf = final moisture content (below FSP)
FSP = fiber saturation point (average value of 30% MC)
This calculation assumes that the radial and tangential shrinkages occur parallel to the width and thickness of the lumber. As a result, this calculation has a built-in error in estimating the change in dimension as it ignores the curvilinear nature of the growth rings. This was not a bad assumption when our trees were very large, but today's logs are much smaller, and the arc of the growth rings and hence the angles imparted by shrinkage are much more significant. If the board is not held flat, the natural tendency of shrinkage that is not parallel to the board surfaces will be cup. This equation does not predict the amount of cup.
An Excel spreadsheet was developed that will allow the user to predict cup and shrinkage by considering the tangential and radial shrinkage components that generally exist in across the grain dimensions in today’s lumber. The spreadsheet model was designed to be easy-to-use and will estimate the maximum amount of cup possible if the lumber were not restrained during the change in moisture content. The approach used does not include visco-elastic and mechano-sorptive effects that could reduce the amount of cup, hence the results can be considered as a worst case scenario (as if the wood were dried without external restraint).
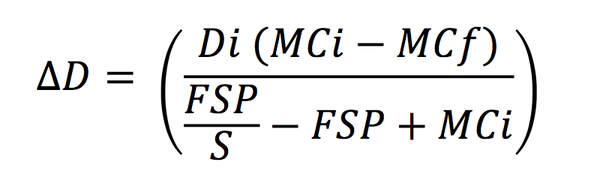
Formula used to calculate an estimate of the expected dimensional changes as wood moisture decreases or increases based on the total radial and tangential shrinkage.
Instructions
This spreadsheet uses polar geometry to calculate the distortion caused by radial and tangential shrinkage. Using a polar coordinate system to model radial and tangential shrinkage accounts for the curvilinear nature of the radial shrinkage imparted by the growth rings and hence approximates the actual shrinkage of the material. In addition, using this method allows the modeling of cup (or crown).
Input
The user needs to input only 8 pieces of information:
- Initial Board Width (x-axis dimension, or left to right on screen)
- Initial Board Thickness (y-axis dimension, or up and down on screen)
- X Cartesian coordinates of the board center
- Y Cartesian coordinates of the board center
- Initial Moisture Content (%)
- Final Moisture Content (%)
- Species of wood (indicate in drop down list)
- Diameter of the log
This information is required on the tab named "Input Output.". The text of those spreadsheet cells that require information is red to help the user focus on the input data needed. For board dimensions, location, and diameter of log, the user can use any units consistently throughout (that is, input can be all in inches or all in centimeters, etc.).
Output
The spreadsheet program outputs thirteen pieces of information and also generates two graphical representations of the cupped (or crowned) board. The numerical results are shown in blue font. A brief description of the output information follows:
- Total Radial Shrinkage for Species (%) – the percent total radial shrinkage for the designated species from FSP to 0 percent moisture content as reported in the Wood Handbook.
- Total Tangential Shrinkage for Species (%) – the percent total tangential shrinkage for the designated species from FSP to 0 percent moisture content as reported in the Wood Handbook.
- Final Board Average Width – for the board at final moisture content, the average distance between 5 pairs of points that were originally located opposite each other on the edges of the board.
- Final Board Average Thickness – for the board at final moisture content, the average distance between 11 pairs of points that were originally located opposite each other on the faces of the board.
- Average Width Dimension Change – the mathematical difference between the Initial Board Width and the Final Board Average Width.
- Average Thickness Dimension Change – the mathematical difference between the Initial Board Thickness and the Final Board Average Thickness.
- Actual Board Width % Dimension Change – the actual percent change in board width from the width at initial MC to the width at final MC.
- Actual Board Thickness % Dimension Change – the actual percent change in board thickness from the thickness at initial MC to the thickness at final MC.
- % Actual Width Shrinkage Value Exhibited – comparable to the Total Radial Shrinkage (#1 above) for flatsawn lumber, this is calculated total width shrinkage expected from FSP to 0 percent moisture content.
- % Actual Thickness Shrinkage Value Exhibited – comparable to the Total Tangential Shrinkage (#2 above) for flatsawn lumber, this is calculated total thickness shrinkage expected from FSP to 0 percent moisture content.
- Magnitude of Flatness – a qualitative assessment of how much cup is present. If the amount of cup is less than 1/32 inch, the response is “Board is Flat”. If the calculated cup is 1/32 inch or greater, the response is either “Board is Cupped” or the “Board is Crowned”, the former resulting when the top face corners are higher than the center and the latter result if the top face center is higher than the corners.
- Valley to Peak Distance – this is the distance between the highest and lowest points on the top face of the board, and is the value upon which #11 is determined.
- Planed Board Thickness – this is the minimum distance between the top and bottom face of the board and as such represents the maximum planed thickness at the final moisture content.
An Example
Table 1 presents an example of the previously mentioned input variables and summarizes the model results and illustrates the output for a flatsawn southern red oak board that was originally 1” x 10” when sawn green. The x- and y-coordinates of 0 and 12 locate the center of the green board 12 units (y = 12) directly above the pith (x = 0), hence it is a flatsawn board. The initial moisture content is 30% and the final moisture content has been set at 7%. The species selected is Southern Red Oak (Oak, S. Red), and has been sawn from a log having a diameter of 30.
The first two lines of output variables shown in Table 1 are the published percent total tangential (11.3) and radial shrinkage (4.7) from the green to the oven dry condition for the selected species. The next two rows of output give the average final board width (9.16) and thickness (0.96) after shrinkage has occurred in the same units as provided for the original board. This is followed by the average dimension change in width (-0.84) and thickness (-0.04). The output includes the actual board percent dimensional change for both width (-8.42) and thickness (-3.91) for the moisture change from 30 to 7%. This pair reflects the actual percent shrinkage based on the initial and final moisture content the user entered. The program also calculates the total average percent shrinkage exhibited, for both the board width (10.98) and thickness (5.10). These two values represent the total shrinkage if dried to the ovendry condition. This output pair can be compared to the published values for the total radial and tangential shrinkage for the modeled species, and differ due to the curvature of the growth rings and natural variability. Thus they are in near agreement with either flatsawn or quartersawn boards (annual rings are approximately perpendicular to the wide face of the board) that are distant from the pith, as shown for the flatsawn board (Table 1) whose exhibited total average percent width shrinkage was 10.98 and exhibited total average percent thickness shrinkage was 5.10.
In addition, the output provides a qualitative assessment of cup. In this example, the program tells us the “Board is Cupped,” having 1/32-inch or more of cup (0.03125 inch). The valley to peak distance, in this case 0.094 inches, is the distance between the highest and lowest points on the top face of the
board, and is the value upon which the qualitative assessment of cup is determined. The maximum planed board thickness, 0.863-inches in this example, is an estimate of the board thickness at final moisture content if all cup is removed in the planer, and is the minimum distance between the top and bottom of the board.
| Input Variables | Flatsawn Board |
|---|---|
| Initial Board Width | 10 |
| Initial Board Thickness | 1 |
| X and Y Coordinates of Board Center | 0, 12 |
| Initial Moisture Content (%) | 30 |
| Final Moisture Content (%) | 7 |
| Species of Wood | Oak, S. Red |
| Diameter of Log | 30 |
| Output Variables | |
| % of Total Tangential Shrinkage for Species | 11.3 |
| % Total Radial Shrinkage for Species | 4.7 |
| Final Board Avg. Width | 9.16 |
| Final Board Avg. Thickness | 0.96 |
| Average Width Dimension Change | -0.84 |
| Average Thickness Dimension Change | -0.04 |
| Actual Board Width % Dimension Change | -8.42 |
| Actual Board Thickness % Dimension Change | -3.91 |
| % Average Width Shrinkage Value Exhibited | 10.98 |
| % Average Thickness Shrinkage Value Exhibited | 5.10 |
| Magnitude of Flatness | Board is Cupped |
| Valley to Peak Distance (inches) | 0.094 |
| Maximum Planed Board Thickness (both sides) | 0.863 |
Limitations
There are several limitations to this shrinkage and cup estimation model which are listed here:
- The published average tangential and radial shrinkage values have been used in this model. Shrinkage actually varies between trees of the same species, within trees, and even within growth rings. Model results are therefore likely to differ from actual samples.
- The model approximates growth rings as being circular. Actual growth rings generally deviate from being perfect circles.
- Juvenile wood or abnormal (compression and tension) wood is not considered in the model. Also, sloping grain or cross grain is not taken into account.
- A uniform moisture content is assumed throughout the wood, both in the initial and final states.
- Modeling of cup assumes that the wood is free of any restraint and that the wood is completely an elastic material. Hence the model does not consider internal restraints generated by drying stresses, nor does it consider external restraints such as top loading weight typically present in stacked lumber. For wood in service the model does not consider restraints provided by glue, nails, or T&G (tongue and groove) installations. The calculated value of cup represents the potential maximum amount of cup if these forces are absent.
- Although the model produces error warnings if the user inputs an initial moisture content greater than 30%, or a negative final moisture content, the program will (erroneously) calculate an answer.
- While effort has been made at user error prevention and to provide error warnings, the author acknowledges that errors in the software are still possible.
- The amount of protection provided with the program is minimal and has been done to prevent the user from making changes that will disable the intended function of the program. Some tabs are hidden, but they can be unhidden.
The Differential Shrinkage and the Cupping of Lumber Spreadsheet
The Excel model can be downloaded at the NC State Wood Products Extension blog.
Modeling the cupping of lumber, an article published in BioResources (11(3), 6416-6425) describes the use of the model.
Literature Cited
Forest Products Laboratory. 2010. Wood handbook—Wood as an engineering material. General Technical Report FPL-GTR-190. Madison, WI: U.S. Department of Agriculture, Forest Service, Forest Products Laboratory. 508 p.
Publication date: July 1, 2016
N.C. Cooperative Extension prohibits discrimination and harassment regardless of age, color, disability, family and marital status, gender identity, national origin, political beliefs, race, religion, sex (including pregnancy), sexual orientation and veteran status.