NIFA Conservation Effects Assessment Project (CEAP)
Watershed Assessment Studies
Lessons Learned from the National Institute of Food and Agriculture (NIFA)-CEAP Synthesis Fact Sheet 5
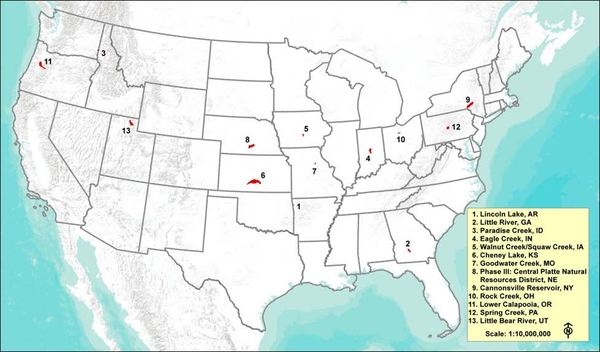
Thirteen agricultural watershed projects were funded jointly by the USDA National Institute of Food and Agriculture (NIFA) and Natural Resources Conservation Service (NRCS) to evaluate the effects of cropland and pastureland conservation practices on spatial and temporal trends in water quality at the watershed scale. In some projects, participants also investigated how social and economic factors influence implementation and maintenance of practices. The 13 projects were conducted from 2004 to 2011 as part of the overall Conservation Effects Assessment Project (CEAP). The NIFA-CEAP projects were mainly retrospective; most conservation practices and water quality monitoring efforts were implemented through programs that occurred before the NIFA-CEAP projects began. By synthesizing the results of all these NIFA-CEAP projects, we explore lessons learned about the selection, timing, and location of conservation practices and relationships among them relative to any effects on water quality.
Using Previously Collected Data
The NIFA-CEAP projects relied mainly on past water quality monitoring data, often collected by several agencies under different programs and designs, to serve project needs. Such data often came from routine state surveillance monitoring, federal agency monitoring programs, research plot- and field-scale studies, or watershed group sampling efforts. In a few projects, participants were able to continue or supplement contemporary monitoring. Several NIFA-CEAP projects benefited from past intensive monitoring efforts associated with conservation practice implementation. The Rock Creek (OH) project was supported by a 30-year monitoring record that measured long-term pollutant loads to Lake Erie during extensive implementation of reduced tillage in the watershed. Both the Walnut Creek (IA) and Cannonsville Reservoir (NY) projects benefited from pairedwatershed studies funded by the U.S. Environmental Protection Agency that documented the effectiveness of specific conservation practices. The NIFA-CEAP projects used water quality monitoring to help identify pollutant sources and understand critical watershed processes and to guide ongoing project activities such as selection of locations for conservation practices. Water quality monitoring data were essential to watershed model calibration and validation in many NIFA-CEAP projects. In a few projects, investigators were able to use past or contemporary monitoring data to document a water quality response to a conservation practice implementation.
Few of the NIFA-CEAP projects were able to document the effects of implemented conservation practices on water quality through monitoring. The monitoring data generally could not be used to address the issues of relationships among conservation practices in a watershed or questions about the optimal set of practices and their optimal placement in a watershed. This occurred mainly because the monitoring programs were not specifically designed to evaluate response to treatment, but were designed to serve other goals.
Lesson: Water quality monitoring must be designed to meet project objectives.
Detecting a Water Quality Response to Treatment through Monitoring
Monitoring in a Midwestern watershed focused on atrazine, while most historical conservation practices had addressed sediment. In one basin, streams were monitored for sediment and nutrients, whereas a major river in the basin is impaired for temperature and E. coli. In several watershed projects, most conservation practices focused on erosion control and sediment delivery, although nutrients were the primary water quality constituents being monitored.
In the Rock Creek (OH), Little Bear River (UT), and several other NIFA-CEAP projects, collection of flow data concurrent with water quality data was essential— not only to calculate loads but also to evaluate changes in pollutant loadings due to climatic and seasonal variation.
Lesson: Flow, groundwater depth, or similar water discharge measurements, as well as other hydrologic covariates, should be made concurrent with measurements of water quality.
Lesson: The water quality variables selected for monitoring should match the water quality problem, the pollutants of concern and their sources, and the conservation practices being implemented.
When implementation of conservation practices may be incomplete and evaluation is time limited, water quality response may be less dramatic than anticipated. In one project where only minimal riparian buffers could be created, measurements of the primary stressor (percentage of fines in stream sediments) and basic biological density were better choices for detecting a response to treatment than were complex aquatic community metrics.
Lesson: Form realistic expectations, and select appropriate indicators to measure water quality response to implemented conservation practices.
Water quality response to land treatment—and documentation of the response through monitoring—usually takes time. In the Rock Creek (OH) project, 30 years of water quality monitoring documented a long-term response to widespread implementation of reduced tillage. In another, hydrologic monitoring identified lag times averaging 10 years for the groundwater transport of nitrates from field to stream. A drought in the Spring Creek (PA) project area delayed project completion, and water quality changes were detected that would not have been documented if monitoring had ended as originally scheduled.
Lesson: Monitoring must continue long enough to detect a response to land treatment.
When and where monitoring occurs are critically important. Two projects required intensive storm-event monitoring that coincided with herbicide application schedules to effectively document atrazine runoff concentrations. In the Little Bear River watershed (UT), historical fixed-interval sampling completely missed the storm events that affect sediment and nutrient transport. Spatial distribution of monitoring is also important, especially where conservation practices are not uniformly distributed in the watershed. Water quality improvements within a reasonable time frame may be more apparent in small sub-basins than in large basins. In the High Plains Aquifer (NE) project, monitoring was stratified between terrace and bottomland areas because hydrology, cropping systems, and irrigation intensity differed between the two areas. This distributed monitoring allowed participants to detect decreases in shallow aquifer nitrate-N levels beneath the terrace areas in response to irrigation management and increased crop yields.
Lesson: Monitoring schedules and locations must be adapted to pollutant behavior, hydrologic regime, and the watershed land treatment program.
In two projects (Walnut Creek, IA and Goodwater Creek, MO), participants successfully applied data from plot- and field-scale studies to understanding relationships between pollutant export and hydrologic processes at the watershed level.
Lesson: Plot- and field-scale monitoring may provide information on pollutant export and delivery that is critical to understanding a water quality response at the watershed level.
Although sampling programs in large watersheds may successfully detect broad changes or trends in water quality, it is rarely possible to link such changes to implemented conservation practices without a deliberately designed monitoring program. In general, focused paired-watershed monitoring studies, such as those carried out in some of the NIFA-CEAP watersheds under previous programs, were more successful in linking conservation practices to water quality effects than were broad sampling programs conducted in large watersheds.
Lesson: Consider carefully designed studies in small watersheds to document the effect of conservation practices as part of an overall watershed project.
How to Design and Conduct Water Quality Monitoring in Watershed Projects
One challenge for many of the NIFA-CEAP projects was the use of past water quality data— especially broad-scale surveillance monitoring—for present-day analyses. Objectives of past monitoring are not always consistent with current goals. In one watershed project, what had appeared to be an impressive historical monitoring database was found to be inadequate for current project objectives. Water quality data may be difficult to interpret when changes in agencies, strategies, locations, sampling frequency, variables evaluated, and analytical methods have occurred.
Lesson: Evaluate historical water quality data critically before commencing a project as past data may not be usable for present purposes.
In the Little Bear River (UT) project, water diversion and irrigation management complicated monitoring for nutrient loads. In the Iowa project, documentation of groundwater travel times showed that water from only ~20% of restored prairie areas reached the stream during the monitoring period, suggesting that greater water quality changes could occur in the future.
Lesson: An understanding of the watershed hydrologic system is essential for interpreting monitoring results.
Because much of the sediment in the Walnut Creek (IA) watershed was found to be derived from stream bank erosion, prairie conversion had almost no detectible effect on watershed sediment export during the monitoring period. An initial watershed assessment in the Little Bear River (UT) project showed that the upper portion of the watershed had different land use, soils, and hydrology than the lower portion and as a result should be monitored differently.
Lesson: An understanding of the watershed’s physiography is essential to effective monitoring.
Topographic flow path analysis was used in The Spring Creek (PA) project to reveal where concentrated runoff from source areas would bypass buffer and filter strip treatment zones. This kind of analysis can be used to identify and locate critical source areas and intercepting treatment practices and to interpret in-stream monitoring data. Investigators in the Little Bear River (UT) project used aerial video imagery to compare stream bank and stream channel conditions over time to evaluate the effects of land treatment on riparian condition.
Lesson: Look for creative or alternative indicators of response to treatment.
How Monitoring Relates to Other Project Activities
Water quality and other data are necessary to parameterize, calibrate, and validate simulation models such as SWAT and AnnAGNPS. In the Indiana project, monitoring data collected at several locations within a watershed and for a variety of water quality variables permitted multivariate model calibration, giving results superior to those from calibrating flow and individual constituents separately. Insufficient monitoring data can impair model application. Results of SWAT modeling in one of the projects were limited by the availability of precipitation data from only a single weather station in the modeled watershed.
Lesson: Water quality monitoring data are essential to the development and application of models to specific watersheds.
Most broad watershed-monitoring programs, especially past programs but also many contemporary efforts, lack essential data on companion conservation practices and agricultural management. Such data are necessary to attribute observed changes in water quality to changes in management on the land. Acquiring and using spatially explicit landtreatment data were major challenges and stumbling blocks for the NIFA-CEAP projects, mainly due to USDA confidentiality policies as well as the age of some land treatment programs.
Lesson: No matter how rigorous the water quality monitoring program, it will be impossible to link observed changes in water quality to land treatment without rigorous monitoring of conservation practice implementation and management activities.
Experience from most of the NIFA-CEAP projects showed that central project activities— land treatment, monitoring, modeling, and socioeconomic analysis—must be linked and conducted in a coordinated manner that permits and encourages feedback among those involved in these components. The Cannonsville Reservoir (NY) project was marked by close coordination among government agencies (city and state), farmers’ organizations, and university researchers. Project personnel in another project observed that project activities needed to be synchronized logically so that intermediate results could contribute fully to the final outcome. The Spring Creek (PA) project team found that it was necessary to design and conduct water quality monitoring— including selection of appropriate metrics—with understanding of the land treatment process in mind. In another watershed project, an economic analysis conducted entirely separate from watershed monitoring or conservation activities provided results that were of very limited utility to the project goals.
Lesson: Integrate water quality monitoring, simulation modeling, and conservation practice implementation into coordinated activities that encourage communication and feedback among participants throughout the project.
Related Resources
Barnes, P., and N. Nelson. 2011. Cheney Lake Watershed: Water Quality Monitoring. Kansas State University Agricultural Experiment Station and Cooperative Extension Service, Publication MF3037. Manhattan, KS.
Osmond, D., D. Meals, D. Hoag, and M. Arabi (eds). 2012. How to Build Better Agricultural Conservation Programs to Protect Water Quality: The National Institute of Food and Agriculture Conservation Effects Assessment Project Experience. Ankeny, IA: Soil and Water Conservation Society.
Osmond, D. L., S. W. Coffey, J. A. Gale, and J. Spooner. 1995. Identifying and Documenting a Water Quality Problem: The Rural Clean Water Program Experience. Raleigh: NC State University Water Quality Group.
Spooner, J., D. E. Line, S. W. Coffey, D. L. Osmond, and J. A. Gale. 1995. Linking Water Quality Trends with Land Treatment Trends: The Rural Clean Water Program Experience. Raleigh: NC State University Water Quality Group.
Information
For more information about the NIFA-CEAP Synthesis, contact Deanna Osmond, NC State University.
Lessons Learned from the NIFA-CEAP
Acknowledgments
The authors are grateful for the funding supplied by the USDA National Institute of Food and Agriculture (NIFA) and Natural Resources Conservation Service (NRCS) (Agreement No. 2007- 51130-18575). We want to thank all NIFA-CEAP project personnel for their help with this publication, our site visits, and our information-gathering efforts. In addition, we greatly appreciate all the time spent by key informants during our interviews with them. We also wish to thank the USDA CEAP Steering Committee and USDA NIFA Committee for Shared Leadership for Water Quality for their comments, questions, and advice during this synthesis project, as well as a special thanks to Lisa Duriancik of NRCS.
This material is based upon work supported in part by the National Institute of Food and Agriculture and the Natural Resources Conservation Service, U.S. Department of Agriculture, under Agreement No. 2007-51130-18575. Any opinions, findings, conclusions, or recommendations expressed in this publication are those of the author(s) and do not necessarily reflect the view of the U.S. Department of Agriculture. USDA is an equal opportunity provider and employer.
Prepared by
Donald W. Meals, Ice. Nine Environmental Consulting
Deanna L. Osmond, Jean Spooner, and Daniel E. Line, NC State University
Citation
Meals, D. W., D. L. Osmond, J. Spooner, and D.E. Line. 2012. Lessons Learned from the NIFACEAP: Water Quality Monitoring for the Assessment of Watershed Projects. NC State University, Raleigh, NC.
Publication date: Jan. 1, 2012
Reviewed/Revised: Dec. 18, 2023
N.C. Cooperative Extension prohibits discrimination and harassment regardless of age, color, disability, family and marital status, gender identity, national origin, political beliefs, race, religion, sex (including pregnancy), sexual orientation and veteran status.


