
| County | Acres of Timberland1 | Percent Timberland | Stumpage Value2 | Delivered Value3 | Rank4 |
|---|---|---|---|---|---|
| Alamance | 137,716 | 51% | $2,960,551 | $6,290,248 | 53 |
| Alexander | 102,966 | 62% | $1,895,768 | $3,560,877 | 71 |
| Alleghany | 68,261 | 45% | $1,708,431 | $3,253,616 | 76 |
| Anson | 213,041 | 63% | $14,965,519 | $26,980,032 | 5 |
| Ashe | 181,192 | 66% | $2,839,221 | $5,261,299 | 56 |
| Avery | 131,440 | 83% | $326,329 | $723,520 | 97 |
| Beaufort | 343,352 | 65% | $23,419,527 | $43,195,681 | 1 |
| Bertie | 320,581 | 72% | $10,341,170 | $22,333,731 | 7 |
| Bladen | 394,164 | 70% | $13,918,434 | $28,193,054 | 3 |
| Brunswick | 420,718 | 78% | $14,330,099 | $26,088,235 | 6 |
| Buncombe | 227,452 | 54% | $2,048,598 | $3,738,443 | 68 |
| Burke | 231,669 | 71% | $2,379,635 | $5,071,474 | 58 |
| Cabarrus | 91,191 | 39% | $1,452,780 | $2,764,263 | 79 |
| Caldwell | 237,919 | 79% | $3,801,026 | $6,843,009 | 47 |
| Camden | 73,440 | 48% | $933,059 | $2,123,492 | 88 |
| Carteret | 169,562 | 52% | $2,832,789 | $5,084,663 | 57 |
| Caswell | 187,960 | 69% | $1,769,010 | $4,507,006 | 61 |
| Catawba | 86,666 | 34% | $1,884,513 | $3,674,773 | 69 |
| Chatham | 267,998 | 61% | $8,502,415 | $17,078,318 | 17 |
| Cherokee | 253,044 | 87% | $1,039,573 | $2,669,916 | 81 |
| Chowan | 51,669 | 47% | $1,723,673 | $3,783,853 | 67 |
| Clay | 94,764 | 69% | $480,712 | $1,363,079 | 92 |
| Cleveland | 133,693 | 45% | $3,025,943 | $7,319,454 | 45 |
| Columbus | 375,902 | 63% | $13,349,702 | $27,177,102 | 4 |
| Craven | 264,923 | 58% | $16,801,412 | $32,215,342 | 2 |
| Cumberland | 231,338 | 55% | $5,937,588 | $11,698,006 | 29 |
| Currituck | 40,831 | 24% | $636,341 | $1,541,782 | 91 |
| Dare | 54,975 | 22% | $353,170 | $628,014 | 98 |
| Davidson | 192,611 | 54% | $5,522,127 | $10,013,509 | 35 |
| Davie | 85,102 | 50% | $1,093,206 | $2,130,518 | 87 |
| Duplin | 269,861 | 52% | $6,755,858 | $14,609,437 | 23 |
| Durham | 97,578 | 53% | $1,041,647 | $2,444,755 | 84 |
| Edgecombe | 172,416 | 53% | $4,894,752 | $9,689,225 | 37 |
| Forsyth | 110,914 | 42% | $1,671,560 | $3,445,424 | 74 |
| Franklin | 199,503 | 63% | $7,270,632 | $13,907,845 | 25 |
| Gaston | 104,353 | 46% | $1,190,130 | $2,354,625 | 85 |
| Gates | 119,905 | 55% | $5,992,515 | $11,775,032 | 28 |
| Graham | 147,860 | 79% | $113,257 | $469,233 | 99 |
| Granville | 226,797 | 67% | $5,799,553 | $11,239,631 | 30 |
| Greene | 62,483 | 37% | $2,266,463 | $4,391,307 | 62 |
| Guilford | 177,796 | 43% | $3,764,082 | $6,939,569 | 46 |
| Halifax | 289,335 | 62% | $11,143,282 | $21,777,656 | 9 |
| Harnett | 215,405 | 57% | $5,177,939 | $10,026,148 | 34 |
| Haywood | 208,216 | 59% | $3,443,578 | $6,609,664 | 50 |
| Henderson | 163,553 | 68% | $2,145,511 | $3,800,056 | 66 |
| Hertford | 159,913 | 71% | $7,374,889 | $15,864,591 | 19 |
| Hoke | 172,995 | 69% | $2,313,956 | $4,845,768 | 60 |
| Hyde | 210,923 | 54% | $1,015,097 | $1,962,054 | 90 |
| Iredell | 118,645 | 32% | $4,356,071 | $10,390,631 | 33 |
| Jackson | 259,600 | 83% | $2,086,279 | $3,516,997 | 73 |
| Johnston | 233,989 | 46% | $4,999,418 | $9,499,553 | 39 |
| Jones | 225,014 | 75% | $10,679,912 | $19,375,179 | 12 |
| Lee | 95,507 | 59% | $2,586,587 | $5,010,399 | 59 |
| Lenoir | 136,855 | 53% | $5,284,771 | $9,620,810 | 38 |
| Lincoln | 78,012 | 41% | $1,906,328 | $3,538,278 | 72 |
| Macon | 232,348 | 70% | $1,303,718 | $2,712,934 | 80 |
| Madison | 267,198 | 93% | $1,248,997 | $2,153,807 | 86 |
| Martin | 223,172 | 76% | $7,947,122 | $15,647,197 | 20 |
| McDowell | 219,681 | 78% | $3,298,286 | $6,731,477 | 49 |
| Mecklenburg | 86,689 | 26% | $313,947 | $849,138 | 96 |
| Mitchell | 97,968 | 69% | $2,241,517 | $3,846,279 | 65 |
| Montgomery | 244,349 | 78% | $12,212,128 | $21,550,419 | 10 |
| Moore | 323,653 | 72% | $11,808,915 | $21,859,437 | 8 |
| Nash | 184,275 | 53% | $5,778,753 | $11,145,641 | 31 |
| New Hanover | 36,035 | 29% | $600,511 | $1,131,031 | 95 |
| Northampton | 237,858 | 69% | $8,446,994 | $17,813,568 | 14 |
| Onslow | 356,833 | 73% | $7,758,267 | $15,052,833 | 22 |
| Orange | 137,308 | 54% | $1,865,626 | $3,892,137 | 64 |
| Pamlico | 148,451 | 69% | $5,052,401 | $9,311,089 | 40 |
| Pasquotank | 27,068 | 19% | $702,107 | $2,049,507 | 89 |
| Pender | 425,658 | 76% | $8,623,494 | $16,619,964 | 18 |
| Perquimans | 71,322 | 45% | $1,002,703 | $2,618,454 | 82 |
| Person | 139,044 | 55% | $2,875,900 | $6,493,288 | 52 |
| Pitt | 162,341 | 39% | $9,030,442 | $17,256,099 | 15 |
| Polk | 103,203 | 68% | $1,506,152 | $3,378,506 | 75 |
| Randolph | 290,300 | 58% | $5,226,795 | $9,808,550 | 36 |
| Richmond | 243,571 | 80% | $11,331,983 | $20,574,345 | 11 |
| Robeson | 336,536 | 55% | $6,531,478 | $13,295,994 | 26 |
| Rockingham | 248,629 | 69% | $3,979,648 | $9,116,623 | 41 |
| Rowan | 131,128 | 40% | $3,782,008 | $7,452,586 | 44 |
| Rutherford | 214,840 | 60% | $4,604,139 | $12,576,265 | 27 |
| Sampson | 267,281 | 44% | $8,233,664 | $17,240,698 | 16 |
| Scotland | 139,794 | 69% | $5,817,343 | $10,605,429 | 32 |
| Stanly | 117,985 | 47% | $1,861,496 | $3,597,166 | 70 |
| Stokes | 209,649 | 73% | $3,365,034 | $6,511,386 | 51 |
| Surry | 210,574 | 62% | $4,323,466 | $8,606,226 | 42 |
| Swain | 84,784 | 25% | $735,388 | $1,201,718 | 93 |
| Transylvania | 219,071 | 90% | $18,371 | $32,233 | 100 |
| Tyrrell | 102,399 | 41% | $573,716 | $1,133,898 | 94 |
| Union | 152,512 | 38% | $1,085,438 | $2,538,350 | 83 |
| Vance | 106,671 | 66% | $2,039,009 | $4,141,725 | 63 |
| Wake | 150,046 | 28% | $8,267,231 | $14,519,779 | 24 |
| Warren | 214,121 | 78% | $9,481,597 | $18,647,680 | 13 |
| Washington | 97,632 | 44% | $3,866,921 | $7,919,070 | 43 |
| Watauga | 118,827 | 59% | $1,515,123 | $2,792,753 | 78 |
| Wayne | 163,773 | 46% | $2,931,730 | $5,822,376 | 54 |
| Wilkes | 341,955 | 71% | $7,545,144 | $15,336,527 | 21 |
| Wilson | 83,221 | 35% | $3,652,160 | $6,819,387 | 48 |
| Yadkin | 82,072 | 38% | $2,828,474 | $5,479,697 | 55 |
| Yancey | 150,236 | 75% | $1,757,232 | $2,987,868 | 77 |
| State Total | 18,125,629 | 58% | $466,518,959 | $915,281,312 |
1Timberland = forest land capable of producing in excess of 20 cubic feet per acre per year of industrial wood in natural stands. ↵
2Stumpage = price paid to landowners for standing timber. ↵
3Delivered = price paid to timber buyers upon delivery of timber to the mill. ↵
4Ranking is highest (1) to lowest (100) based on counties’ delivered income values
Data sources: US Forest Service, Evalidator Version 1.8.0.0 Forest Inventory and Analysis Data (01/22/2019), 2015 Timber Products Output Survey, and 2017 Timber Mart South, Vol. 41. ↵
- Wood delivered to mills represents about $915.3 million in 2017, up $11.8 million (1.3%) from 2016.
- Forestry, primary and secondary wood products manufacturing contributed $32.7 billion to NC’s 2016 economy, 150,000 jobs, and a payroll of $7.8 billiona.
2015 Harvest Utilizationb
(million cubic feet)
| Sawlogs | 314 |
| Pulpwood | 269 |
| Veneer logs | 32 |
| Composites (other industrial, bioenergy) | 57 |
Sources:
a Economic contribution of the forest sector in North Carolina, 2016 ↲
b 2015 USFS Timber Products Output Survey ↲
Area of Timberland by Ownership (Figure 1)
Forested Area of North Carolina (Figure 2)
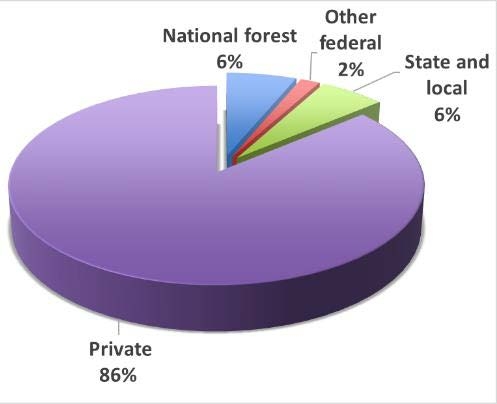
2017 Area of Timberland by Ownership
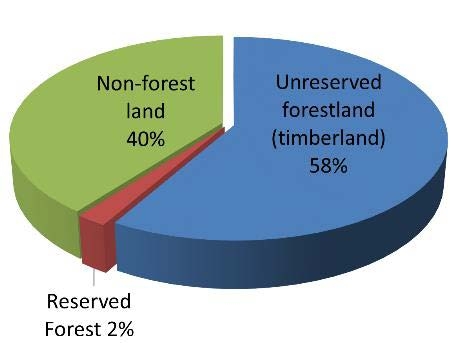
2017 Forested Area of North Carolina
Prepared by
Rajan Parajuli, Ph.D.
Extension Specialist
&
Robert Bardon, Ph.D.
Associate Dean of Extension,
Department Extension Leader
Campus Box 8008
NC State University
Raleigh, NC 27695-8008
Publication date: Jan. 25, 2019
N.C. Cooperative Extension prohibits discrimination and harassment regardless of age, color, disability, family and marital status, gender identity, national origin, political beliefs, race, religion, sex (including pregnancy), sexual orientation and veteran status.
