
Introduction
Vegetated areas next to streams, rivers, lakes, and ponds are known as riparian zones. Riparian zones may contain grasses, trees, shrubs, or other vegetation growing next to the water. In North Carolina, however, natural riparian areas are mostly forested.
In general, riparian buffer systems “buffer” streams and rivers from the impacts of nearby land uses by protecting and stabilizing the stream environment.
In particular, riparian buffers provide the following benefits:
- Protect water resources from nonpoint source pollutants such as sediment and nutrients
- Moderate fluctuations in stream temperature
- Control light quantity and quality in the stream
- Enhance habitat diversity
- Stabilize stream banks and protect channel morphology
- Enhance food webs and species richness
In agricultural settings, riparian buffers are recognized as a best management practice because of the important water quality and habitat functions they provide. Landowners in North Carolina can receive financial assistance for establishing riparian buffers from programs such as the NC Conservation Enhancement Program and the NC Agricultural Cost Share Program.
This factsheet provides an overview about how riparian buffers can be designed to provide water quality treatment depending on pollutant source and landscape setting.
How Riparian Buffers Function to Protect Water Quality
Many factors determine the effectiveness of riparian buffers in removing agriculturally derived pollutants. The most important factor, however, is hydrology: how the groundwater moves through the buffer or how surface water flows over the buffer. Some pollutants are more common in surface water than in groundwater, and vice-versa. Both of these factors must be considered when determining the appropriate riparian buffer design (for example, vegetation type and width) to maximize the water quality benefits.
Sediment and sediment-associated pollutants, such phosphorus, bacteria, and some pesticides, move from agricultural fields to surface waters almost exclusively by surface runoff. Grass buffers adjacent to the fields should be used in the riparian buffer system because they more effectively spread water and remove sediment and sediment-associated pollutants than forested buffers. When surface runoff is sufficiently slowed, sediment will settle out. Without a grassed zone, the runoff water is less likely to spread over the buffer, creating channels that will allow water to move almost as quickly through a buffer as it does from the field, thereby making the buffer ineffective at surface water pollutant removal.
Regardless of the type of inorganic and organic nitrogen applied to agricultural crops, nitrogen moves into the soil and ultimately ends up as nitrate due to microbial conversion. Nitrate is very mobile in soil and groundwater. Any nitrate not used by the crop or the soil organisms will continue to move through the soil and into the shallow groundwater. Even when farmers follow best management practices, 20 to 40 pounds of nitrogen per acre per year routinely move into the shallow groundwater under agricultural fields, according to research done at NC State University.
To remove nitrate from groundwater before it discharges as baseflow to streams, rivers, or ponds, the groundwater must enter a zone where plant roots are or have been active. These plant roots may either absorb the nitrate for use in plant growth or, more importantly, provide an energy source for bacteria that convert nitrate-nitrogen to harmless nitrogen gas. This process, denitrification, occurs almost exclusively in water-saturated zones where abundant organic matter is present. Riparian buffers reduce nitrogen discharge to streams under most conditions. Typically, denitrification rates measured in coastal plain forested riparian buffer areas are generally between 10 to 55 pounds of nitrogen per acre per year. Research at NC State University suggests that the removal efficiency increases as buffer width increases (up to a point). Table 1 shows removal estimates that were established to estimate nitrogen reduction by buffers in the Neuse River watershed.
| Buffer Width (feet) | % Nitrate Reduction |
| 20 | 20 |
| 30 | 25 |
| 50 | 30 |
| 100+ | 35 |
|
Source: 2012 Annual Progress Report on the Neuse Agricultural Rule (15 A NCAC 2B.0238) |
|
Determining the Appropriate Buffer Design
Factors such as land use practices upslope, stream depth, the slope of the land, and the pollutant of concern will help determine the most appropriate buffer design to best reduce pollutants flowing into the stream. This section describes a few common scenarios and recommendations to assist in designing the appropriate riparian buffer width and vegetation.
Please note that the widths recommended in each scenario represent those that would likely provide, on average across sites, the minimal measureable impacts on protecting water quality. In many of the scenarios presented, wider buffers widths would provide additional water quality benefits; however, the additional percent removal per foot of buffer added would decline. Width estimates presented provide guidance that blends the protection of both downstream water quality and agricultural production acreage.
There is little evidence that the type of vegetation in the buffers has any influence on the ability of the buffers to reduce nitrogen. Grass buffers, however, are more effective in reducing sediment, whereas tree buffers maintain streambank integrity and provide better habitat for macroinvertebrates (stream insects) and fish. NC State University research has demonstrated that, in most locations, a grass buffer removes approximately 60% of the sediment and captures sediment-attached phosphorus within the first 15 feet of the buffer.
Scenario A:
The potential buffer site is in an upland position or is next to an incised stream (the stream is very deep relative to the top of the buffer) and conventional tillage is used in areas with moderate erosion potential.
Recommendation:
The riparian buffers should consist of a 25-foot forested or shrub riparian buffer (measured from the edge of the stream outward) with enough grass buffer next to the forested buffer to control erosion (Figure A). The width of the grass buffer should be at least 25 feet. As erosion rates or slope become greater, grass buffers will need to be widened to effectively slow the surface runoff and allow for effective sediment capture. Accumulated sediment in the grass buffer must be removed or it will fail over time; often this maintenance must also include reseeding.
Scenario B:
The potential buffer site is in an upland position or next to an incised stream (the stream is very deep relative to the top of the buffer) and there is little erosion.
Recommendation:
A 50-foot buffer is needed—either 50 feet of tree buffer or 25 feet of trees next to the stream plus 25 feet of grass buffer (Figure B). In this situation, the majority of sediment and sediment-associated pollutants, such as phosphorus and pesticides, are controlled by conservation tillage or landscape position.
Scenario C:
The potential buffer site is next to a stream or ditch in low landscape position with wet soils (sometimes described on soil maps as hydric soils).
Recommendation:
A 25-foot vegetated (trees, grass, or shrubs) buffer is considered sufficient to reduce nitrogen, assuming that erosion is minimal either because conservation tillage is used or the topography is very flat (Figure C). The strategy here is that because groundwater passing through this area is slow and water tables are close to the surface, high denitrification will be promoted. As long as surface runoff is also slow, a narrow buffer should be adequate for acceptable nitrogen and sediment removal.
Scenario D:
The potential buffer site is a well-maintained pasture where livestock have access to the stream.
Recommendation:
A 10 to 25-foot buffer between the grazed area and the stream is considered sufficient (Figure D). Grass buffers can be used if the streambank is stable; otherwise, a tree buffer should be used. It is necessary to fence cattle out of streams to reduce streambank degradation and nutrient deposition. Ten to 25 feet of buffer is considered sufficient to reduce sediment, phosphorus, and nitrogen by approximately 25% or more.
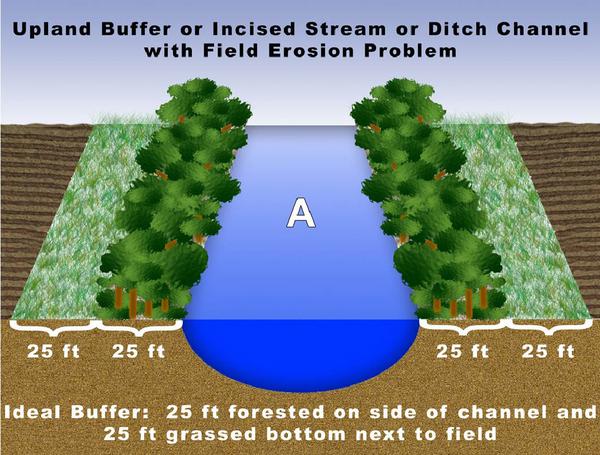
Figure A. Upland buffer or incised stream or ditch channel with field erosion problem.
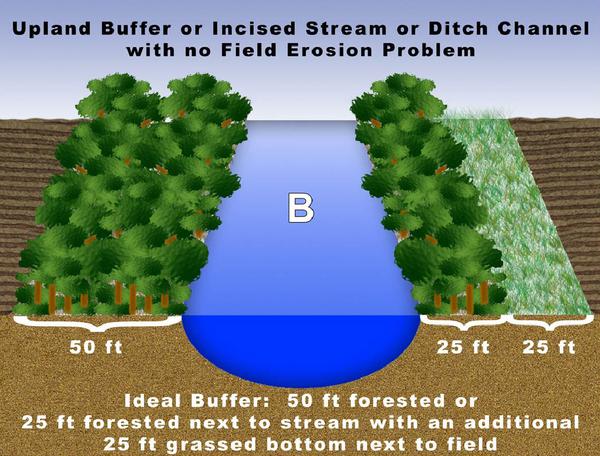
Figure B. Upland buffer or incised stream or ditch channel with no field erosion problem.
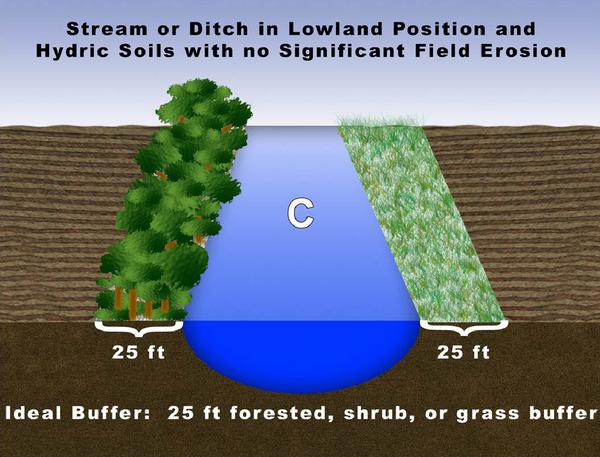
Figure C. Stream or ditch in lowland position and hydric soils with no significant field erosion.
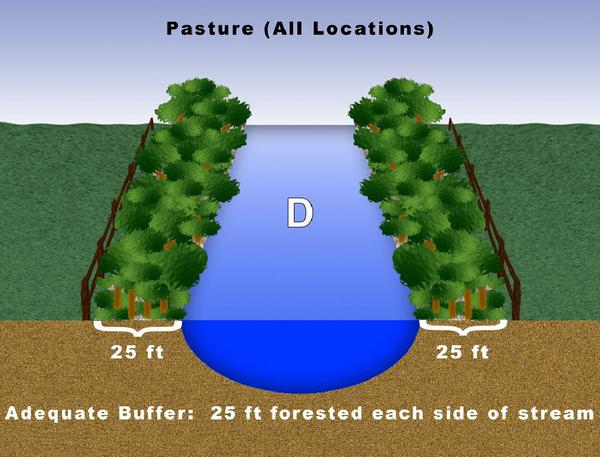
Figure D. Pasture (all locations).
North Carolina Riparian Buffer Publications
North Carolina State University has conducted research for over 30 years on the effectiveness of riparian buffers. Below is a list of publications detailing these research results.
- Line, D.E., D.L. Osmond, and W. Childres. 2016. Effectiveness of Livestock Exclusion in a Pasture of Central North Carolina. J. Environ. Qual. 45:1926–1932.
- King, S.E., D.L. Osmond, J. Smith, M. Dukes, R.O. Evans, S. Knies, S. Kunickis, M. Burchell, and J.W. Gilliam. 2015. Effects of Riparian buffer Vegetation and Width: A 12-year Retrospective Study. J. Environ. Qual.
- Line, D.E. 2015. Effects of Livestock Exclusion and Stream Restoration on the Water Quality of a North Carolina Stream. Trans. ASABE. 58(6):1547–1557.
- Wiseman, J.D., M.R. Burchell, G.L. Grabow, D.L. Osmond, and T.L. Messer. 2014. Groundwater Nitrate Concentration Reductions in a Riparian Buffer Enrolled in the NC Conservation Reserve Enhancement Program. J. Amer. Water Res. Assoc. 50(3):653–664.
- Johnson, S., M.R. Burchell, R.O. Evans, D.L. Osmond, and J.W. Gilliam. 2012. Riparian Buffer Located in an Upland Landscape Position Does Not Enhance Nitrate-nitrogen Removal. Ecolog. Eng. 52:252-261.
- Wu, L., D. Osmond, A. Graves, M. Burchell, and O. Duckworth. 2012. Relationships between Nitrogen Transformation Rates and Gene Abundance in a Riparian Buffer Soil. Environ. Manage. 50(5):861-874.
- Messer, T.L., M.R. Burchell, G.G. Grabow, and D.L. Osmond. 2011. Groundwater Nitrate Reductions within Upstream and Downstream Sections of a Riparian Buffer. Ecolog. Eng.. 47:297–307.
- Smith, T.A., D.L. Osmond, C.E. Moorman, J.M. Stucky, and J. W. Gilliam. 2008. Effect of Vegetation Management on Bird Habitat in Riparian Buffer Zones. Southeast. Natural. 7:277–288.
- Smith, T.A., D.L. Osmond, and J. Wendell Gilliam. 2006. Riparian Buffer Width and Nitrate Removal in a Lagoon-effluent Irrigated Agricultural Area. J. Soil and Water Conser. 61:273–281.
- Dukes, M.D., R.O. Evans, J.W. Gilliam, and S.H. Kunickis. 2003. Interactive Effects of Controlled Drainage and Riparian Buffers on Shallow Groundwater Quality. J. Irrig. Drain. Eng.
- Line, D.E. 2003. Changes in a Stream's Physical and Biological Conditions Following Livestock Exclusion. Trans. ASAE 46(2), 287–293.
- Dukes, M.D., R.O. Evans, J.W. Gilliam, and S.H. Kunickis. 2002. Effect of Riparian Buffer Width and Vegetation Type on Shallow Groundwater Quality in the Middle Coastal Plain of North Carolina. Trans. ASAE. 45(2):327–336.
- Line, D.E., White, N.M, Osmond, D.L., Jennings, G.D., Mojonnier, C.B. 2002. Pollutant Export from Various Land Uses in the Upper Neuse River Basin. Water Environ. Res. 74(1):100–108.
- Line, D.E., Harman, W.A., Jennings, G.D., Thompson, E.J., and Osmond, D.L. 2000. Nonpoint-Source Pollutant Load Reductions Associated with Livestock Exclusion. J. Environ. Qual. 29(6):1882–1890.
- Jacobs, T.C. and J.W. Gilliam. 1985. Riparian Losses of NO3-N from Agricultural Drainage Waters. J. Environ. Qual.14:472–478.
- Gilliam, J.W. 1994. Riparian Wetlands and Water Quality. J. Environ. Qual. 23:896–900.
Acknowledgements
This publication is a revision of an earlier version. The author would like to thank W. Gilliam for his earlier contributions.
Publication date: July 26, 2017
Reviewed/Revised: May 6, 2022
AG-439-38
N.C. Cooperative Extension prohibits discrimination and harassment regardless of age, color, disability, family and marital status, gender identity, national origin, political beliefs, race, religion, sex (including pregnancy), sexual orientation and veteran status.