
Amidst high inflation and increased economic activity, the forest sector in North Carolina continued to surge, with a total economic size of greater than $42.5 billion in 2022. Compared to 2021, the North Carolina forest sector realized a significant gain in 2022—nearly $7.3 billion in total economic activities across the state—predominantly in rural counties.
- In 2022, the forest sector in North Carolina—including forestry and logging operations, sawmills, furniture mills, and pulp and paper industries—directly contributed $25.8 billion in industry output, which was nearly 2% of the statewide economic output. The forest sector directly employed about 73,646 people with a payroll of $4.9 billion and a value-added (gross state product) of $7.5 billion.
- Including direct, indirect, and induced effects, the forest sector in North Carolina had a total contribution of $42.5 billion in industry output to the North Carolina economy, supporting approximately 151,700 full-time and part-time jobs with a payroll of about $10.1 billion.
- Total economic output in 2022 was up 20.6%, compared to 2021, and total employment rose 8.6% (12,000 more jobs). Solid wood product industries gained over 9,200 jobs in 2022, compared to a year ago.
- The total value added, equivalent to the gross domestic product, was up 14.9% to $16.3 billion, predominantly in secondary solid wood and paper products industries.
- In 2022, the forest sector was the top manufacturing sector in the state, supporting over 2,700 more jobs than the food manufacturing sector in North Carolina.
- Every job created in the forest sector resulted in another 1.06 jobs in North Carolina.
- On average, every dollar generated in the forest sector contributed an additional 65 cents to the rest of the North Carolina economy.
- The forest sector in North Carolina directly generated about $58.1 million in county taxes, $231.9 million in state taxes, and $1.15 billion in federal taxes. Compared to 2021, the federal tax collection increased by 165%.
- International exports from the North Carolina forest sector totaled about $1.72 billion, down 1% from 2021.
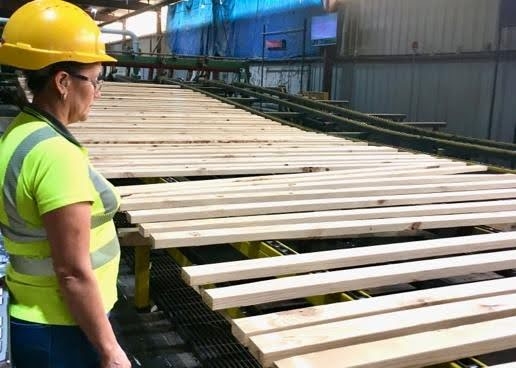
Photo by Robert Bardon
| Contribution | Industry Operation | Employment[2] (Jobs) |
Labor Income[3] (Million $) |
Gross State Product[4] (million $) |
Industry Output[5] (million $) |
|---|---|---|---|---|---|
| Direct Contribution[6] | Forestry operations | 777
|
44.12
|
51.61
|
69.16
|
| Logging | 4,940
|
204.82
|
302.49
|
503.35
|
|
| Primary solid wood mills[7] | 6,244
|
441.11
|
999.77
|
3,261.63
|
|
| Secondary solid wood mills[8] | 43,517
|
2,624.08
|
3,764.95
|
11,142.38
|
|
| Primary paper and paperboard | 4,661
|
483.71
|
804.86
|
3,606.61
|
|
| Secondary paper and paperboard | 13,506
|
1,125.60
|
1,561.47
|
7,237.36
|
|
| Total | 73,646
|
4,923
|
7,485
|
25,820
|
|
| Total Contribution[9] | Forestry operations | 1,005
|
57.19
|
75.81
|
112.55
|
| Logging | 6,684
|
300.89
|
473.47
|
815.35
|
|
| Primary solid wood mills | 15,630
|
1,072.64
|
2,074.55
|
5,292.64
|
|
| Secondary solid wood mills | 79,788
|
5,019.86
|
7,855.35
|
18,824.20
|
|
| Primary paper and paperboard | 15,237
|
1,221.03
|
2,086.62
|
6,046.21
|
|
| Secondary paper and paperboard | 33,356
|
2,434.51
|
3,809.66
|
11,462.80
|
|
| Total | 151,700
|
10,106
|
16,375
|
42,554
|
|
| Change in Total Contribution from 2021 | Forestry operations | 0.1%
|
-0.7%
|
3.8%
|
7.8%
|
| Logging | -4.8%
|
-6.5%
|
15.0%
|
8.9%
|
|
| Primary solid wood mills | 23.9%
|
24.9%
|
25.7%
|
42.7%
|
|
| Secondary solid wood mills | 8.5%
|
15.1%
|
18.8%
|
24.4%
|
|
| Primary paper and paperboard | 5.2%
|
7.6%
|
5.5%
|
11.8%
|
|
| Secondary paper and paperboard | 7.6%
|
10.8%
|
7.9%
|
12.5%
|
|
| Total | 8.6%
|
13.2%
|
14.9%
|
20.6%
|
[1] Economic contribution numbers, based on multi-industry contribution analysis, are reported in 2022 dollars. The industry contribution analysis approach from IMPLAN Online was employed and the IMPLAN sectors included 15, 16, 19 (partial), 132, 133, 134, 135, 136, 137, 138, 139, 140, 142, 143, 144, 145, 146, 147, 148, 149, 150, 151, 365, 366, 367, 370, 371, and 373.
[2] Employment includes both full-time and part-time jobs.
[3] Labor income includes all forms of employment income, including employee compensation (wages and benefits) and proprietor income.
[4] Gross State Product (value added) is the difference between industry output and the cost of intermediate inputs. It consists of employee compensation, taxes on production and imports less subsidies, and gross operating surplus.
[5] Industry output is the total annual value of production by industry.
[6] Direct contribution is a series of production changes or expenditures made by producers and consumers as a result of an activity.
[7] Primary mills, such as sawmills and pulp mills, consume wood in a round or log form before producing a value-added product.
[8] Secondary mills, such as furniture and paper mills, use wood-based products to produce value-added products.
[9] Total contribution is the sum of direct, indirect, and induced contribution effects generated by the sector.
Publication date: June 3, 2024
AG-844
N.C. Cooperative Extension prohibits discrimination and harassment regardless of age, color, disability, family and marital status, gender identity, national origin, political beliefs, race, religion, sex (including pregnancy), sexual orientation and veteran status.
