
This publication defines and discusses the factors that affect forage quality and the prediction indices that can be used to assign a science-based measure of quality to evaluate forages.
Introduction
If the goal is to support livestock, forage quality is ultimately determined by evaluating livestock metrics. Examples of livestock metrics include the amount of milk produced, animal weight gains obtained, reproductive efficiency, and other animal responses for which the forage has a direct effect. Hence, the higher the quality of the forage, the higher the livestock performance should be. Common terms when referring to forage quality relative to the above respective animal responses are “milk in the bucket,” “pounds on the scale,” or “calves on the ground.”
The values reported in a laboratory analysis of a forage tissue sample are estimates of its nutritive value. However, nutritive value estimates are not the only factors that affect animal performance. Animal performance is also affected by other factors, such as digestibility, anti-quality constituents (for example, alkaloids, nitrates, and prussic acid, among others that are specific to different forages), and the amount of forage consumed by the animals (intake).
Several estimates of nutritive value are presented in Figure 1. These estimates are useful in providing a first assessment of the relative potential of a forage to affect animal performance and to better allocate forages to livestock with different nutritional needs.
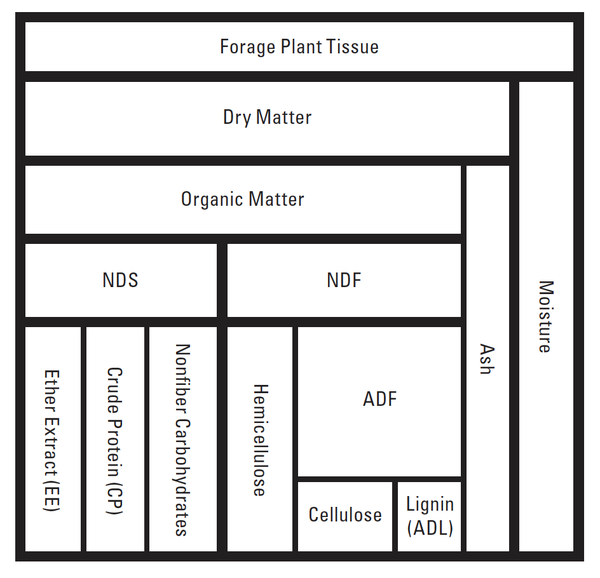
Figure 1. Schematic of laboratory analysis and chemical constituents of forages (adapted from Moore et al., 2007); ADF = acid detergent fiber, ADL = acid detergent lignin; NDF = neutral detergent fiber; NDS = neutral detergent solubles.
Factors That Affect Forage Quality
Nutritive Value
The nutritive value of forages is assessed by measuring nutrient concentration and digestibility and by studying the nature of the end products of digestion. The three major nutrients found in forages are carbohydrates, proteins, and lipids, as described below.
- Nutrient Concentration
Carbohydrates: The major source of energy for the ruminal microorganisms responsible for forage digestion in the rumen. Although not evident, we feed the ruminant animal by feeding the rumen microorganisms first. These microorganisms are extremely important for ruminants consuming forages because they convert the carbohydrates in the forage into volatile fatty acids, which are the major energy sources for grazing ruminants. Forage carbohydrates are divided into structural carbohydrates, found in plant cell walls, and nonstructural carbohydrates, which represent cell contents.
Nonstructural carbohydrates: These consist of a group of different types of sugars (for example, sucrose) and reserve carbohydrates (starch and fructans). Starch is present in all forages, but fructans occur only in cool-season grasses. Starch can be found especially in seeds and roots. Fructans are found in leaves and stems, especially in the lower parts of the plant. If these carbohydrates are accessible to rumen microbes (through mastication or seed processing), they are rapidly and completely digested.
Structural carbohydrates: The plant cell wall consists of cellulose, hemicellulose, lignin, pectin, β-glucans, and polysaccharides. Lignin is a noncarbohydrate component of the cell wall that is formed by phenolic compounds and has a negative impact on digestibility. Detergent fiber analysis divides plant cell walls into neutral detergent fiber (NDF), acid detergent fiber (ADF), and acid detergent lignin (ADL). The NDF fraction encompasses cellulose, hemicellulose, and lignin. Pectin and β-glucans are not included in the NDF fraction, and they are rapidly and thoroughly digested by microorganisms in ruminants. The ADF fraction encompasses cellulose and lignin. If the ADF fraction is not analyzed sequentially after NDF analysis, then it may contain some pectin contaminants, especially in legumes. Finally, the ADL fraction represents lignin.
Proteins: Polymers formed by amino acids. Protein concentration is typically analyzed as crude protein (CP), which is a measure of the total concentration of nitrogen (N) multiplied by 6.25 to estimate total protein concentration in the sample. In forages, nonprotein nitrogen (NPN, which includes free amino acids and ammonium compounds) typically represents 10% to 20% of the total N, but this proportion can increase during wilting and especially if the material is ensiled (Hatfield et al., 2007). The NPN can be turned into bacterial protein in ruminants, but it has little or negligible nutritive value for swine and poultry. Total crude protein is typically greater in legumes (15%–25%) than in grasses (10%–20%), and concentrations usually decrease as plants mature due to the accumulation of the fiber fraction (Hatfield et al., 2007).
Lipids: Organic compounds that are relatively insoluble in water but soluble in organic solvents such as ether (ether extract or EE). Lipids are the most energy-rich fraction, typically containing 2.25 times more energy than either carbohydrates or proteins. The most relevant lipids in animal nutrition are fatty acids, triglycerides, and phospholipids. Fatty acids typically constitute 1% to 3% of forage dry matter (DM), with the majority being polyunsaturated (Hatfield et al., 2007). Most unsaturated fatty acids will be modified by ruminal microorganisms and become saturated in the rumen. Lipids are typically measured as ether extract, but this measurement also includes lipids of no nutritional value (such as waxes and terpenes). In general, fatty acids represent only 50% or less of ether extract in forages (Hatfield et al., 2007). Table 1 describes the nutritional composition of the main forages fed to livestock in North Carolina.
| Forage | TDN (%) | Ash (%) | CP (%) | EE (%) | NDF (%) | ADF (%) |
|---|---|---|---|---|---|---|
| Alfalfa hay [2]
|
60.0
|
9.2
|
19.9
|
2.9
|
39.3
|
31.9
|
| Bermudagrass hay [3]
|
49.0
|
8.1
|
7.8
|
2.7
|
73.3
|
36.8
|
| Corn silage [4]
|
72.0
|
3.6
|
8.7
|
3.1
|
46.0
|
26.6
|
| Fescue hay [5]
|
44.0
|
6.8
|
10.8
|
4.7
|
70.0
|
39.0
|
| Ladino clover hay [6]
|
60.0
|
9.4
|
22.4
|
2.7
|
36.0
|
32.0
|
| Orchardgrass hay [7]
|
65.0
|
8.5
|
12.8
|
2.9
|
59.6
|
33.8
|
| Ryegrass fresh
|
84.0
|
-
|
17.9
|
4.1
|
61.0
|
38.0
|
| Sorghum silage
|
60.0
|
5.9
|
9.4
|
2.6
|
60.8
|
38.8
|
[1] Values from NRC (2000); TDN = total digestible nutrients, CP = crude protein, EE = ether extract, NDF = neutral detergent fiber, ADF = acid detergent fiber ↲
[2] Sun-cured, early bloom ↲
[3] Coastal, sun-cured, 43–56 day regrowth ↲
[4] Well eared ↲
[5] Kentucky 31 ↲
[6] Sun-cured ↲
[7] Sun-cured, early bloom ↲
- Digestibility
Digestibility is the breakdown and absorption of nutrients in the gastrointestinal tract of animals. The most direct measurement of digestibility is conducted with an animal (in vivo) by measuring DM consumed and DM excreted. Then, the proportion of DM that disappeared is assumed to have been digested. Obtaining digestibility data using animals is expensive (in vivo digestibility). Alternative methods have been developed in the laboratory (in vitro) to estimate digestibility (referred to in the literature as either in vitro DM digestibility or disappearance). Digestibility is always highest in young immature plant tissue and lowest in mature plant tissue. Broadly, DM digestibility is usually lesser in warm-season forages (45–66%), intermediate to greater in cool-season forages (49–81%), and greatest in legumes (67–81%) (Collins and Fritz, 2003). The in vitro disappearance of NDF (IVNDFD) has been identified as a major predictor of animal performance in lactating cattle (Oba and Allen, 1999). A one-unit increase in IVNDFD is associated with 0.37 lb/day increase in DM intake and 0.55 lb/day increase in 4% fat-corrected milk (Oba and Allen, 1999). The response is especially noticeable with more productive cows. Thus, forages with greater IVNDFD should be allocated to the most productive animals.
Voluntary Intake
The amount of forage DM that animals consume when they have an unrestricted supply is considered voluntary intake. Animal performance depends then directly on the daily intake of DM multiplied by its digestibility. Intake is the main determinant of animal performance, followed by digestibility. Forages are especially influential on altering DM intake due to their greater concentrations of fiber, which makes them bulky and difficult to digest compared with concentrates (processed feed). Animals consuming forages with greater fiber concentrations may not meet their energy requirements due to rumen fill, as shown in Figure 2. Energy intake remains constant, however, because of physiological mechanisms regulating energy metabolism (physiological control). Once ruminal fill reaches maximum capacity, DM and energy intake decrease as forage fiber concentration increases (fill control). During this stage, energy requirements are likely not being met due to high fiber concentration of the mature forage. Ruminants will, however, regulate intake to meet their energy requirements when rumen fill is not a limiting factor. This will happen in diets with lesser fiber concentration, and intake will decrease as fiber concentrations further decrease due to increasing energy density of the diet.
Intake is the most difficult forage attribute to measure because actual intake is a function of forage characteristics (that is, physical properties and nutrient availability), animal characteristics (that is, capacity, appetite), and management (that is, feeding, stress). NDF concentration and IVNDFD have been used, however, to predict intake to some degree. IVNDFD has been shown to be not only a good predictor of intake, but also related to milk production (Oba and Allen, 1999).
Preference
Preference is a relative expression that requires the opportunity for choice. When given free-choice access to forages, livestock can select one forage over another or parts of the same forage based on plant characteristics such as leafiness, height, and density of sward (Fisher et al., 1991).
Anti-quality Factors
Several compounds can be present in forages that affect animal performance, cause sickness, or possibly cause animal death. These include such compounds as alkaloids, tannins, and phytoestrogens in many legumes, nitrates in many grasses, and cyanoglycosides in white clover and sorghum, as well as mycotoxins in many forages. The presence and concentrations of these compounds vary among plant species (including weeds) and are often influenced by environmental factors and animal sensitivity. For example, elevated concentrations of tannins can reduce intake and rumen digestibility. But in relatively reduced concentrations, condensed tannins can be beneficial by increasing bypass protein. In general, forages of desirable quality should not have these compounds, or if these compounds are present, they should be at reduced concentrations that do not negatively affect animal responses.
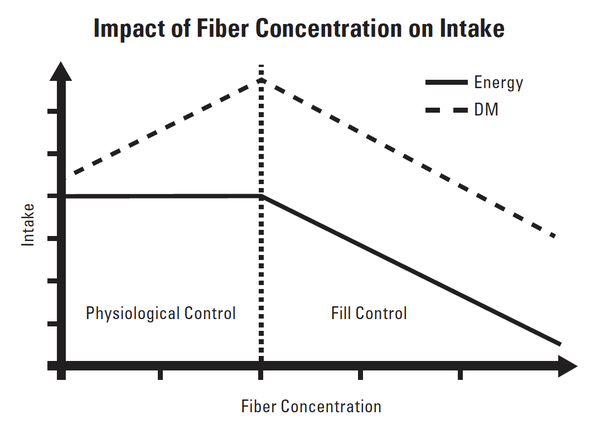
Figure 2. Relationship between fiber concentration and intake (adapted from Collins and Fritz, 2003). The first half of the figure shows that dry matter (DM) intake increases as fiber concentration in the forage increases.
Predicting Forage Quality
Two systems have been developed to express forage quality in terms of an index that combines intake, nutritive value, and digestibility estimates. The relative feed value (RFV) index was developed by the American Forage and Grassland Council (Rohweder, 1978), and the relative forage quality (RFQ) system was developed by Moore and Undersander (2002). The RFQ system was developed to overcome the limitations of RFV, particularly its limited ability to compare among forage families and its inability to update prediction equations. This was achieved by introducing IVNDFD in the calculations and using total digestible nutrient (TDN) equations.
Relative Feed Value (RFV)
This index ranks forages relative to the digestible dry matter intake (DMI) of full-bloom alfalfa (assumes 41% ADF and 53% NDF with an RFV of 100 at this growth stage).
RFV = (DMI × DDM) ÷ 1.29
Where:
DMI = dry matter intake (% of BW)
= 120 ÷ (% NDF)
DDM = digestible dry matter (% of DM)
= 88.9 − (0.779 × % ADF)
Relative Forage Quality (RFQ)
This index is calculated by estimating the digestibility of the forage dry matter and how much an animal eats based on its “filling” capacity. Variations in the digestibility of NDF can result sometimes in variation in animal responses when fed similar RFQ forages.
RFQ = (DMI × TDN) ÷ 1.23
Where:
DMI = dry matter intake (% of BW)
TDN = total digestible nutrients (% of DM)
For legumes (alfalfa, clovers) and legumes-grass mixtures:
DMI = (120 ÷ NDF) + (NDFD − 45) × (0.374 ÷ 1350) × 100
TDN = (NFC × 0.98) + (CP × 0.93) + (FA × 0.97 × 2.25) + (NDFn × (NDFD ÷ 100)) − 7
For grasses (warm- and cool-season):
DMI = -2.318 + 0.442 × CP − 0.0100 × CP2 − 0.0638 × TDN + 0.000922 × TDN2 + 0.180 × ADF − 0.00196 × ADF2 − 0.00529 × CP × ADF
TDN = (NFC × 0.98) + (CP × 0.87) + (FA × 0.97 × 2.25) + (NDFn × NDFDp ÷ 100) − 10
Where:
ADF = acid detergent fiber (% of DM)
BW = body weight
CP = crude protein (% of DM)
DMI = dry matter intake
EE = ether extract (% of DM)
FA = fatty acids (% of DM) = ether extract − 1
NDF = neutral detergent fiber (% of DM)
NDFCP = neutral detergent fiber crude protein (not found being used)
NDFD = 48-hour in vitro NDF disappearance (% of NDF)
NDFDp = 22.7 + 0.664 × NDFD (for grasses only)
NDFn = nitrogen-free NDF = NDF − NDFCP, else estimated as NDFn = NDF × 0.93
NFC = nonfibrous carbohydrate (% of DM) = 100 − (NDFn + CP + EE + ash)
The RFQ is especially advantageous over the RFV index when evaluating grasses and grass-and-legume mixtures compared to legumes. In both systems a 100 value represents roughly a full-bloom alfalfa. The greater the index, the better the forage quality. Calculation of RFQ requires values of NFC, FA, NDFn, NDFD, and NDFDp added to the list provided in Table 1 compared to calculating RFV.
Based on the RFQ values of alfalfa (165.9) and bermudagrass (80.2) (Table 2), alfalfa hay in this example should be fed to early lactation cattle to take advantage of its excellent quality (Table 3). On the other hand, the bermudagrass hay used has a very low quality and should be fed to animals on maintenance. It is important to clarify at this point that RFQ should not be used to formulate a ration, but instead to assess if a forage source will be an adequate base for the diet of the target animal. If greater levels of animal performance are desired than what the forage allows as a sole source of feed, then additional supplementation will be needed to overcome the limitations of the lesser forage RFQ values. It is recommended, however, that producers evaluate the economics of such a practice.
| RFQ | Cattle Type |
|---|---|
| 140–160 | Dairy, early lactation; dairy calf |
| 125–150 | Dairy, mid- and late lactation; heifer, 3–12 mo; stocker cattle |
| 115–130 | Heifer, 12-18 mo; beef cow and calf |
| 100–120 | Heifer, 18-24 mo; dry cow |
[1] Source: Undersander (2003). ↲
References
Collins, M., and J. O. Fritz. 2003. "Forage Quality." In Forages: An Introduction to Grassland Agriculture, edited by R. F. Barnes, C. J. Nelson, K. J. Moore and M. Collins, 363–390. Ames, IA: Blackwell Publishing. ↲
Fisher, D., Burns, J., Pond, K., Mochrie, R., & Timothy, D. 1991. Effects of Grass Species on Grazing Steers: I. Diet Composition and Ingestive Mastication. Journal of Animal Science 69: 1188–1198. ↲
Hatfield, R. D., H. J. G. Jung, G. Broderick, and T. C. Jenkins. 2007. "Nutritional Chemistry of Forages." In Forages: The Science of Grassland Agriculture, edited by R. F. Barnes, C. J. Nelson, K. J. Moore and M. Collins, 467-485. Blackwell Publishing. Ames, IA. ↲
Moore, J. E., and D. J. Undersander. 2002. "A Proposal for Replacing Relative Feed Value with an Alternative: Forage Relative Quality." In Proc. Am. Forage and Grassl. Counc. 171–175. Bloomington, MN. 14-17 July 2002. Am. Forage and Grassl. Counc., Georgetown, TX. ↲
NRC. 2000. Nutrient Requirements of Beef Cattle, 7th ed. National Academy Press. Washington, DC. ↲
Oba, M., and M. S. Allen. 1999. Evaluation of the Importance of the Digestibility of Neutral Detergent Fiber from Forage: Effects on Dry Matter Intake and Milk Yield of Dairy Cows. J. Dairy Sci. 82: 589–596. ↲
Rohweder, D. A., R. F. Barnes, and N. Jorgensen. 1978. Proposed Hay Grading Standards Based on Laboratory Analyses for Evaluating Quality. J. Anim. Sci. 47: 747–759. ↲
Undersander, D. J. 2003. The New Relative Forage Quality Index—Concept and Use. World’s Forage Superbowl Contest, UWEX. ↲
Acknowledgments
This publication is a revision of an earlier version. The authors would like to thank J.J. Romero, J.C. Burns, and Philipe Moriel for their earlier contributions.
Publication date: Jan. 1, 2014
Reviewed/Revised: Aug. 15, 2024
AG-792
N.C. Cooperative Extension prohibits discrimination and harassment regardless of age, color, disability, family and marital status, gender identity, national origin, political beliefs, race, religion, sex (including pregnancy), sexual orientation and veteran status.