
Introduction
Grain pea has been produced on the North Carolina/South Carolina border over the past several years by a pocket of growers around Lumberton, North Carolina (Figure 1). A dry pea with a green or yellow seed coat (Figure 2), it is shelled for human or animal consumption. Grain peas are high in protein and also low in trypsin inhibitors and therefore do not require heat treatment when used as animal feed. Multiple buyers in the Southeast are interested in grain peas for inclusion in traditional animal feed, grain-free dog food, and food-grade products. The alternative to locally sourced peas for regional end users is peas shipped via rail from the Northwest.
One of the biggest advantages of incorporating grain peas into North Carolina growers’ rotations is the unique time frame in which they are produced; planting occurs from December through January, and harvest occurs in late May or early June. This window offers an opportunity for our producers to plant a crop other than small grains after other field management operations have concluded in late fall. Such diversification from traditional winter grain crops can help alleviate some of the pest-management problems associated with continuous small grain production. Peas are a legume, similar to soybeans, and can provide some residual N benefit to the subsequent cash crop. Also, North Carolina producers can grow peas with minimal investment in new equipment, as the peas are planted with a grain drill and can be harvested with the soybean sieves on a combine.
The disadvantages of producing grain pea in our state include (1) difficulty establishing the crop during December and January due to prolonged wet conditions and disease pressure, (2) close proximity of average yield and break-even yield, and (3) lack of stable markets.
Local growers had been producing this crop largely through trial-and-error before NC State Extension began conducting targeted applied research to answer production questions. If stable markets emerge, we want our growers to already have the foundational agronomic information necessary to grow this crop successfully (Figure 3). Growers identified the most important production topics that needed to be addressed through research to help optimize production, which included planting date, seeding rate, and variety selection. We have not been able to research many other topics yet in North Carolina, though we have obtained anecdotal information on those topics from our growers and colleagues in other parts of the United States.
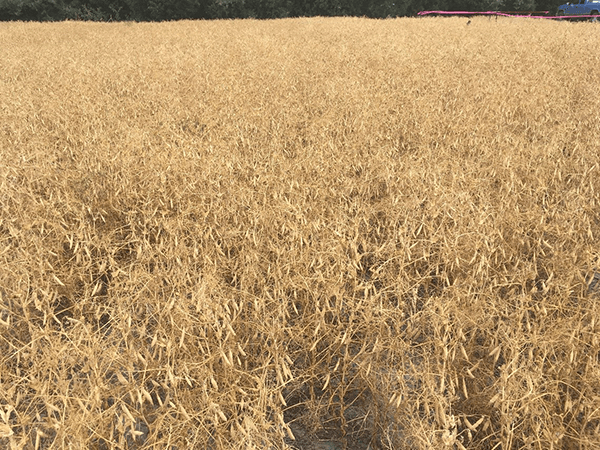
Figure 1. Grain pea crop approaching harvest time in Wayne County, NC.
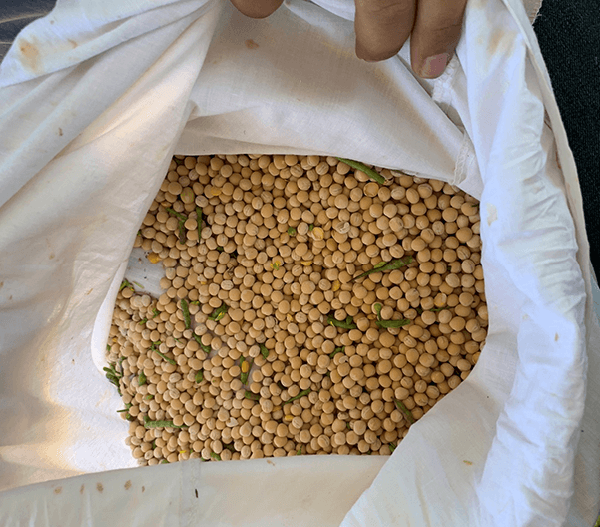
Figure 2. Yellow pea grain sample at harvest with some green weed material.
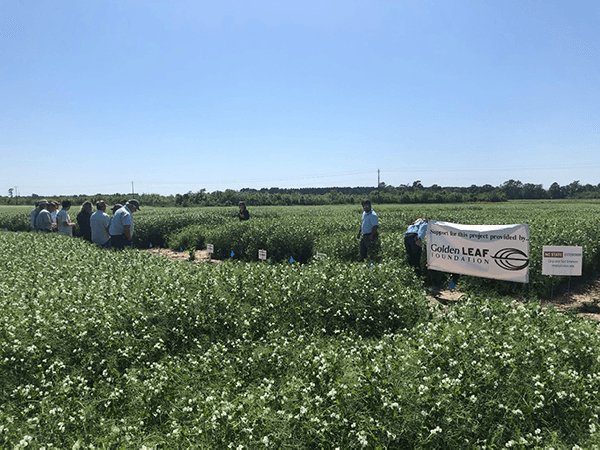
Figure 3. Field day showcasing the pea agronomic research in the Carolinas.
Planting Date
The time frame in which grain peas are planted (from December to mid-January) is one of the most desirable aspects of producing this crop in North Carolina. In an effort to discover optimal planting times, we evaluated pea planting dates from early December through mid-March in 2018 and 2019 at four locations (Clayton 2018, Clayton 2019, Kinston 2019, Rocky Mount 2018). We then characterized planting dates and locations in growing degree days (heat accumulation) from planting to harvest and the impact on grain yield. Following are our primary takeaways on planting dates.
- Planting in December and January typically resulted in higher pea yields (Figure 4, Figure 5, Figure 6, and Figure 7).
- As growing degree days from planting to harvest increase, yield typically increases, meaning that earlier planting was often associated with higher yields (Figure 8).
- At more northern locations in North Carolina, planting in December optimized yield.
- In southern North Carolina locations, planting date can be delayed until mid-January due to more heat accumulation at these locations.
- Pushing planting date past January is not advisable in any location, as it delays flowering onset to a time when temperatures are typically too high for that growth stage. Grain peas are very sensitive to heat during flowering; when temperatures exceed 85°F, flowering and pod development are inhibited. As a result, yields may decline. The goal should be to plant peas early enough that flowering is not pushed into late spring.
- Growers should be ready to plant grain peas in early December if conditions allow. It is often wet and cold during our optimal planting window; it can take weeks from the desired planting date for soil to be dry enough for planting, especially on heavier soil types.
- Peas are sensitive to freeze events below 20°F; however, if the aboveground tissue is damaged, plants are capable of sending a new shoot from the underground growing point. Like corn, peas have hypogeal emergence, which means the growing point remains underground.
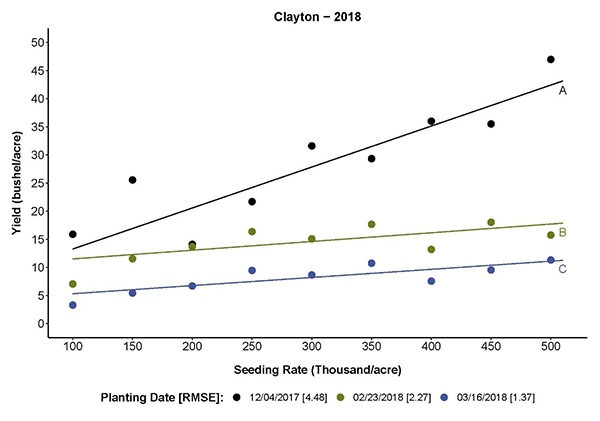
Figure 4. Grain pea yield as impacted by planting date and seeding rate in Clayton, NC (2018).
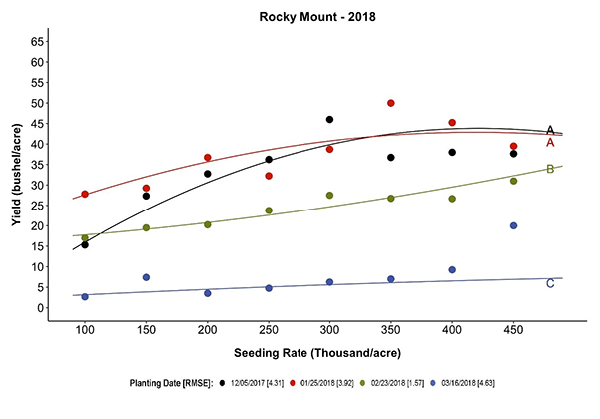
Figure 5. Grain pea yield as impacted by planting date and seeding rate in Rocky Mount, NC (2018).
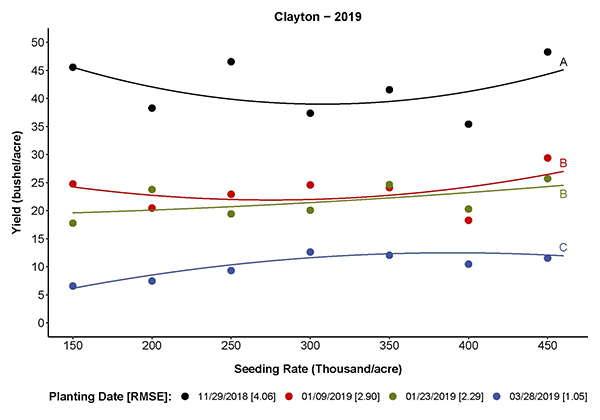
Figure 6. Grain pea yield as impacted by planting date and seeding rate in Clayton, NC (2019).
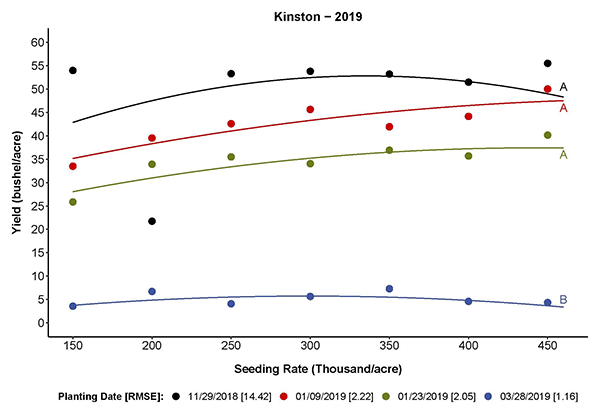
Figure 7. Grain pea yield as impacted by planting date and seeding rate in Kinston, NC (2019).
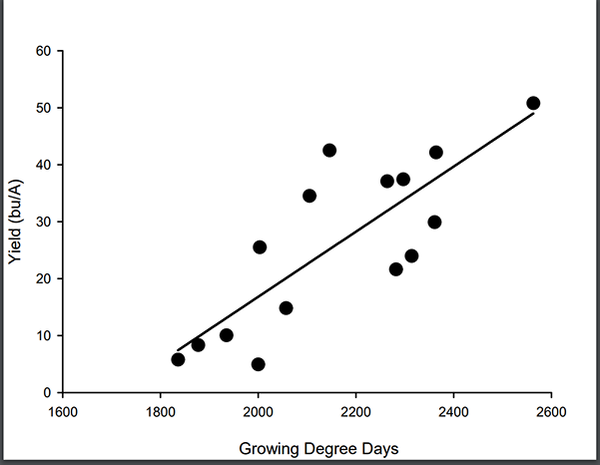
Figure 8. Pea yield response to growing degree days across sites in 2018 and 2019.
Seeding Rate and Seed Treatments
Peas can be planted into clean-till or no-till situations in North Carolina. Seed is the largest input cost for pea production here. Peas can vary considerably for seeds/lb, from 1,500 to 6,000, so a population target is used to determine seeding rate. In other US regions, the recommended seeding rate for peas is to target 300,000 to 320,000 live plants/A. We investigated seeding rates from 100,000 to 500,000 seeds/A in 2018 and 2019 to determine if we needed to employ seeding rates targeting 300,000 to 320,000 live plants/A to optimize yield in North Carolina (Figure 4, Figure 5, Figure 6, and Figure 7). In earlier planting situations, yield tended to plateau at 300,000 planted seeds/A, which indicates that growers in our state may be able to plant slightly less seed/A than in other US regions and still optimize yield. With later planting dates, more seed was often needed to optimize yield.
We have not conducted research on whether a seed inoculant or fungicidal seed treatment is necessary in grain peas in North Carolina; however, we suspect that using both treatments will likely protect yield. Peas are a legume that fixes nitrogen, but they use a different species of bacteria for N-fixation than soybeans or peanuts. Since pea production is uncommon in North Carolina, it is unknown if the necessary bacteria are present in the soil for optimal N-fixation without inoculation.
In can take pea seed more than 30 days to emerge when soil temperatures are consistently below 50°F. Peas are susceptible to a variety of seedling diseases that are intensified by cool, wet conditions. When grain peas are planted in December and January in North Carolina, the ground is typically cold and often wet. Using a fungicidal seed treatment will likely help protect against seedling diseases when peas are planted into conditions conducive for seedling disease development.
Row Spacing
Based on recommendations from across the United States, peas are best planted with narrow row spacing (<10 in.). Planting in narrow rows allows the peas to use their tendrils to hold each other upright, keeping the plants from touching potentially cold, wet ground (Figure 9). Narrow rows also help peas outpace winter and spring weeds by facilitating rapid canopy closure.
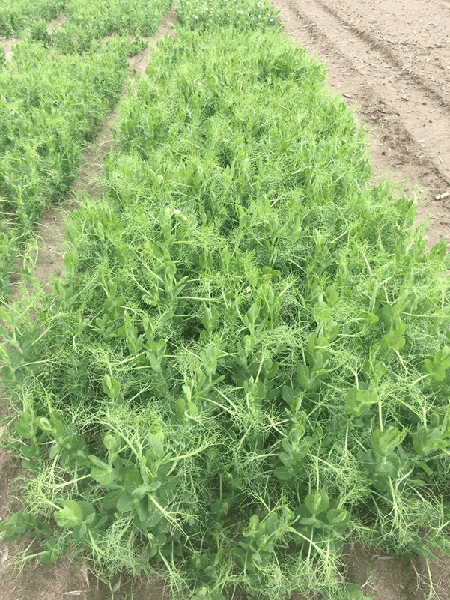
Figure 9. Pea tendrils aiding the plants in standability to reduce lodging.
Variety Selection
Before we began investigating grain peas at NC State, growers in our region were producing only one pea variety (‘ESO’), so they had no information about the comparative potential performance of other varieties here. In 2018 and 2019, we compared available varieties from around the United States for yield and other agronomically important characteristics at several sites in North Carolina and South Carolina (Figure 10; Tables 1, 2, 3, 4, and 5). Even if superior varieties are identified for yield and other agronomic traits, local seed production is limited. Importing seed from the Northwest via rail can be economically impractical. The following list describes the primary results on pea variety characteristics from our trials.
- Yield: Yield potential was higher at the more southern research sites, which is likely a function of more growing degree day accumulation earlier in the season and the use of later-than-optimal planting dates at the more northern locations (Tables 1, 2, 3, 4, and 5). We were able to identify several varieties that out-yielded ESO.
- Lodging: Varieties were rated for lodging when present across sites, and considerable variation was observed among varieties (Tables 1, 2, 3, 4, and 5).
- Powdery mildew: Powdery mildew is one of the biggest pest management challenges with grain pea production in our region. We did not manage this disease with a fungicide in 2018 in an effort to identify varieties that have resistance to this disease in our region. At the Dillon County, South Carolina, site in 2018, where we had heavy powdery mildew pressure, 11 of the 34 varieties evaluated showed resistance to powdery mildew (Table 1). Figure 11 shows the difference between varieties with and without powdery mildew pressure at that site.
- Protein: Protein was evaluated for the various screened varieties. Typically, protein content ranges were narrow within each location, between 17% and 20% (Tables 1, 2, 3, 4, and 5).
- Growth habit: Peas can have an indeterminate or determinate growth habit. Anecdotal observations from our variety trials seemed to indicate that the longer flowering period of indeterminate varieties is associated with higher yields in our region. An indeterminate variety can compensate for periods of stress from high heat during pod and seed development due to its extended flowering period, which is the likely reason for improved yield.
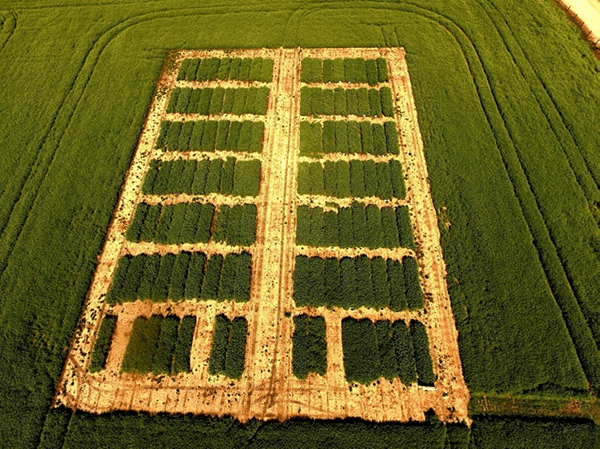
Figure 10. Aerial image of the variety test in Dillon County, SC, in 2018
Photo courtesy of Photosyntec
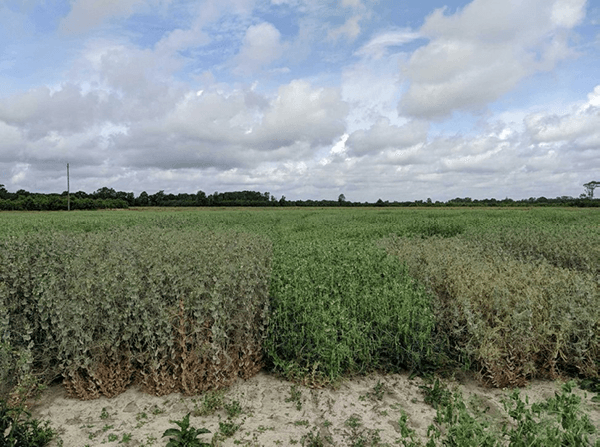
Figure 11. Varietal differences in resistance to powdery mildew at the Dillon County, SC, variety test site in 2018.
Pest Management
Disease is probably the largest pest management challenge for pea production in our region. Peas are susceptible to a range of soilborne and foliar diseases. Producers in our region have encountered a variety of seedling diseases, especially on poorly drained fields. Powdery mildew has been frequently encountered here (Figure 12), but this disease can be effectively managed through variety selection or foliar fungicide applications.
Herbicide options are limited for pea production in North Carolina; however, most growers apply a pre-emergent herbicide at planting. Applying post-emergent herbicide is unnecessary if peas are planted in narrow rows as agronomically recommended; peas planted in this manner can typically compete with weeds later in the season. An advantage of the pea planting window is that an herbicide burndown application prior to planting will often kill the first flush of winter weeds.
Several insects can impact pea production. Aphids were the pest most prevalently encountered by our growers, in numbers that exceeded the recommended thresholds for cost-effective insecticide applications in other U.S. regions (Figure 13).
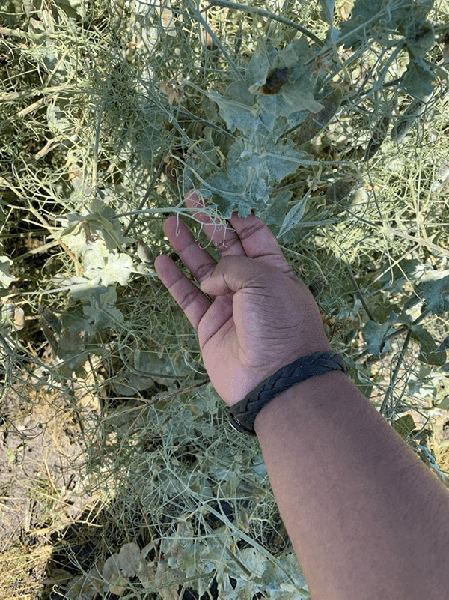
Figure 12. Powdery mildew pressure on a pea variety.
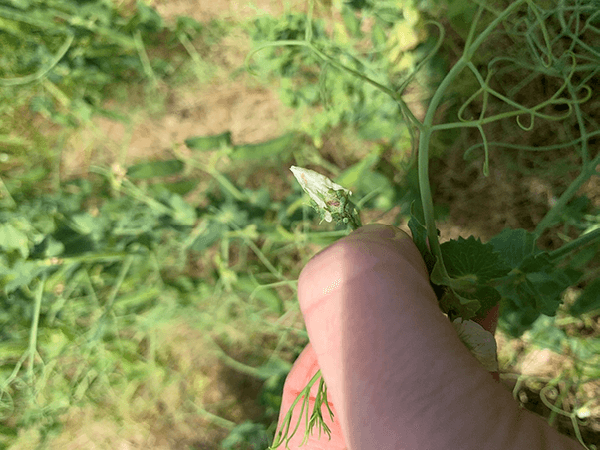
Figure 13. Aphid pressure on a pea flower.
Lodging
Peas can reach considerable height (Figure 14), which can lead to lodging. Lodging of the crop prior to harvest is a challenge in pea production (Figure 15). Lodging declined when planting was delayed (presumably due to more vegetative biomass at earlier planting dates), with lodging >15% with December and January planted peas and <5% with February and March planted peas. Lodging increased to >15% at seeding rates higher than 300,000 seeds/A. Growers in our region have added lifters to their combines to aid in harvesting lodged peas (Figure 16), but we hope that lodging can eventually be minimized through improved variety selection.
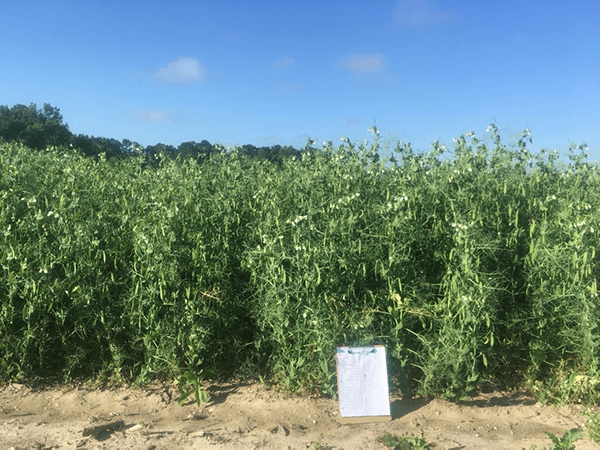
Figure 14. Peas plots on the North Carolina/South Carolina border exceeding 4 feet in height.
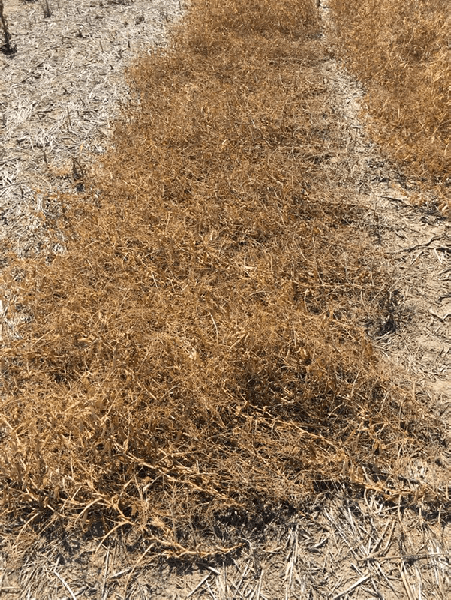
Figure 15. Pea plot lodged at harvest.
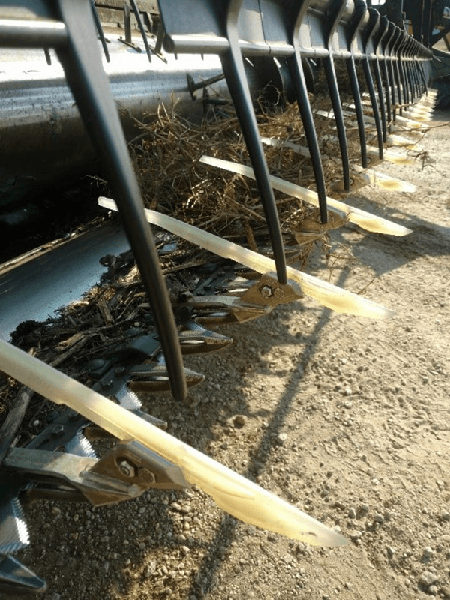
Figure 16. Lifters added to a combine header to aid in harvest of lodged peas.
Protein
Protein is the quality constituent in grain peas that we were primarily interested in, with protein content between 15% and 35% reported in the literature. In our agronomic and variety trials, we measured protein content between 17% and 20%. There were differing levels of protein across varieties in two of the five variety trial locations (Tables 1, 2, 3, 4, and 5). In our agronomic trials, neither planting date nor seeding rate impacted pea protein levels.
Existing and Potential Markets
There are a few existing markets and potential new markets for grain pea in our region. Recently, growers have sold to a grain-free (no corn, soybeans, or wheat) dog food processing plant in South Carolina. Chicken producers in Georgia are currently buying the peas for feed.
Peas have also been produced in our region for specialty food export markets in Asia. Peas are one of the primary ingredients in plant-based protein products, another potential market if processing facilities existed on the East Coast. North Carolina animal producers have shown interest in the potential of grain peas as a component of feed rations. If growers wish to target the dog food and food-grade markets, they will have certain production restraints.
Needed Research
There are several aspects of pea production in our region in which we have major deficits in knowledge needed to robustly advise growers on successful production. We know little about fertility management of this crop here. Our regional growers currently use fertility recommendations that were developed for the Northwest, where soil types can be vastly different. Research is also needed to determine appropriate management strategies for pea pests in our region. We also don’t know whether peas intensify disease or nematode problems in the subsequent soybean crop, though growers on the limited planted acreage in our region have not observed any ill effects; this topic should be addressed in future research.
Helpful Resources
Field Pea Production: North Dakota State University
Pea Diseases: North Dakota State University
For more information, contact:
Rachel Vann
NC State Soybean Extension Specialist
Cell: 919-616-6675
Email: rachel_vann@ncsu.edu
Acknowledgment
The research discussed in this publication was funded in part by Golden Leaf Foundation.
Tables
| Variety | Yield (bu/acre) | Test Weight (lbs/bu) | Stand (plants/acre) | Powdery Mildew# 5.15.2018 | Powdery Mildew# 5.23.2018 | Lodging at Harvest## | % Maturity 5.23.18 | % Protein |
|---|---|---|---|---|---|---|---|---|
| Korando | 75.1* | 61.5 | 305,249 | 0.0 | 0.0 | 1.7 | 58.3 | 18.5 |
| PSTSP33 | 73.0* | 61.3 | 289,392 | 0.0 | 0.0 | 4.3 | 43.3 | 19.0 |
| PS14100069 | 68.5* | 63.2 | 229,928 | 0.0 | 0.0 | 2.0 | 53.3 | 19.5 |
| DS Admiral | 67.7* | 62.1 | 277,499 | 0.0 | 0.7 | 4.7 | 56.6 | 19.4 |
| Amigo | 65.1* | 62.7 | 305,249 | 0.0 | 0.0 | 1.0 | 63.3 | 18.1 |
| Spider | 64.6* | 62.2 | 241,821 | 0.0 | 0.0 | 5.0 | 36.6 | 19.1 |
| PSTSP28 | 63.9* | 61.6 | 301,285 | 2.7 | 3.7 | 2.0 | 90.0 | 19.2 |
| PSTSP31 | 62.6* | 61.7 | 289,392 | 0.0 | 2.3 | 3.0 | 46.7 | 18.8 |
| Sunrise | 62.5* | 63.2 | 257,678 | 0.0 | 0.0 | 1.7 | 26.7 | 18.9 |
| PS07100925 | 61.9* | 60.0 | 325,071 | 0.0 | 0.0 | 5.0 | 26.7 | 19.1 |
| PS08101022 | 59.4 | 60.5 | 309,214 | 0.0 | 1.0 | 5.0 | 43.3 | 19.5 |
| PRO 793 | 58.3 | 57.7 | 325,071 | 3.7 | 3.3 | 4.3 | 91.7 | 19.5 |
| Nette | 58.2 | 66.5 | 277,499 | 3.3 | 4.0 | 1.0 | 86.7 | 18.6 |
| PS08101004 | 57.7 | 61.3 | 273,535 | 0.0 | 0.0 | 5.0 | 26.7 | 19.6 |
| MP 1970 | 56.6 | 64.0 | 107,036 | 0.0 | 0.0 | 1.7 | 23.3 | 19.1 |
| Poseidon | 55.4 | 63.0 | 293,357 | 2.7 | 4.3 | 1.7 | 83.3 | 18.9 |
| PS1514B0400 | 55.2 | 58.9 | 257,687 | 0.0 | 0.0 | 5.0 | 23.3 | 19.2 |
| PSTSP32 | 54.7 | 60.6 | 313,178 | 2.0 | 2.7 | 2.7 | 88.3 | 19.0 |
| Carousel | 54.3 | 61.4 | 376,606 | 1.7 | 1.0 | 3.3 | 53.3 | 18.7 |
| Universal | 54.1 | 60.7 | 294,886 | 2.7 | 2.0 | 3.3 | 90.0 | 18.9 |
| PSTSP30 | 53.9 | 57.1 | 269,571 | 3.0 | 3.0 | 1.7 | 90.0 | 18.7 |
| Durwood | 51.9 | 61.3 | 285,428 | 3.0 | 4.0 | 1.0 | 71.7 | 19.1 |
| Delta | 51.9 | 60.9 | 356,785 | 2.0 | 4.0 | 4.7 | 73.3 | 19.2 |
| PSTSP34 | 51.8 | 62.0 | 297,321 | 3.3 | 3.7 | 2.0 | 90.0 | 19.2 |
| PSTSP27 | 51.2 | 61.0 | 293,357 | 3.0 | 2.7 | 1.0 | 93.3 | 19.2 |
| Hyline | 50.5 | 62.5 | 285,428 | 0.0 | 0.0 | 3.7 | 40.0 | 19.2 |
| Bridger | 49.7 | 60.1 | 289,392 | 3.3 | 4.0 | 0.7 | 83.3 | 19.3 |
| Salamanca | 49.3 | 62.8 | 301,285 | 3.0 | 5.0 | 1.0 | 76.7 | 18.3 |
| ESO CC | 47.2 | 62.5 | 313,178 | 3.3 | 4.3 | 0.7 | 85.0 | 18.7 |
| PSTSP29 | 41.8 | 56.1 | 289,392 | 3.3 | 5.0 | 1.3 | 73.3 | 19.0 |
| Navarro | 39.1 | 61.3 | 241,821 | 3.7 | 4.0 | 3.3 | 86.7 | 19.4 |
| Gunner | 39.1 | 60.8 | 249,750 | 3.0 | 4.7 | 1.7 | 83.3 | 18.3 |
| PSTSP35 | 38.3 | 60.8 | 336,964 | 4.0 | 4.3 | 0.7 | 91.7 | 19.5 |
| ESO | 34.4 | 61.0 | 225,964 | 4.6 | 4.3 | 2.7 | 83.3 | 19.6 |
| LSD (0.05) | 14.8 | NS** | 78,042 | 1.1 | 1.7 | 2.0 | 20.2 | 1.3 |
Notes: Trial was planted 1/22/2018 and harvested 6/5/2018. Trial was planted at 300,000 live seed/acre assuming 90% germination. Trial was sprayed with 4 oz/acre Metribuzin on 1/23/2018. Trial was not sprayed with a fungicide. Trial was sprayed with an insecticide. Fertility was adjusted for P and K based on soil test reports.
* Yield not statistically different from the highest yielder (60 lbs/bushel). ↲
**NS = nonsignificant ↲
# Powdery mildew: 0 represents no symptomology, and 5 represents maximum symptomology. ↲
## Lodging: 0 represents no lodging, and 5 represents complete lodging. ↲
| Variety | Yield (bu/acre) | Test Weight (lbs/bu) | Stand (plants/acre) | % Maturity 5.16.18 | % Maturity 5.23.18 | % Protein |
|---|---|---|---|---|---|---|
| Korando | 35.2* | 62.7 | 309,214 | 78.0 | 95.0 | 19.5 |
| Salamanca | 30.7* | 65.3 | 391,707 | 33.7 | 94.0 | 19.7 |
| Hyline | 29.4* | 65.4 | 320,350 | 21.3 | 81.4 | 19.4 |
| Poseidon | 29.2* | 65.5 | 278,275 | 13.7 | 90.0 | 18.6 |
| PSTSP28 | 28.7* | 64.4 | 290,618 | 26.3 | 96.4 | 19.3 |
| PSTSP27 | 28.4* | 63.9 | 373,867 | 68.8 | 94.0 | 19.1 |
| PSTSP33 | 28.2* | 63.4 | 336,964 | 56.7 | 93.3 | 18.9 |
| Sunrise | 27.6* | 64.1 | 340,928 | 43.3 | 93.3 | 19.6 |
| PSTSP30 | 26.0 | 63.9 | 317,142 | 58.3 | 95.0 | 19.6 |
| PSTSP31 | 25.4 | 63.6 | 367,921 | 13.8 | 81.4 | 19.3 |
| PSTSP34 | 24.6 | 64.9 | 260,886 | 53.8 | 96.4 | 19.5 |
| Durwood | 24.2 | 64.5 | 344,892 | 60.0 | 95.0 | 19.1 |
| ESO | 24.0 | 65.2 | 428,142 | 70.0 | 86.7 | 19.1 |
| PSTSP29 | 22.9 | 64.3 | 284,671 | 8.7 | 81.4 | 19.0 |
| Bridger | 22.8 | 64.0 | 243,046 | 38.8 | 86.4 | 18.3 |
| PSTSP35 | 22.3 | 62.8 | 367,921 | 23.8 | 86.4 | 17.8 |
| Spider | 21.6 | 63.5 | 289,392 | 25.0 | 86.7 | 19.1 |
| ESO CC | 21.4 | 64.1 | 289,392 | 40.0 | 85.0 | 19.8 |
| PS14100069 | 21.3 | 63.9 | 261,642 | 30.0 | 85.0 | 19.9 |
| PS1514B0400 | 21.0 | 61.1 | 317,142 | 20.0 | 76.7 | 19.7 |
| DS Admiral | 20.4 | 62.9 | 245,785 | 53.3 | 93.3 | 19.6 |
| Gunner | 19.5 | 64.6 | 237,100 | 13.8 | 61.4 | 19.6 |
| Nette | 19.4 | 63.6 | 321,107 | 36.7 | 85.0 | 19.7 |
| Universal | 19.2 | 65.2 | 229,928 | 60.0 | 93.3 | 18.3 |
| PS07100925 | 19.1 | 63.3 | 257,678 | 33.3 | 76.7 | 19.9 |
| Delta | 19.0 | 59.7 | 233,892 | 45.0 | 91.7 | 19.6 |
| Amigo | 17.8 | 62.8 | 146,678 | 11.7 | 76.7 | 19.7 |
| Carousel | 17.3 | 64.4 | 194,582 | 17.0 | 82.5 | 18.8 |
| PS08101022 | 17.1 | 63.0 | 210,107 | 11.7 | 88.3 | 18.9 |
| PS08101004 | 16.0 | 63.3 | 202,178 | 23.3 | 80.0 | 18.5 |
| PSTSP32 | 15.4 | 63.6 | 344,135 | 23.8 | 71.4 | 19.3 |
| PRO 793 | 11.8 | 63.0 | 67,393 | 15.0 | 75.0 | 18.8 |
| MP 1970 | 11.3 | 62.8 | 112,225 | 6.3 | 56.4 | 20.0 |
| LSD (0.05) | 7.7 | NS** | 106,694 | 26.0 | 17.0 | 1.5 |
Notes: Trial was planted 1/25/2018 and harvested 6/1/2018. Trial was planted at 300,000 live seed/acre assuming 90% germination. Trial was sprayed with 4 oz/acre Metribuzin on 1/26/2018. Trial was not sprayed with a fungicide or insecticide. Fertility was adjusted for P and K based on soil test reports. Powdery mildew symptomology was not present at this location. Peas were short at this location, and there was no lodging. We ran out of seed to replicate Navarro in this environment and therefore this variety has been excluded from the analysis.
* Yield not statistically different from the highest yielder (60 lbs/bushel). ↲
**NS = nonsignificant ↲
| Variety | Yield (bu/acre) | Test Weight (lbs/bu) | Stand (plants/acre) | % Lodging at Harvest** | % Protein |
|---|---|---|---|---|---|
| PSTSP33 | 30.8* | 61.9 | 388,499 | 55.0 | 18.3 |
| Sunrise | 30.2* | 62.1 | 388,499 | 0.0 | 18.4 |
| Korando | 29.4* | 61.9 | 376,606 | 63.3 | 18.8 |
| Amigo | 29.3* | 60.8 | 321,107 | 0.0 | 18.3 |
| Hyline | 28.9* | 62.2 | 335,671 | 90.7 | 19.0 |
| PS07100925 | 28.3* | 61.4 | 273,535 | 70.0 | 19.3 |
| ESO | 27.9* | 64.0 | 317,142 | 0.0 | 18.8 |
| PSTSP34 | 27.8* | 62.6 | 344,892 | 0.0 | 18.7 |
| Durwood | 27.7* | 63.9 | 309,214 | 0.0 | 18.7 |
| PS14100069 | 27.5* | 62.8 | 309,214 | 0.0 | 17.9 |
| Carousel | 27.3* | 63.8 | 340,928 | 0.0 | 19.3 |
| Universal | 27.3* | 62.4 | 372,642 | 0.0 | 18.3 |
| Delta | 26.9* | 60.7 | 368,678 | 33.3 | 18.5 |
| Nette | 26.5* | 63.7 | 352,821 | 0.0 | 18.8 |
| PSTSP29 | 26.5* | 63.9 | 364,714 | 0.0 | 18.7 |
| Poseidon | 26.5* | 63.7 | 356,785 | 26.7 | 19.6 |
| PRO 793 | 25.8* | 63.1 | 309,214 | 0.0 | 19.7 |
| Spider | 25.7* | 64.8 | 313,178 | 26.7 | 18.2 |
| DS Admiral | 25.5* | 63.1 | 352,821 | 33.3 | 18.9 |
| PSTSP27 | 25.5* | 62.0 | 395,135 | 0.0 | 19.3 |
| PSTSP30 | 25.2* | 62.6 | 404,356 | 0.0 | 18.3 |
| Salamanca | 24.5* | 63.7 | 336,964 | 20.0 | 18.7 |
| PSTSP28 | 24.3* | 62.8 | 360,794 | 16.7 | 18.9 |
| PSTSP31 | 23.5* | 62.1 | 313,178 | 0.0 | 19.1 |
| ESO CC | 23.5* | 63.8 | 309,214 | 43.3 | 18.6 |
| Navarro | 23.5* | 61.2 | 285,428 | 23.3 | 19.0 |
| PSTSP35 | 23.3* | 63.3 | 388,499 | 0.0 | 18.4 |
| PSTSP32 | 23.3* | 64.5 | 348,857 | 0.0 | 19.7 |
| PS1514B0400 | 23.3* | 62.7 | 285,428 | 96.7 | 19.3 |
| Gunner | 20.7* | 63.8 | 228,635 | 13.2 | 19.0 |
| PS08101022 | 19.7 | 62.0 | 329,035 | 60.0 | 19.1 |
| Bridger | 18.2 | 62.4 | 317,142 | 20.0 | 18.6 |
| PS08101004 | 17.2 | 62.2 | 412,285 | 60.0 | 18.0 |
| MP 1970 | 14.3 | 63.9 | 95,143 | 0.0 | 17.6 |
| LSD (0.05) | 11.3 | 2.3 | 81,945 | 52 | 1.1 |
Notes: Trial was planted 2/23/2018 and harvested 6/8/2018. Trial was planted at 300,000 live seed/acre assuming 90% germination. Trial was not sprayed with an herbicide, insecticide, or fungicide. There was very minimal weed pressure. Fertility was adjusted for P and K based on soil test reports. Powdery mildew symptomology was not present at this location.
* Yield not statistically different from the highest yielder (60 lbs/bushel). ↲
** Lodging: 0 represents no lodging, and 100 represents complete lodging. ↲
| Variety | Company | Yield (bu/A) | Test Weight (lbs/bu) | Stand (plants/acre) | Lodging at Harvest*** | % Protein |
|---|---|---|---|---|---|---|
| PSTSP28 | Photosyntech | 64.1* | 56.2 | 289,506 | 3.2 | 19.3 |
| PSTSPS38 | Photosyntech | 54.7* | 62.5 | 304,518 | 2.4 | 19.8 |
| Pro143-6230 | ProGene | 52.9* | 52.6 | 373,142 | 3.4 | 19.4 |
| Hampton | USDA-ARS | 46.0 | 52.6 | 345,263 | 3.8 | - |
| PSTSPS36 | Photosyntech | 45.0 | 49.3 | 323,818 | 1.6 | 19.2 |
| PSTSPS37 | Photosyntech | 44.4 | 52.3 | 340,974 | 1.6 | 20.0 |
| Jetset | Meridian | 42.4 | 60.5 | 353,841 | 1.2 | 19.8 |
| AAC Carver | Meridian | 41.8 | 51.1 | 335,541 | 1.2 | 19.0 |
| PSTSP31 | Photosyntech | 41.8 | 63.0 | 317,385 | 1.2 | 19.6 |
| PS071000925 | USDA-ARS | 38.7 | 58.5 | 283,073 | 3.6 | 19.8 |
| AC Agassiz | Meridian | 38.1 | 59.6 | 310,951 | 1.0 | 19.4 |
| CDC Greenwater | Meridian | 37.9 | 46.0 | 304,518 | 0.0 | 19.5 |
| Korando | Pulse USA | 37.6 | 60.0 | 319,529 | 2.8 | 19.7 |
| Spider | Great Northern Ag | 37.3 | 60.4 | 293,795 | 0.4 | 19.9 |
| LG Sunrise | Pulse USA | 37.0 | 60.6 | 302,373 | 2.0 | - |
| LG Amigo | Pulse USA | 36.8 | 62.2 | 280,928 | 0.8 | 20.0 |
| Hyline | Great Northern Ag | 36.8 | 51.5 | 319,529 | 1.8 | 19.9 |
| CDC Inca | Meridian | 36.0 | 56.5 | 330,252 | 1.0 | 19.6 |
| Durwood | Pulse USA | 35.9 | 58.3 | 300,229 | 1.0 | 19.3 |
| PS0810001022 | USDA-ARS | 35.7 | 54.9 | 289,506 | 4.0 | 20.0 |
| PSTSP33 | Photosyntech | 35.1 | 58.7 | 330,252 | 2.2 | 19.2 |
| PSTSP35 | Photosyntech | 33.9 | 61.8 | 315,240 | 1.0 | 19.6 |
| Salamanca | Great Northern Ag | 33.7 | 63.5 | 313,096 | 1.4 | 20.1 |
| PSTSP27 | Photosyntech | 33.4 | 47.0 | 295,013 | 0.0 | 19.9 |
| AAC Profit | Great Northern Ag | 32.2 | 57.2 | 326,200 | 2.1 | 19.7 |
| PSTSP32 | Photosyntech | 29.9 | 54.1 | 302,373 | 1.8 | 19.5 |
| Nette | Pulse USA | 27.9 | 56.1 | 298,084 | 0.6 | 19.7 |
| PSTSP34 | Photosyntech | 27.9 | 43.7 | 291,477 | 1.3 | 19.8 |
| Pro122-7160 | ProGene | 25.2 | 57.6 | 343,119 | 0.0 | - |
| ESO | Photosyntech | 21.4 | 61.0 | 274,495 | 1.6 | 19.5 |
| Keystone | ProGene | 18.1 | 48.7 | 295,940 | 1.8 | 19.9 |
| Pro124-7146 | ProGene | 4.7 | 49.8 | 319,529 | 0.0 | 19.5 |
| LSD (0.1) | - | 14.7 | NS** | NS** | 1.1 | 0.8 |
Notes: Trial was planted 1/18/2019 and harvested 5/24/2019. Trial was planted at 300,000 live seed/acre, accounting for provided germination on 7.5-inch row spacing. Trial was sprayed with a PRE herbicide on 1/19/2019 and desiccated on 5/20/2019. Trial was sprayed with a fungicide and insecticide on 4/23/2019. Fertility was adjusted for P and K based on soil test reports.
* Yield not statistically different from the highest yielder (60 lbs/bu). ↲
** NS = nonsignificant ↲
*** Lodging: 0 represents no lodging, and 5 represents complete lodging. ↲
| Variety | Company | Yield (bu/A) | Test Weight (lbs/bu) | Stand (plants/acre) | Lodging at Harvest*** | % Protein |
|---|---|---|---|---|---|---|
| PSTSP35 | Photosyntech | 36.1* | 59.7 | 283,265 | 0.0 | 18.4 |
| Jetset | Meridian | 35.3* | 53.2 | 285,666 | 0.0 | 18.8 |
| PSTSPS36 | Photosyntech | 33.4* | 63.2 | 295,268 | 0.0 | 18.0 |
| AAC Carver | Meridian | 32.4* | 57.4 | 324,074 | 0.0 | 18.3 |
| PSTSP27 | Photosyntech | 30.4* | 54.1 | 283,265 | 0.0 | 18.4 |
| PSTSP33 | Photosyntech | 29.3* | 57.8 | 295,268 | 0.0 | 18.1 |
| PSTSP34 | Photosyntech | 29.3* | 52.9 | 292,867 | 0.0 | 19.1 |
| LG Amigo | Pulse USA | 27.1* | 59.4 | 220,851 | 0.0 | 18.3 |
| PSTSPS38 | Photosyntech | 28.9* | 57.5 | 307,271 | 0.0 | 18.7 |
| AC Agassiz | Meridian | 26.6 | 56.1 | 268,862 | 0.0 | 17.4 |
| CDC Inca | Meridian | 26.5 | 59.9 | 304,870 | 0.0 | 17.9 |
| Spider | Great Northern Ag | 26.0 | 53.9 | 266,461 | 0.0 | 18.4 |
| PSTSP32 | Photosyntech | 25.9 | 52.7 | 345,679 | 0.2 | 19.2 |
| CDC Greenwater | Meridian | 25.8 | 58.6 | 312,072 | 0.0 | 18.3 |
| Nette | Pulse USA | 25.5 | 60.3 | 300,069 | 0.0 | 20.1 |
| Durwood | Pulse USA | 25.5 | 55.5 | 249,657 | 0.0 | 18.6 |
| PSTSP31 | Photosyntech | 25.2 | 55.4 | 307,271 | 0.2 | 19.5 |
| PS0810001022 | USDA-ARS | 25.0 | 55.6 | 283,265 | 0.0 | 18.8 |
| Korando | Pulse USA | 24.9 | 51.8 | 314,472 | 0.0 | 19.4 |
| LG Sunrise | Pulse USA | 24.2 | 50.5 | 333,677 | 0.0 | 18.5 |
| Hampton | USDA-ARS | 23.7 | 51.0 | 273,663 | 0.0 | 19.7 |
| PSTSP28 | Photosyntech | 23.7 | 53.9 | 321,674 | 0.8 | 18.9 |
| PSTSPS37 | Photosyntech | 22.3 | 53.3 | 285,666 | 0.0 | 18.7 |
| Hyline | Great Northern Ag | 21.6 | 55.1 | 290,467 | 1.8 | 18.6 |
| AAC Profit | Great Northern Ag | 21.6 | 57.2 | 247,257 | 0.0 | 18.0 |
| Salamanca | Great Northern Ag | 20.7 | 52.5 | 316,873 | 0.0 | 18.2 |
| PS071000925 | USDA-ARS | 20.0 | 51.0 | 189,644 | 0.2 | 18.3 |
| ESO | Photosyntech | 19.3 | 59.3 | 259,260 | 0.0 | 18.8 |
| Pro143-6230 | ProGene | 16.5 | 54.1 | 292,867 | 0.0 | 19.0 |
| Keystone | ProGene | 11.0 | 50.2 | 218,450 | 0.4 | 17.7 |
| Pro124-7146 | ProGene | 10.5 | 52.0 | 228,052 | 0.0 | 17.7 |
| Pro122-7160 | ProGene | 10.0 | 52.7 | 297,668 | 0.0 | 18.4 |
| LSD (0.1) | - | 7.7 | NS** | 41,240 | 0.6 | 0.9 |
Notes: Trial was planted 1/10/2019 and harvested 5/29/2019. Trial was planted at 300,000 live seed/acre accounting for provided germination on 6.7-inch row spacing. Trial was sprayed with a fungicide and insecticide on 5/3/2019. Fertility was adjusted for P and K based on soil test reports.
* Yield not statistically different from the highest yielder (60 lbs/bu). ↲
** NS = nonsignificant ↲
*** Lodging: 0 represents no lodging, and 5 represents complete lodging. ↲
Publication date: Sept. 17, 2020
Reviewed/Revised: Aug. 1, 2025
AG-885
The use of brand names in this publication does not imply endorsement by NC State University or N.C. A&T State University of the products or services named nor discrimination against similar products or services not mentioned.
N.C. Cooperative Extension prohibits discrimination and harassment regardless of age, color, disability, family and marital status, gender identity, national origin, political beliefs, race, religion, sex (including pregnancy), sexual orientation and veteran status.