
What Is a High Density Orchard?
From a historical perspective, a high density orchard is defined as any orchard with more than 150-180 trees per acre. However, many highly productive commercial orchards today have 150-180 trees per acre and higher density could be anything over 180 trees per acre. For the purposes of this publication, there are several characteristics in addition to tree number that are included in a high density orchard system. Besides having an increased number of trees per acre, a high density orchard must come into bearing within 2-3 years after planting. To achieve this early production, it is essential to use a precocious dwarfing rootstock. Although it is possible to restrict the growth of trees on semi-dwarf rootstocks, they do not have the genetic capacity for early bearing.
Consistent early fruit production is essential to offset the increased establishment costs. It is also very costly to hold trees on more vigorous rootstocks in an allotted space required for a high density orchard. To maximize the production of a high density orchard, it is also necessary to modify the training system and training and pruning techniques from traditional methods. Since trees will be bearing fruit early, a permanent tree support system is also required.
It is essential to crop trees very early in the life of the orchard to offset the costs of establishment and to aid in managing vegetative growth. Early production is directly related to the number of trees planted per acre. The greater the tree number, the greater the light interception by that acre of land early in the life of the orchard. To the extreme, there are orchards planted in Europe and the Pacific Northwest with 5,000-9,000 trees per acre. Although, these orchards may be very productive early in their life, it is doubtful that they would be profitable, or manageable, under economic conditions in the Southeast. So the next question that must be addressed is “What is the most profitable tree density for a high density orchard?” Research conducted at Cornell University’s Geneva Research Station in New York found that for the first seven years of an orchard, the yield increased with tree density, independent of the size-controlled rootstock used. The most dwarfing rootstocks produced significantly larger yields in the third year. As tree density increased, profitability increased up to approximately 1,000 trees per acre. Preliminary studies in North Carolina indicate that tree densities of 450-600 trees per acre are most profitable for the Southeast given the climate, soils, and markets.
Advantages and Disadvantages of High Density Planting Systems
The first question that must be asked when planting a high density orchard is “Why?” The first answer is increased early production. In today’s markets, many “new” cultivars are selling for 4-5 times the price of standard cultivars. Having orchards that can be established and cropped significantly in the first 2-3 years is a very good reason to consider high density systems. Because of the early production and higher returns many higher density orchards are breaking even in 6-7 years compared to 10-12 years for traditional systems.
Efficient use of labor to harvest and prune from the ground or from a short stool is another advantage of using a high density system. It is difficult to find employees who are willing to climb ladders to work in traditional orchards in today’s market, not to mention the liability that must be assumed for those employees. Another advantage is the potential to have higher quality fruit for a longer period of time by maintaining light interception in the smaller trees of higher density orchards. Pesticide application efficiency may be much higher in higher density orchards as well.
Although there are many advantages to high density orchards, the disadvantages must also be considered. The primary disadvantage is the high cost of orchard establishment. As a rule, a high density orchard will require approximately $10,000 per acre for orchard establishment through the second year. (Detailed economic information will be discussed in the Economics of High Density Apple Production section.)
High density orchards are also unforgiving in terms of lack of management. High density systems require more training and minimal pruning during the first 6 years than traditional systems, especially during the summer. A lack of attention in the early life of this type of orchard creates a very high probability that the orchard will never be profitable given the high costs of establishment. Another potential disadvantage involves re-educating orchard managers and workers in the training and pruning techniques required for higher density orchards.
Site Selection
Site selection is one of the most important managerial decisions that an orchard manager will make over the life of the orchard. Errors made here will be reflected in reduced orchard performance, yield, and profitability for the life of the orchard. In some cases, orchard longevity will be reduced. Consider the following points when selecting an orchard site:
- Type of market
- Nearness to population.
- Accessibility.
- Condition of roads leading to your market.
- Elevation in relation to the surrounding land – Cold air, frosts, and fogs settle in low areas, increasing the potential for frost and disease problems. For each 100-foot rise in elevation, expect a 5-10°F increase in spring night temperatures during a radiation frost/freeze event. The ideal site is an area of rolling land. Plant on slopes that are not too steep to be safely traversed with equipment. How far down a slope to set depends on the width of the valley at the base of the slope and on how well air can drain out of the valley to lower elevations. The tops of hills are not necessarily good sites as orchards located there are more vulnerable to advective freezes than the sides of hills. Also, soils on the tops of hills are frequently shallow due to erosion.
- Direction of slope
- South facing – Increased chances of southwest trunk injury during winter, earlier blooming.
- North facing – Delayed bloom.
- East facing – Reduced disease potential as the morning sun dries off the foliage early.
- West facing – Intermediate between north and south.
- Soils
- Minimum rooting depth of 4-5 feet is desirable. (Trees on shallow soils will be more affected by drought and by root injury during extended severe cold spells.)
- Good internal and surface water drainage characteristics. Apple trees will not tolerate waterlogged soils for extended periods during the growing season.
- Soil pH and fertility can be adjusted and are not major considerations; however, highly fertile soils can cause excessive tree vigor and are, therefore, not desirable.
- Water availability – A reliable, close, clean water supply is required for irrigation, spraying, and possibly overhead frost protection and evaporative cooling.
Site Preparation
Start preparing the site at least 6 months to 1 year before planting. If much work needs to be done to properly prepare the site, begin 2-3 years in advance of planting. Make a considerable effort to create an ideal soil environment before planting since it is practically impossible to correct certain site problems once the trees are in the ground. Address the following points when preparing the site:
- Test soil for pH and fertility. Sample at two depths, 1-8 inches and 8-16 inches. Fertilize and lime based on the results of the 8- to 16-inch sample.
- Eliminate perennial and noxious weeds in and around the orchard site.
- Remove obstructions to air drainage from the orchard site.
- Consider drainage of wet areas in the site. In many soils, tile lines are very effective in eliminating wet areas that would cause problems in establishing and maintaining the orchard. Another option would be to plant on raised beds or berms within the tree row.
- Subsoil the site parallel and perpendicular to proposed tree rows where possible.
- Plow and seed the field or, where a good sod already exists, locate proposed tree rows and kill vegetation in the tree rows in the fall prior to planting.
- Fumigate if needed, especially on replant sites.
In a replant site, remove the trees and as many roots as possible. Then plow and level the soil before taking soil samples to determine the need for lime and nutrients.
A good soil management program should do the following:
- Provide a good environment for extensive root development.
- Provide for a favorable moisture supply throughout the growing season.
- Minimize or prevent soil erosion.
- Provide a firm surface in row middles for machinery operation.
- Minimize conditions limiting good insect, disease, and rodent management.
- Favor conditions for beneficial insects and pollenizers.
- Supply needed nutrients.
Is Fumigation Necessary?
Consider fumigation if nematodes or replant disease is a confirmed problem. A nematode assay should be conducted on a soil sample collected for this purpose. A fairly easy way to determine if problems will arise is to conduct a bioassay on a soil sample from the orchard site. To conduct a bioassay, collect a representative soil sample after the soil pH and nutritional needs have been corrected (per NCDA&CS soil test results). Put one-half of the soil on a flat baking sheet and put it in a 180°F oven for 30 minutes; do nothing to the other half. After the soil has cooled, keep the heated and unheated soil separate and put both samples into several small pots, then plant apple seeds into each pot. Make sure that the apples from which the seeds were removed had been in cold storage for at least 3 months so that the seeds are stratified and ready to germinate. After seedling growth is approximately 10-12 inches tall, compare the seedlings in the heated soil to those in the unheated soil. If growth of the seedlings in the heated soil is twice that of those in the unheated soil, fumigation is recommended.
Fertility Management for High Density Orchards
Nutritional disorders generally cause a reduction in yield, fruit quality, or both before visible symptoms develop. An effective fertility management program involves preparing the site before planting (as previously discussed) and monitoring the nutritional status of the orchard throughout its life to detect nutrient deficiencies, toxicities, and imbalances before they become yield- or quality-limiting. It should include all of the following:
- Test soil
- Preplant.
- Postplant – Sample the upper 8 inches of soil at regular intervals to check soil pH. Take samples in the area over which fertilizer is applied.
- Test tissue
- Do routine sampling on orchards to detect trends in the nutrient content of the trees. Graphing the results on a year-to-year basis makes it easier to see if nutrient levels are changing.
- Troubleshoot – Sample suspected problem areas separate from routine areas to help confirm or deny nutritional disorders. Collect separate samples from affected trees and unaffected trees of the same age, variety, and rootstock for comparison.
- Keep good records on yield and quality — Be sure to include information on the amount and analysis of fertilizer applications.
- Observe – Leaf color and the amount of vegetative growth (10-12 inches minimum for nonspur cultivars and 6-10 inches for spur-type cultivars) may be indicators of potential problems. If you observe differences, be sure to mark problem trees to enable you to find them when you come back to take leaf samples.
Rootstocks for High Density Orchards
High density orchards require trees propagated on dwarfing rootstocks. Presently, only three commercially available rootstock groups or types can be recommended to develop a high density orchard system. Having small trees is not enough; the trees must bear fruit early in the life of the orchard. The rootstocks that are commercially available to fit this niche are M.9, Bud.9, and M.26. No perfect rootstock exists, and the limitations and strengths of each rootstock must be evaluated to select the rootstock that performs best in a specific situation. Table 1 lists the major advantages and disadvantages of these rootstocks. Trees propagated on these rootstocks for high density systems need to be supported and irrigation is strongly encouraged. The Mark rootstock is no longer recommended because of decreased availability and drought sensitivity. Mark performed well in the Southeast when irrigated during the growing season beginning at orchard establishment.
Although only a few rootstocks are available for high density planting systems at present, several promising selections are under evaluation. The breeding program at Cornell University’s Geneva Research Station has several selections that are in the advanced stages of evaluation and will be available in limited quantities in the next several years. The primary benefit of the rootstocks from New York is resistance to fire blight. However, advanced evaluation is still needed before large-scale planting is recommended.
|
Rootstock |
Advantages |
Disadvantages |
|
Malling9 (M.9)* |
|
|
|
Budagovsky9 (Bud.9) |
|
|
|
Malling26 (M.26) |
|
|
* Many clones of M.9 are currently being sold through nurseries. However, the differences in tree growth and productivity (in the range of 10%) are relatively minor in the orchard. The greatest difference in the rootstocks is how well they can be propagated in the nursery
What Training System Should Be Used?
Many different training systems are being promoted for high density orchard management. The question frequently asked is “What system should I use?” Table 2 illustrates the four major systems currently in use, including the central leader, vertical axis, Hybrid Tree Cone (HYTEC), and the slender spindle. In the table, the diagram of each tree type is accompanied by a list of the characteristics of each system and how it is maintained. Note that each tree has a central leader and all are modifications of the central leader. The major differences between the systems are tree height, density (spacing), and the way the leader is managed. Many trellis systems, such as the Ebro, Lincoln canopy, Y-trellis, vertical trellis, etc., are being evaluated as well.
The training system does not significantly affect productivity in the first three years if the trees are not pruned heavily. Tree density, or more accurately light interception, is the factor that affects early production. The training system is a greater factor later in the life of the orchard when the system may affect light distribution within the tree canopy. Mature orchard systems that have at least 70% light interception have greater yields than systems that intercept less light. Light interception in trees is frequently reduced by allowing branches in the top of the tree to shade lower branches. This shading results from a lack of limb removal, or improper limb placement or orientation. Light interception is also related to the ratio of the tree height to clear alley width. In general, tree height should not be more than twice the clear alley width to maximize light interception.
However, for the Southeast no specific training system is recommended, rather an approach to developing a tree that has specific characteristics. Dr. Don Heinicke, Washington state researcher and grower, has proposed a system of high density orchard management that is referred to as Alert Grower Response. In this approach the grower is aware of how trees are growing and manages the trees to maximize light interception and therefore productivity.
The characteristics of the recommended tree type in the Southeast are those of a slender spindle-type tree. The tree will look similar to the slender spindle tree except taller. It is 8-10 feet tall and trees are spaced 5-7 feet apart within rows with rows spaced 12-16 feet apart. The leader needs to be managed to encourage lateral branching either by growth regulator application, bagging, bending, heading, leader renewal, or notching, etc., which will be discussed later in the Leader Management Techniques section of this publication. Research in North Carolina has found that vertical axis trees, where the leader is not manipulated, do not have continuous branching along the leader, which is required for a productive and profitable tree. These trees have lower branches, an area of 2-4 feet of blind wood, or unbranched leader, and branches at the top of the tree. Therefore, the leader must be manipulated in some manner to ensure continuous branching.
All lateral branches with wide crotch angles should be maintained for the first 3-5 years to maximize early fruit production. A lower whorl of scaffolds should be identified as permanent and others should be removed as shading becomes a problem. There may also be a second semi-permanent whorl approximately 12 inches above the first that should also be identified and removed as shading becomes a problem. Permanent whorls are maintained in the lower portion of the tree as there is some concern about a lack of vigor and light in that area of the tree. The permanent whorls should be spread out to approximately 85° from vertical to encourage lateral branch- ing and floral initiation. Above the second whorl of scaffolds all branches should be renewed every 3-4 years. These lateral branches will be cropped for several years. As the diameter of the lateral approaches 50% of the leader’s diameter, the lateral is removed by a cut at a downward angle, referred to as a Dutch cut (Figure 1). This cut allows latent buds on the bottom of the stub to grow, giving rise to lateral limbs with wide crotch angles.
It is also imperative to maintain the conical shape of the tree to allow optimal light distribution within the canopy. However, in the first 3-4 years there should be minimal pruning done, using tree training techniques such as bending, spreading, etc. approximately every six weeks during the growing season.
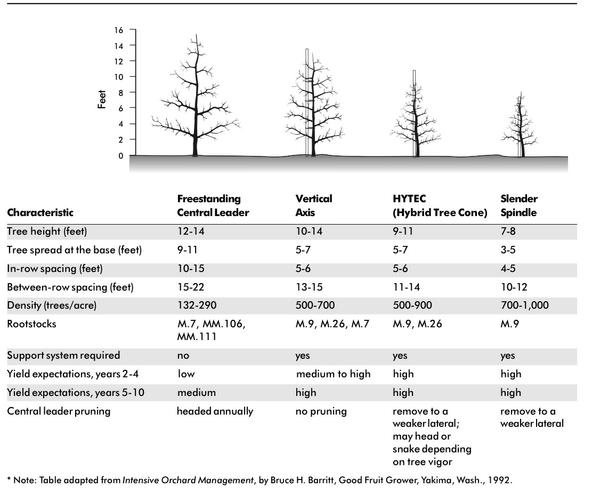
Table 2. Characteristics of High Density Training Systems Compared to a Central Leader Conventional System.
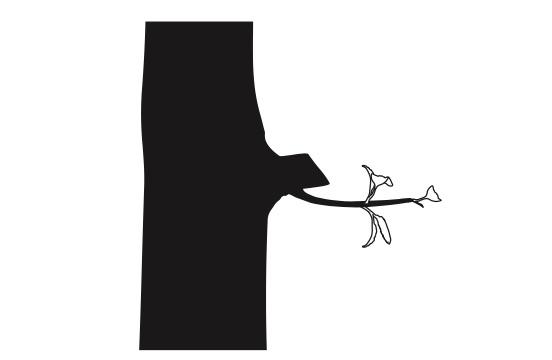
Figure 1. A Dutch cut is a technique used to cut lateral branches to an angled stub, allowing latent buds at the bottom to grow. (Note wide crotch angle.).
High Density Training Techniques for the Southeast
Characteristics of and requirements for slender spindle–type trees follow:
- Pyramid-shaped tree like the central leader.
- Height controlled at 8-10 feet.
- Maximum width of tree limb spread 6-7 feet.
- Lateral branches continuously along the central leader.
- Summer training and pruning to control tree vigor (primarily in the first 4 years).
- One or two permanent whorls of lateral limbs can be established in the lower portion of the tree, providing limb diameter doesn’t compete with leader diameter.
- Leader management for profuse lateral branching is important to generate fruiting wood production and to increase the number of growing points to control vigor.
- Lateral shoot positioning is important to control vigor and encourage fruiting. This positioning is also necessary to stimulate secondary branching.
- Non-branched areas of the leader are areas of lost fruit production. Thus, successful leader management is directly related to early and total fruit production potential.
- Trees must have a permanent support system for the total height of the trees to attach the leader to every 15-18 inches. This support holds trees stable in soil and supports the fruit load. If tree vigor is limited by inadequate soil moisture or ground cover competition, tree vigor and growth will be reduced and tree training techniques will not be as effective.
Tree establishment
Tree training for high density orchards begins at planting. If an unbranched or whip tree is purchased, head the tree at 30 to 34 inches. If a well-branched (feathered) tree is planted, remove all branches within 24 inches of the ground and head the leader 10 inches above the top (usable) lateral branch. Feathered trees will increase early fruit production.
Once 3-4 inches of new growth has occurred, select one vigorous terminal shoot as the new leader and remove all other upright shoots that originate within 3-4 inches of the base of the selected new leader.
On more vigorous trees (larger caliper, well-branched trees with a good root system intact at planting), the bagging techniques described below can be used at planting on 18-24 inches of unbranched leader.
Leader Management Techniques
Bagging (Figure 2) is done by placing a polyethylene sleeve (usually 3 mil) over the previous year’s unbranched growth. Bagging is only effective on 30-32 inches of leader, thus longer leaders should be cut off to 32 inches. Bags should be applied 4-6 weeks before anticipated bud break (early- to mid-February). The ends of the poly sleeve must be closed tightly with clothespins or tape, etc. These sleeves must remain closed and in place until new lateral growth is 1-2 inches long (usually about bloom time). Immediately upon bag removal apply a foliar application of 250 ppm of Promalin (1 pint per 10 gallons of water plus surfactant) and an anti-desiccant to the previously bagged portion.
Snaking (Figure 3) is done during the growing season by bending each 18-inch section of new leader extension growth over to a 45° angle and securing it to the tree’s support system. Each successive bend is done in the opposite direction to form a zig-zag leader shape. The 45° angle is held by tying or taping the new growth to the support stake. This technique causes some current-season lateral branches to grow and some branches to grow the following spring. Make sure laterals that develop right at the bend don’t get too vigorous and compete with the leader. This technique is useful with very vigorous leader growth where some devigoration is appropriate and you want to try and use the extended leader growth rather than cut it off (as with weak-leader renewal).
Weak-leader renewal (Figure 4) is used where leader growth is excessive. To balance tree vigor, cut the leader off to a weaker (but still vigorous) lateral that can be encouraged to branch and tied up to the support post to form a new, weaker leader. Do this in the dormant season.
Spot treatment of blank areas with notching (Figure 5). Notching is a remedial technique that can be used for feathered trees with blind wood. This is done by placing a notch above each node in the unbranched region of the leader 2-3 weeks before bloom with a hacksaw blade (1⁄16- 1⁄8 inch wide) extending approximately one-third of the way around the tree. Be careful to cut only through the bark (phloem) and not the structural wood beneath the bark. Approximately 50-60% of the notched buds should grow to avoid having to head the tree and eliminate the higher branches which would reduce early fruit production. Because this procedure is time consuming, use it only to fill in unbranched areas.
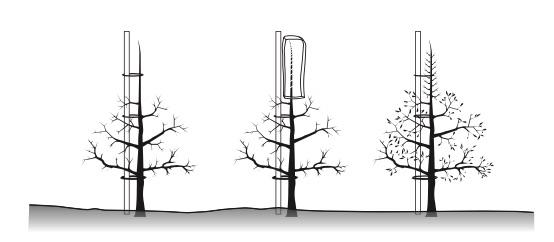
Figure 2. Leader branching by bagging.
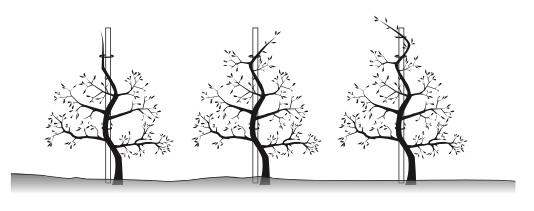
Figure 3. Leader branching by snaking.
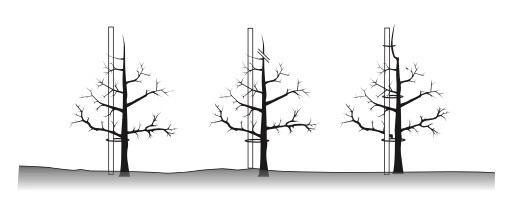
Figure 4. Leader branching by weak-leader renewal.
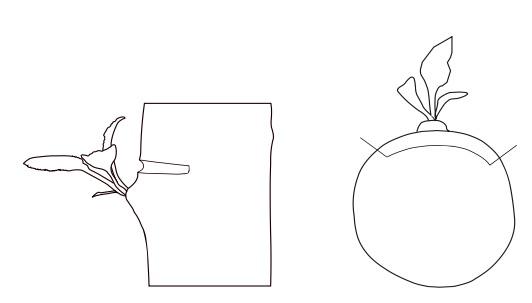
Figure 5. Leader branching by notching.
Lateral branch management
- When new laterals are 3-6 inches long, spread them out horizontally or nearly horizontal with a clothespin or toothpick.
- When lateral growth turns up with extension growth, laterals should be weighed or tied down to nearly horizontal. This timely positioning will usually release upright secondary branching along the top of laterals.
- As secondary uprights get strong enough to weight or tie over, some need to be horizontally positioned and some removed by thinning out. Generally the strongest ones are removed and more moderately vigorous ones are positioned to horizontal. (Positioning of lateral shoots and secondary branches a couple times during the summer may be necessary. This will pay off in increased fruiting potential and reduced pruning required in the first 3-4 years.)
- Leader branching techniques and lateral branch management must be repeated each season until the top of the tree leader reaches the maximum desired height of the tree.
Support Systems for High Density Orchards
Support systems provide anchorage for the trees, aid in controlling tree vigor, facilitate ease of management of the orchard, and help provide good light exposure to fruit and foliage. The support system must be designed to last the life of the orchard. Many different types of support systems have been used in high density orchards. Information is provided here on the slender spindle support system (Figure 6a), vertical axis (Figure 6b) and several trellis systems (Figure 7). There are also commercially available tree stakes that may be used to support individual trees without a wire trellis (e.g., 3-inch round wooden post and angular steel tree stakes). When individual tree stakes are used, a stake 10-feet long should be used and driven 2 feet into the ground, approximately 6 inches from the tree, shortly after planting.
The slender spindle system (Figure 6a) does not require large support posts, anchors, or wires. With wooden posts, a spike can be driven into the support post at ground level and be used in tying down limbs. When metal conduit or 2x2s are used to support trees, it is necessary to set larger posts at regular intervals down the tree row with a wire secured to the top of them. The individual tree supports should be fastened to the wire to give additional support.
The vertical axis trellis (Figure 6b) is similar to the 10-foot trellis. It does lend itself to grower adaptations. Post size and placement should not be modified. One to five wires can be used for crop support. Bamboo sticks, thin posts, wire, strings, and other materials have been successfully used as leader supports. The leader support does not need to extend below the bottom wire into the ground.
Vertical trellises of varying heights are in use throughout the country (Figure 7). When properly designed, installed, and maintained, they work well. However, many growers and pickers object to trellises as they restrict movement from one side of the row to the other. In addition, it is not uncommon to cut a wire when pruning, necessitating a difficult repair job. In view of this shortcoming, many growers elect to use other systems.
To construct a strong, long-lasting trellis support system:
- Remember that by increasing the depth of set of a post by one-third, the post’s resistance to overturning is doubled.
- Remember that a driven post has 11⁄2 times the resistance to overturning as does one set in a dug hole.
- Handset posts with the large end down.
- Drive posts with the small end down.
- Use galvanized 121⁄2-gauge high-tensile wire.
- Use 9-gauge, 13⁄4-inch long staples. They have 50% more pullout resistance than 11⁄2- inch long staples. Use staples with a slash-cut point for maximum holding power.
- Do not drive staples vertically into wood posts with both legs parallel to the wood grain. This can split the posts and reduce the holding power of the staples.
- Never drive staples tight against the wire as this will kink and weaken the wire and damage the zinc coating.
- Use mechanical splicers to join wires to retain the strength of the wire.
- Permanently install in-line tensioners in the trellis to tighten wires. They allow retensioning of the wire should slack occur.
- Remember that anchors at the ends of the trellis are essential to help maintain tension on the wires.
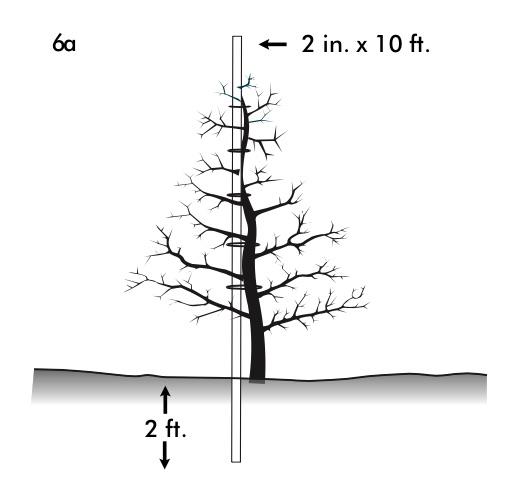
Figure 6a. Slender spindle tree with a single pole or single stake support.
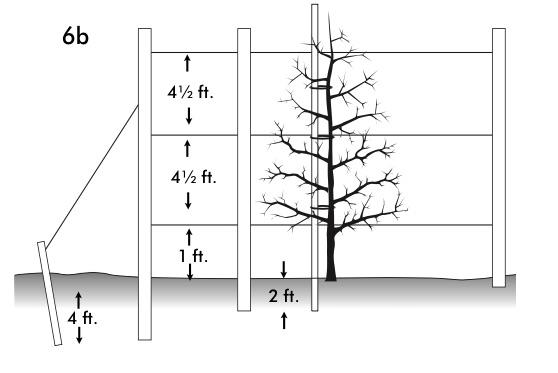
Figure 6b. Three-wire support OR individual tree stake (both shown here for illustration purposes).
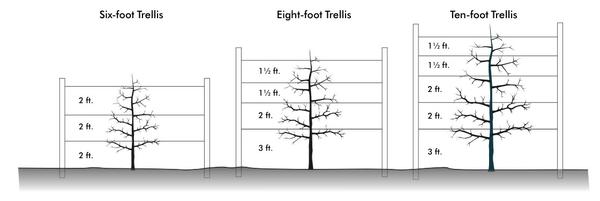
Figure 7. Multi-wire support system for higher density orchards.
Economics of High Density Apple Production
When judging the profitability of an enterprise, it is important to determine how many dollars the enterprise yields, when the dollars come in, and the returns available in other enterprises. There are two principles to consider. First, the sooner a dollar of revenue comes in the sooner it can be used to earn more revenue. Second, for any two enterprises of equal risk, the one yielding the higher rate of return is usually preferable. In this section both profitability and cash position (solvency) of the central leader and slender spindle type training systems will be examined. The specific objectives are to:
- Estimate the costs of two apple-training systems available to growers in the Southeast.
- Project the cash flow and estimate the profitability of these alternative training systems.
- Provide enough financial information to help growers make more informed decisions.
Cost Estimates
Profitability will obviously vary depending on the apple variety, yield, grade, and the marketing channel selected by the grower. Accordingly, the marketing channel impacts the price growers receive for their apples. Growers may receive higher prices for some of the newer cultivars, such as Ginger Gold, Gala, Fuji, and Pink Lady, compared to the more traditional cultivars, such as Red Delicious, Golden Delicious, and Rome. In addition, growers who use direct market alternatives, such as roadside stands, frequently have a higher profit margin than those who use wholesale marketing channels.
This analysis assumes that the apples would be sold through commercial marketing channels and that the prices received by growers were comparable to the prices received for traditional apple cultivars. The analysis further assumes that 181 trees per acre were planted on a 12 x 20-foot spacing using the central leader training system while 605 trees per acre were planted on a 6 x 12-foot spacing in the slender spindle-type training system. The total annual costs were estimated for a 20-year production period for both systems. The establishment year was considered as year ‘zero’ and was the year in which the site was prepared and the trees were planted.
Annual costs were divided into growing costs (labor, materials, and machinery costs), fixed costs (taxes, insurance, etc.), and harvest and packing costs. Growing and fixed cost estimates were based on production records supplied by North Carolina apple growers and NC State University faculty. Land was valued at $2,000 per acre while the harvest and packing charges of $1.10 and $4.50 per bushel harvested, respectively, were the average prices growers paid in 1997.
The projected yield patterns over the 20-year life of the plantings are shown in Table 3. Two yield patterns were used to estimate the total production for the slender spindle-type training system (SSTS). The average yield pattern represents the production a grower could expect following normal production practices and the high yield scenario depicts the yields a grower might anticipate in an intensively managed orchard. The central leader system reached a maximum production of 1,000 bushels per acre in the 13th year while the SSTS achieved the same production level in the seventh year with average yields and in the sixth year with high yields. For comparison purposes, it was assumed that 1,000 bushels per acre was the maximum yield for each orchard; however, Dr. Unrath’s research plots at the Mountain Horticultural Research Station have produced significantly higher yields.
| Year | Central Leader | Slender Spindle (Avg. Yields) | Slender Spindle (High Yields) |
|---|---|---|---|
| 1 | 0 | 0 | 0 |
| 2 | 0 | 0 | 0 |
| 3 | 0 | 180 | 525 |
| 4 | 51 | 350 | 688 |
| 5 | 168 | 600 | 688 |
| 6 | 302 | 800 | 1,000* |
| 7 | 500 | 1,000* | 1,000 |
| 8 | 800 | 1,000 | 1,000 |
| 9 | 850 | 1,000 | 1,000 |
| 10 | 850 | 1,000 | 1,000 |
| 11 | 850 | 1,000 | 1,000 |
| 12 | 918 | 1,000 | 1,000 |
| 13 | 1,000* | 1,000 | 1,000 |
| 14 | 1,000 | 1,000 | 1,000 |
| 15 | 1,000 | 1,000 | 1,000 |
| 16 | 1,000 | 1,000 | 1,000 |
| 17 | 1,000 | 1,000 | 1,000 |
| 18 | 1,000 | 1,000 | 1,000 |
| 19 | 1,000 | 1,000 | 1,000 |
| 20 | 1,000 | 1,000 | 1,000 |
| * The maximum yield used for this analysis was 1,000 bushels per acre | |||
It is unrealistic to believe growers in the Southeast will have a full apple crop every year the orchard is in production. Adverse weather, natural disasters, and poor pollination are just some of the reasons actual yields are lower than expected. To analyze the effect that reduced yields have on the profitability of each system, a complete crop failure was assumed to occur once every 10 years, which will be addressed later in this section (Table 8). In this analysis, crop yields were set at zero in the 8th and 17th years. Growing costs were reduced by 90% in these years to account for a minimum orchard maintenance program.
Revenues were calculated assuming growers would sell fruit through fresh wholesale market channels, however few growers ever achieve a packout rate of 100%. Therefore it was assumed that 80% of the apples were sold on the fresh market at either $12.00 or $15.00 per bushel and 20% were sold to apple juice processors at $1.50 per bushel. Revenues were calculated using two fresh market prices to portray the prices growers might receive for different quality fruit or different apple cultivars.
Procedure and Investment Analysis
The net cash flow pattern for each training system is calculated by subtracting expenses from revenues in each year. The cash flow pattern for the central leader training system is shown in Table 4. Farmers establishing a new apple orchard using this training method will experience net outflows of cash for the first five years. Some fruit is harvested in the fourth and fifth years but not enough to cover total expenses. The payback or breakeven year is determined by calculating the accumulated cash flow. In this example, a grower will break even in the 10th year. The breakeven year is important for apple growers who must secure loans to cover the period in which the enterprise operates in a deficit cash position. Only during this year will enough revenues be generated to cover start-up expenses.
| Year | Yield/Tree (Bushel) | Yield/Acre (Bushel) | Gross Income ($12/Bushel) | Annual Growing Costs | Total Growing Costs | Total Fixed Costs | Harvest and Packing Costs | Net Cash Flow | Accumulated Cash Flow | Discount Factor (6%) | Present Value of Net Cash Flow | ||
|---|---|---|---|---|---|---|---|---|---|---|---|---|---|
| Labor | Machine | Materials | |||||||||||
| Land | 0 | 0 | 0 | 0 | 0 | 0 | 2,000 | 0 | 0 | -2,000 | -2,000 | 1.0000 | -2,000 |
| 0 | 0 | 0 | 0 | 144 | 47 | 3,568 | 3,759 | 238 | 0 | -3,997 | -5,997 | 1.0000 | -3,997 |
| 1 | 0 | 0 | 0 | 183 | 81 | 130 | 394 | 196 | 0 | -590 | -6,587 | 0.9434 | -557 |
| 2 | 0 | 0 | 0 | 197 | 81 | 156 | 434 | 196 | 0 | -630 | -7,217 | 0.8900 | -594 |
| 3 | 0 | 0 | 0 | 221 | 81 | 163 | 465 | 196 | 0 | -661 | -7,878 | 0.8396 | -588 |
| 4 | 0.28 | 51 | 505 | 240 | 159 | 237 | 636 | 391 | 228 | -751 | -8,629 | 0.7921 | -630 |
| 5 | 0.93 | 168 | 1,663 | 260 | 159 | 251 | 670 | 391 | 753 | -150 | -8,779 | 0.7473 | -119 |
| 6 | 1.67 | 302 | 2,990 | 430 | 236 | 482 | 1,148 | 414 | 1.353 | 75 | -8,704 | 0.7050 | 56 |
| 7 | 2.76 | 500 | 4,950 | 471 | 236 | 482 | 1,189 | 442 | 2,240 | 1,079 | -7,625 | 0.6651 | 761 |
| 8 | 4.42 | 800 | 7,920 | 536 | 236 | 482 | 1,254 | 442 | 3,584 | 2,640 | -4,985 | 0.6274 | 1,756 |
| 9 | 4.70 | 850 | 8,415 | 536 | 236 | 482 | 1,254 | 442 | 3,808 | 2,911 | -2,074 | 0.5919 | 1,826 |
| 10 | 4.70 | 850 | 8,415 | 536 | 236 | 482 | 1,254 | 442 | 3,808 | 2,911 | 837 | 0.5584 | 1,723 |
| 11 | 4.70 | 850 | 8,415 | 624 | 236 | 482 | 1,342 | 442 | 3,808 | 2,823 | 3,660 | 0.5268 | 1,576 |
| 12 | 5.07 | 918 | 9,088 | 624 | 236 | 482 | 1,342 | 442 | 4,113 | 3,192 | 6,851 | 0.4970 | 1,681 |
| 13 | 5.52 | 1,000 | 9,900 | 624 | 236 | 482 | 1,342 | 442 | 4,480 | 3,636 | 10,487 | 0.4688 | 1,807 |
| 14 | 5.52 | 1,000 | 9,900 | 624 | 236 | 482 | 1,342 | 442 | 4,480 | 3,636 | 14,123 | 0.4423 | 1,705 |
| 15 | 5.52 | 1,000 | 9,900 | 624 | 236 | 482 | 1,342 | 442 | 4,480 | 3,636 | 17,759 | 0.4173 | 1,608 |
| 16 | 5.52 | 1,000 | 9,900 | 624 | 236 | 482 | 1,342 | 442 | 4,480 | 3,636 | 21,395 | 0.3936 | 1,517 |
| 17 | 5.52 | 1,000 | 9,900 | 624 | 236 | 482 | 1,342 | 442 | 4,480 | 3,636 | 25,031 | 0.3714 | 1,431 |
| 18 | 5.52 | 1,000 | 9,900 | 624 | 236 | 482 | 1,342 | 442 | 4,480 | 3,636 | 28,667 | 0.3503 | 1,350 |
| 19 | 5.52 | 1,000 | 9,900 | 624 | 236 | 482 | 1,342 | 442 | 4,480 | 3,636 | 32,303 | 0.3305 | 1,274 |
| 20 | 5.52 | 1,000 | 9,900 | 624 | 236 | 482 | 1,342 | 442 | 4,480 | 3,636 | 35,939 | 0.3118 | 1,134 |
| Land | 2,000 | 0.3118 | 624 | ||||||||||
| Total | 9,667 | 4,020 | 8,037 | 21,724 | 59,535 | 13,344 | |||||||
The next step is to compare this stream of net revenue, or the net present value, with other investment opportunities. There are two ways to do this. The first way is to assume that farmers could invest their money elsewhere at 6% interest and compare returns from the apple enterprise with those from other investments. The 6% rate was selected because it was the current rate for long-term certificates of deposit (CDs) when this analysis was conducted. CDs were considered to be the ‘best’ low risk alternative available for off-farm investments.
For a single enterprise, the essence of the net present value (NPV) approach is that the project should be accepted if its NPV is greater than zero. This technique uses the discounting procedure to compare the value of a dollar at the time of planting with a dollar received for apples at some future time. Discounting is based on the concept that a dollar received in the future is worth less than a dollar received today. For example, $1,000 received 10 years from now is worth $558 received today at a 6% interest rate.
In this analysis, the NPV of the central leader training system was $13,344 over a 20-year period. The explanation of this figure can be phrased in several ways. First, a new central leader apple orchard is worth $13,344 per acre today. Second, if a farmer was about to plant a new central leader apple orchard, someone would have to pay him $13,344 per acre to convince him to forget his plans.
The second method for financial comparison of apple production with other opportunities is to calculate the internal rate of return (IRR) on the total investment in the apple training system and then compare this rate of return with other long-term investments, such as 20- or 30-year treasury bonds. The internal rate of return for the central leader training system, assuming full production and a price of $12.00 per bushel, is 14%. When dividends on treasury bonds are yielding 6-7%, a 14% return to apples appears to be an attractive investment. Of course, revenues from apples may be even more risky than represented in this analysis due to higher price fluctuations and greater adverse weather conditions. But apple production under these assumptions is projected to be a profitable investment.
Economic Analysis of Apple Training Systems
Tables 4 and 5 illustrate the costs and returns for the central leader and slender spindle-type training systems using discounted cash flow assuming average yields over the 20-year life of the orchard. Table 6 shows the costs and returns of the SSTS assuming high yields are achieved in a well-managed orchard. The results of varying prices and decreasing production will be also discussed in this section, but similar tables for these scenarios will not be presented.
| Year | Yield/Tree (Bushel) | Yield/Acre (Bushel) | Gross Income ($12/Bushel | Annual Labor Costs | Total Growing Costs | Total Fixed Costs | Harvest and Packing Costs | Net Cash Flow | Accumulated Cash Flow | Discount Factor (6%) | Present Value of Net Cash Flow | ||
|---|---|---|---|---|---|---|---|---|---|---|---|---|---|
| Labor | Machine | Materials | |||||||||||
| Land | 0 | 0 | 0 | 0 | 0 | 0 | 2,000 | 0 | 0 | -2,000 | -2,000 | 1.0000 | -2,000 |
| 0 | 0 | 0 | 0 | 650 | 47 | 7,668 | 8,365 | 178 | 0 | -8,543 | -10,543 | 1.0000 | -8,543 |
| 1 | 0 | 0 | 0 | 432 | 146 | 198 | 776 | 258 | 0 | -1,034 | -11,577 | 0.9434 | -975 |
| 2 | 0 | 0 | 0 | 527 | 97 | 502 | 1,126 | 254 | 0 | -1,380 | -12,957 | 0.8900 | -1,228 |
| 3 | 0.3 | 180 | 1,782 | 680 | 131 | 352 | 1,163 | 319 | 806 | -506 | -13,463 | 0.8396 | -425 |
| 4 | 0.583 | 350 | 3,465 | 674 | 168 | 494 | 1,336 | 334 | 1,568 | 227 | -13,236 | 0.7921 | 180 |
| 5 | 1.000 | 600 | 5,940 | 752 | 181 | 278 | 1,211 | 343 | 2,688 | 1,698 | -11,538 | 0.7473 | 1,269 |
| 6 | 1.333 | 800 | 7,920 | 358 | 192 | 278 | 828 | 343 | 3,584 | 3,165 | -8,373 | 0.7050 | 2,231 |
| 7 | 1.667 | 1,000 | 9,900 | 358 | 192 | 278 | 828 | 343 | 4,480 | 4,249 | -4,124 | 0.6651 | 2,826 |
| 8 | 1.667 | 1,000 | 9,900 | 358 | 192 | 278 | 828 | 343 | 4,480 | 4,249 | 125 | 0.6274 | 2,666 |
| 9 | 1.667 | 1,000 | 9,900 | 358 | 192 | 278 | 828 | 343 | 4,480 | 4,249 | 4,374 | 0.5919 | 2,515 |
| 10 | 1.667 | 1,000 | 9,900 | 358 | 196 | 278 | 832 | 343 | 4,480 | 4,245 | 8,619 | 0.5584 | 2,370 |
| 11 | 1.667 | 1,000 | 9,900 | 358 | 196 | 278 | 832 | 343 | 4,480 | 4,245 | 12,864 | 0.5268 | 2,236 |
| 12 | 1.667 | 1,000 | 9,900 | 358 | 196 | 278 | 832 | 343 | 4,480 | 4,245 | 17,109 | 0.4970 | 2,110 |
| 13 | 1.667 | 1,000 | 9,900 | 358 | 196 | 278 | 832 | 343 | 4,480 | 4,245 | 21,354 | 0.4688 | 1,990 |
| 14 | 1.667 | 1,000 | 9,900 | 358 | 196 | 278 | 832 | 343 | 4,480 | 4,245 | 25,599 | 0.4423 | 1,878 |
| 15 | 1.667 | 1,000 | 9,900 | 361 | 207 | 278 | 846 | 350 | 4,480 | 4,424 | 29,823 | 0.4176 | 1,763 |
| 16 | 1.667 | 1,000 | 9,900 | 361 | 207 | 278 | 846 | 350 | 4,480 | 4,424 | 34,047 | 0.3936 | 1,663 |
| 17 | 1.667 | 1,000 | 9,900 | 361 | 207 | 278 | 846 | 350 | 4,480 | 4,424 | 38,271 | 0.3714 | 1,569 |
| 18 | 1.667 | 1,000 | 9,900 | 361 | 207 | 278 | 846 | 350 | 4,480 | 4,424 | 42,495 | 0.3503 | 1,480 |
| 19 | 1.667 | 1,000 | 9,900 | 361 | 207 | 278 | 846 | 350 | 4,480 | 4,424 | 46,719 | 0.3305 | 1,396 |
| 20 | 1.667 | 1,000 | 9,900 | 361 | 207 | 278 | 846 | 350 | 4,480 | 4,424 | 50,943 | 0.3118 | 1,317 |
| Land | 2,000 | 0.3118 | 624 | ||||||||||
| Total | 8,021 | 3,567 | 5,796 | 17,384 | 71,366 | 18,909 | |||||||
| Year | Yield/Tree (Bushel) | Yield/Acre (Bushel) | Gross Income ($12/Bushel) | Annual Growing Costs | Total Growing Costs | Total Fixed Costs | Harvest and Packing Costs | Net Cash Flow | Accumulated Cash Flow | Discount Factor (6%) | Present Value of Net Cash Flow | ||
|---|---|---|---|---|---|---|---|---|---|---|---|---|---|
| Labor | Machine | Materials | |||||||||||
| Land | 0 | 0 | 0 | 0 | 0 | 0 | 2,000 | 0 | 0 | -2,000 | -2,000 | 1.0000 | -2,000 |
| 0 | 0 | 0 | 0 | 650 | 47 | 7,668 | 8,365 | 178 | 0 | -8,543 | -10,543 | 1.0000 | -8,543 |
| 1 | 0 | 0 | 0 | 432 | 146 | 198 | 776 | 258 | 0 | -1,034 | -11.577 | 0.9434 | -975 |
| 2 | 0 | 0 | 0 | 527 | 97 | 502 | 1,126 | 254 | 0 | -1,380 | -12,957 | 0.8900 | -1,228 |
| 3 | 0.875 | 525 | 5,198 | 680 | 131 | 352 | 1,163 | 319 | 2,352 | 1,364 | -11,594 | 0.8396 | 1,145 |
| 4 | 1.147 | 688 | 6,811 | 674 | 168 | 494 | 1,336 | 334 | 3,082 | 2,059 | -9,535 | 0.7921 | 1,631 |
| 5 | 1.147 | 688 | 6,811 | 752 | 181 | 278 | 1,211 | 343 | 3,082 | 2,175 | -7,360 | 0.7473 | 1,625 |
| 6 | 1.667 | 1,000 | 9,900 | 358 | 192 | 278 | 828 | 343 | 4,480 | 4,249 | -3,111 | 0.7050 | 2,996 |
| 7 | 1.667 | 1,000 | 9,900 | 358 | 192 | 278 | 828 | 343 | 4,480 | 4,249 | 1,138 | 0.6651 | 2,826 |
| 8 | 1.667 | 1,000 | 9,900 | 358 | 192 | 278 | 828 | 343 | 4,480 | 4,249 | 5,387 | 0.6274 | 2,666 |
| 9 | 1.667 | 1,000 | 9,900 | 358 | 192 | 278 | 828 | 343 | 4,480 | 4,249 | 9,636 | 0.5919 | 2,515 |
| 10 | 1.667 | 1,000 | 9,900 | 358 | 196 | 278 | 832 | 343 | 4,480 | 4,245 | 13,881 | 0.5584 | 2,370 |
| 11 | 1.667 | 1,000 | 9,900 | 358 | 196 | 278 | 832 | 343 | 4,480 | 4,245 | 18,126 | 0.5268 | 2,236 |
| 12 | 1.667 | 1,000 | 9,900 | 358 | 196 | 278 | 832 | 343 | 4,480 | 4,245 | 22,371 | 0.4970 | 2,110 |
| 13 | 1.667 | 1,000 | 9,900 | 358 | 196 | 278 | 832 | 343 | 4,480 | 4,245 | 26,616 | 0.4688 | 1,990 |
| 14 | 1.667 | 1,000 | 9,900 | 358 | 196 | 278 | 832 | 343 | 4,480 | 4,245 | 30,861 | 0.4423 | 1,878 |
| 15 | 1.667 | 1,000 | 9,900 | 361 | 207 | 278 | 846 | 350 | 4,480 | 4,224 | 35,085 | 0.4173 | 1,763 |
| 16 | 1.667 | 1,000 | 9,900 | 361 | 207 | 278 | 846 | 350 | 4,480 | 4,224 | 39,309 | 0.3936 | 1,663 |
| 17 | 1.667 | 1,000 | 9,900 | 361 | 207 | 278 | 846 | 350 | 4,480 | 4,224 | 43,533 | 0.3714 | 1,569 |
| 18 | 1.667 | 1,000 | 9,900 | 361 | 207 | 278 | 846 | 350 | 4,480 | 4,224 | 47,757 | 0.3503 | 1,480 |
| 19 | 1.667 | 1,000 | 9,900 | 361 | 207 | 278 | 846 | 350 | 4,480 | 4,224 | 51,981 | 0.3305 | 1,396 |
| 20 | 1.667 | 1,000 | 9,900 | 361 | 207 | 278 | 846 | 350 | 4,480 | 4,224 | 56,205 | 0.3118 | 1,317 |
| Land | 2,000 | 0.3118 | 624 | ||||||||||
| Total | 8,021 | 3,567 | 5,796 | 17,384 | 75,716 | 23,051 | |||||||
Table 7 summarizes the estimated costs for each system assuming full production throughout the life of the orchard; Table 8 shows the projected costs assuming a total crop loss every 10 years. Although the establishment cost for the central leader training system is substantially lower than for the SSTS, the total growing costs for the latter method are less than for the central leader method. The net result is that there was only a difference of $266 in the total establishment and growing costs between the two training systems over the 20-year production period assuming full production and a difference of $1,093 assuming a crop loss every 10 years. The differences in the harvest and packing expenses are obviously directly related to the projected yields.
| Cost Categories | Central Leader | Slender Spindle (Avg. Yields) | Slender Spindle (High Yields) |
|---|---|---|---|
| Establishment cost | $3,759 | $8,365 | $8,365 |
| Growing costs | |||
| Labor cost | $9,667 | $8,021 | $8,021 |
| Machinery costs | $4,020 | $3,567 | $3,567 |
| Material costs | $8,037 | $5,796 | $5,796 |
| Total growing costs | $21,724 | $17,384 | $17,384 |
| Establishment and growing costs | $25,483 | $25,749 | $25,749 |
| Harvest and packing costs | $59,535 | $71,366 | $75,716 |
| Notes: Establishment costs for land preparation and the first year. Growing costs for years 2 through 20. | |||
In general, the central leader training system required 2-4 more years for the cash flow stream to break even than for the accumulated cash flow of the SSTS to turn positive (Table 9). The earliest that the central leader system broke even was in the ninth year with high prices and full production. The longest it took for this method to achieve a positive cash flow was the 11th year when the price was projected to be $12.00 per bushel with a crop loss every 10 years.
| Price per Bushel and Yield Assumptions | Breakeven Year |
|---|---|
| $12 per bushel with full production | |
| Central leader system | 10 |
| Slender spindle-type system (avg. yields) | 8 |
| Slender spindle-type system (high yields) | 7 |
| $15 per bushel with full production | |
| Central leader system | 9 |
| Slender spindle-type system (avg. yields) | 7 |
| Slender spindle-type system (high yields) | 6 |
| $12 per bushel with a crop loss every 10 years | |
| Central leader system | 11 |
| Slender spindle-type system (avg. yields) | 10 |
| Slender spindle-type system (high yields) | 7 |
| $15 per bushel with a crop loss every 10 years | |
| Central leader system | 10 |
| Slender spindle-type system (avg. yields) | 7 |
| Slender spindle-type system (high yields) | 6 |
The breakeven year for the SSTS with average yields ranged from the seventh year with full production and high prices to the 10th year with lower prices and crop failures. Assuming high yields, the SSTS broke even in the seventh year when the price was $12.00 per bushel and in the sixth year when the price was $15.00 per bushel. It should be noted, however, that even with high yields these breakeven periods would have been longer if the first crop failure had occurred before or during the sixth year. The accumulated cash flow was still negative during this period and a crop loss would have extended the time required to cover the establishment expenses.
The NPVs for each planting system were greater than zero, which indicates that both methods were profitable under the different price and yield assumptions (Table 10). However, the NPVs for the SSTS are consistently higher than the corresponding values for the central leader system. Assuming average yields, the NPV for the SSTS was $4,000-$8,000 higher than the central leader system and $9,000-$29,000 greater when higher yields were used to compute the net revenue stream. Therefore the SSTS is potentially more profitable than the central leader method.
| Price per Bushel and Yield Assumptions | Central Leader | Slender Spindle (Avg. Yield) | Slender Spindle (High Yield) |
|---|---|---|---|
| $12 per bushel (full production) | $13,344 | $18,909 | $23,051 |
| $15 per bushel (full production) | $29,204 | $38,093 | $44,069 |
| $12 per bushel (crop loss every 10 years) | $9,552 | $14,248 | $18,389 |
| $15 per bushel (crop loss every 10 years) | $23,010 | $31,035 | $37,010 |
Both training systems also look profitable when evaluating the projected internal rates of return (Table 11). The IRRs range from a low of 12% for the central leader system when low prices and a crop loss every 10 years were assumed to a high of 25% for the SSTS assuming high prices, high yields, and no crop losses. However, the SSTS again appears to be the better investment because the IRRs for this procedure were consistently higher than the corresponding values for the central leader system. The IRRs for the SSTS were always 1% higher than the central leader system when average yields were used to estimate the net revenue stream and 4 or 5% greater when the higher yields were used.
| Price per Bushel and Yield Assumptions | Central Leader | Slender Spinde (Avg. Yield) | Slender Spindle (High Yield) |
|---|---|---|---|
| $12 per bushel (full production) | 14% | 15% | 18% |
| $15 per bushel (full production) | 20% | 21% | 25% |
| $12 per bushel (crop loss every 10 years) | 12% | 13% | 16% |
| $15 per bushel (crop loss every 10 years) | 18% | 19% | 23% |
Conclusions
Three conclusions can be drawn from this analysis. First, the higher density system is more expensive in the investment year, but total growing costs are less than the central leader system. The net result is that there is no significant difference in the total establishment and growing costs of these two procedures over the 20-year life of the orchards. Second, apple production using either training system can be a profitable venture. The NPVs for each production and price scenario are greater than zero and the internal rates of return are greater than many alternative long-term investment opportunities.
Finally, the SSTS, if properly maintained, can be more profitable than the central leader training system. The breakeven period for the SSTS was consistently shorter, the NPVs were higher, and the internal rates of return were greater than the corresponding values for the central leader procedure for each 20-year scenario analyzed in this study. The SSTS also may allow a grower to realize greater returns by planting new cultivars and getting significant production before prices decrease as other growers plant these cultivars and supplies increase. Although SSTS systems have not been evaluated widely over a 20-year period, the SSTS system allows the grower an opportunity to remove a higher density orchard at 15 years to replant to newer, higher value cultivars and still be profitable. In addition, the newer cultivars may also have the potential for much greater returns.
References
Anderson, Jock R., John L. Dillon, and J. Brian Hardaker, Agricultural Decision Analysis. Ames, Iowa: The Iowa State University Press, 1977.
Funt, Richard C., Tara A. Baugher, Henry W. Hognite, and William C. Kleiner, Profitability of Different Apple Orchard Systems in the Eastern United States. Department of Horticulture, Ohio Agricultural Research and Development Center, The Ohio State University, 1992.
White, Gerald B., and Alison DeMarree, Economics of Apple Orchard Planting Systems. Information Bulletin 227, Cornell Cooperative Extension, Cornell University, 1992.
Publication date: Jan. 1, 1998
Reviewed/Revised: July 24, 2026
AG-581
Recommendations for the use of agricultural chemicals are included in this publication as a convenience to the reader. The use of brand names and any mention or listing of commercial products or services in this publication does not imply endorsement by NC State University or N.C. A&T State University nor discrimination against similar products or services not mentioned. Individuals who use agricultural chemicals are responsible for ensuring that the intended use complies with current regulations and conforms to the product label. Be sure to obtain current information about usage regulations and examine a current product label before applying any chemical. For assistance, contact your local N.C. Cooperative Extension county center.
N.C. Cooperative Extension prohibits discrimination and harassment regardless of age, color, disability, family and marital status, gender identity, national origin, political beliefs, race, religion, sex (including pregnancy), sexual orientation and veteran status.