
Hose-drag-type equipment has gained popularity in recent years for land application of wastewater1 in North Carolina. It offers several advantages over traditional irrigation systems including odor reduction, nitrogen conservation, and a relatively high ow rate that cuts the application time. Hose-drag systems may also be used to apply wastewater to areas not accessible by traditional irrigation equipment. For more details on hose drag systems including tables of application depths for various tractor speeds and equipment widths refer to Extension publication AG-634, Hose Drag Systems for Land Application of Liquid Manure and Wastewater.
State law requires field calibration of all land application equipment used on animal production farms. Specialists certifying animal waste management plans must also certify that operators have been provided calibration and adjustment guidance for all land application equipment.
1 Wastewater in this publication refers to both liquid manure and municipal and industrial wastewater. ↲
General Guidelines
Several factors determine the distribution of liquid wastewater from hose-drag land application equipment:
- flow rate
- operating pressure
- the speed of the tractor pulling the unit
- overlap of adjacent passes made by the equipment
This publication explains calibration procedures for the “low-profile-type” discharge system (Figure 1) and a “boom-type” system. (Figure 2). The two systems have different spread patterns. The low-profile-type units discharge close to the ground either through hooded shrouds or splash plates and do not spread much beyond their physical width. They are normally run “edge to edge” in adjacent passes. Boom-type units discharge from a slightly higher elevation under slightly more pressure. Wastewater goes substantially beyond their discharge points. Since these two basic types of hose-drag units should be operated with different overlap, application rates will differ depending upon the overlap or “effective application width” chosen by the operator.
The calibration of hose-drag-type equipment involves:
- Verifying tractor speed.
- Measuring flow rate to the equipment.
- Establishing the effective application width.
- Measuring the wetted width of a single pass, and of two adjacent passes for boom-type units in order to establish an effective width. The wetted width of boom-type units can vary with boom height, nozzle pressure, and with adjustment of splash-plate angle if so equipped.
- Figuring the average application depth.
- Comparing the average application depth to the depth allowed in the waste utilization plan. Variables (usually tractor speed) are adjusted as needed so that actual application depth does not exceed the allowed depth in the approved plan.
Average application depth in inches can be obtained using:
Equation 1:
depth = flow rate in gallons per minute ÷ (54.9 × effective width in feet × tractor speed in miles per hour)
The effective width is the distance between the centerlines of adjacent passes of the unit. For “low-profile-type” units, the effective width is essentially the advertised size of the hose drag systems. Typical widths for these systems are 8, 10, 12, 15, and 20 feet. Tables showing applied depth for low-profile-type units of the above listed widths can be found in Table 1.
For boom-type units, the effective width is determined in the eld by measuring the distance between centerlines of adjacent passes of the unit. Convert depths obtained from the equation above or to gallons per acre by multiplying by 27,154.
Once the application depth has been determined, the tractor speed may need to be adjusted to meet requirements in the waste utilization plan. To find the tractor speed in miles per hour required to apply a desired application depth, use:
Equation 2:
speed = flow rate in gallons per minute ÷ (54.9 × application depth in inches × effective width in feet)
While application depths up to 1 inch are allowed in some waste utilization plans, do not apply more than 0.75 inch during any given application. Limits set by the waste utilization plan and existing soil moisture conditions will determine maximum application depths.
Flow rates are determined from a flow meter that may be permanently mounted on the hose-drag unit upstream of the distribution box or manifold, or temporarily placed inline with the hose supplying the hose-drag unit. If using a hose reel with a temporarily placed meter, position the flow meter between the hydrant and the reel.
application depth in inches = row rate in gallons per minute ÷ (54.9 × effective width in feet × tractor speed in miles per hour)
The effective width is the distance between the centerlines of adjacent passes of the unit. The widths given in Tables 1 through 5 are the advertised sizes of the hose drag systems, and can normally be used as the effective width.
The tractor speed required to apply a target depth when system flow rate is known can be determined by rearranging equation 1 to:
tractor speed = flow rate ÷ (54.9 × application depth × effective width)
Application depths up to 1.0 inch are shown in Tables 1 through 5 because depths as great as 1.0 inch are given in some waste utilization plans; however, it is recommended that no more than 0.75 inches be applied during any given application. Limits set by individual waste utilization plans and existing soil moisture conditions will determine appropriate application depths. The depths shown in Tables 1 through 5 may be converted to gallons per acre by multiplying application depth by 27,154.
The average application depth over the entire field may be obtained from beginning and ending flow meter readings and the area irrigated. Flow rates used in the tables should be read only after the hose has filled and the flow rate has stabilized.
Flow rates for hose drag-type systems depend on the pump, mainline diameter and length, hose diameter and length, and the size and number of discharge points on the application unit. Flow rates from hose drag systems can exceed 1,000 gallons per minute for the larger units. Hose drag systems may require different pumps than those used with hard hose traveling gun systems, since they are designed to operate at much higher flow rates.
Note: To obtain gallons per acre, multiply application depth (inches) in table by 27,154. Application depths to 1.00 inch are shown but applications greater than 0.75 inch are not recommended.
| discharge (gpm) | Tractor Speed (mph) | |||||||
|---|---|---|---|---|---|---|---|---|
| 0.5 | 1 | 1.5 | 2 | 2.5 | 3 | 3.5 | 4 | |
| 200 | 0.73 | 0.36 | 0.24 | 0.18 | 0.15 | 0.12 | 0.10 | 0.09 |
| 225 | 0.82 | 0.41 | 0.27 | 0.21 | 0.16 | 0.14 | 0.12 | 0.10 |
| 250 | 0.91 | 0.46 | 0.30 | 0.23 | 0.18 | 0.15 | 0.13 | 0.11 |
| 275 | 1.00 | 0.50 | 0.33 | 0.25 | 0.20 | 0.17 | 0.14 | 0.13 |
| 300 | 0.55 | 0.36 | 0.27 | 0.22 | 0.18 | 0.16 | 0.14 | |
| 325 | 0.59 | 0.39 | 0.30 | 0.24 | 0.20 | 0.17 | 0.15 | |
| 350 | 0.64 | 0.43 | 0.32 | 0.26 | 0.21 | 0.18 | 0.16 | |
| 375 | 0.68 | 0.46 | 0.34 | 0.27 | 0.23 | 0.20 | 0.17 | |
| 400 | 0.73 | 0.49 | 0.36 | 0.29 | 0.24 | 0.21 | 0.18 | |
| 425 | 0.77 | 0.52 | 0.39 | 0.31 | 0.26 | 0.22 | 0.19 | |
| 450 | 0.82 | 0.55 | 0.41 | 0.33 | 0.27 | 0.23 | 0.21 | |
| 475 | 0.87 | 0.58 | 0.43 | 0.35 | 0.29 | 0.25 | 0.22 | |
| 500 | 0.91 | 0.61 | 0.46 | 0.36 | 0.30 | 0.26 | 0.23 | |
| 525 | 0.96 | 0.64 | 0.48 | 0.38 | 0.32 | 0.27 | 0.24 | |
| 550 | 1.00 | 0.67 | 0.50 | 0.40 | 0.33 | 0.29 | 0.25 | |
| 575 | 0.70 | 0.52 | 0.42 | 0.35 | 0.30 | 0.26 | ||
| 600 | 0.73 | 0.55 | 0.44 | 0.36 | 0.31 | 0.27 | ||
| 625 | 0.76 | 0.57 | 0.46 | 0.38 | 0.33 | 0.28 | ||
| 650 | 0.79 | 0.59 | 0.47 | 0.39 | 0.34 | 0.30 | ||
| 675 | 0.82 | 0.62 | 0.49 | 0.41 | 0.35 | 0.31 | ||
| 700 | 0.85 | 0.64 | 0.51 | 0.43 | 0.36 | 0.32 | ||
| 725 | 0.88 | 0.66 | 0.53 | 0.44 | 0.38 | 0.33 | ||
| 750 | 0.91 | 0.68 | 0.55 | 0.46 | 0.39 | 0.34 | ||
| 775 | 0.94 | 0.71 | 0.57 | 0.47 | 0.40 | 0.35 | ||
| 800 | 0.97 | 0.73 | 0.58 | 0.49 | 0.42 | 0.36 | ||
| 825 | 1.00 | 0.75 | 0.60 | 0.50 | 0.43 | 0.38 | ||
| 850 | 0.77 | 0.62 | 0.52 | 0.44 | 0.39 | |||
| 875 | 0.80 | 0.64 | 0.53 | 0.46 | 0.40 | |||
| 900 | 0.82 | 0.66 | 0.55 | 0.47 | 0.41 | |||
Note: To obtain gallons per acre, multiply application depth (inches) in table by 27,154. Application depths to 1.00 inch are shown but applications greater than 0.75 inch are not recommended.
| discharge (gpm) | Tractor Speed (mph) | |||||||
|---|---|---|---|---|---|---|---|---|
| 0.5 | 1 | 1.5 | 2 | 2.5 | 3 | 3.5 | 4 | |
| 300 | 0.91 | 0.46 | 0.30 | 0.23 | 0.18 | 0.15 | 0.13 | 0.11 |
| 325 | 0.99 | 0.49 | 0.33 | 0.25 | 0.20 | 0.16 | 0.14 | 0.12 |
| 350 | 0.53 | 0.35 | 0.27 | 0.21 | 0.18 | 0.15 | 0.13 | |
| 375 | 0.57 | 0.38 | 0.28 | 0.23 | 0.19 | 0.16 | 0.14 | |
| 400 | 0.61 | 0.41 | 0.30 | 0.24 | 0.20 | 0.17 | 0.15 | |
| 425 | 0.65 | 0.43 | 0.32 | 0.26 | 0.22 | 0.18 | 0.16 | |
| 450 | 0.68 | 0.46 | 0.34 | 0.27 | 0.23 | 0.20 | 0.17 | |
| 475 | 0.72 | 0.48 | 0.36 | 0.29 | 0.24 | 0.21 | 0.18 | |
| 500 | 0.76 | 0.51 | 0.38 | 0.30 | 0.25 | 0.22 | 0.19 | |
| 525 | 0.80 | 0.53 | 0.40 | 0.32 | 0.27 | 0.23 | 0.20 | |
| 550 | 0.84 | 0.56 | 0.42 | 0.33 | 0.28 | 0.24 | 0.21 | |
| 575 | 0.87 | 0.58 | 0.44 | 0.35 | 0.29 | 0.25 | 0.22 | |
| 600 | 0.91 | 0.61 | 0.46 | 0.36 | 0.30 | 0.26 | 0.23 | |
| 625 | 0.95 | 0.63 | 0.47 | 0.38 | 0.32 | 0.27 | 0.24 | |
| 650 | 0.99 | 0.66 | 0.49 | 0.39 | 0.33 | 0.28 | 0.25 | |
| 675 | 0.68 | 0.51 | 0.41 | 0.34 | 0.29 | 0.26 | ||
| 700 | 0.71 | 0.53 | 0.43 | 0.35 | 0.30 | 0.27 | ||
| 725 | 0.73 | 0.55 | 0.44 | 0.37 | 0.31 | 0.28 | ||
| 750 | 0.76 | 0.57 | 0.46 | 0.38 | 0.33 | 0.28 | ||
| 775 | 0.78 | 0.59 | 0.47 | 0.39 | 0.34 | 0.29 | ||
| 800 | 0.81 | 0.61 | 0.49 | 0.41 | 0.35 | 0.30 | ||
| 825 | 0.84 | 0.63 | 0.50 | 0.42 | 0.36 | 0.31 | ||
| 850 | 0.86 | 0.65 | 0.52 | 0.43 | 0.37 | 0.32 | ||
| 875 | 0.89 | 0.66 | 0.53 | 0.44 | 0.38 | 0.33 | ||
| 900 | 0.91 | 0.68 | 0.55 | 0.46 | 0.39 | 0.34 | ||
| 925 | 0.94 | 0.70 | 0.56 | 0.47 | 0.40 | 0.35 | ||
| 950 | 0.96 | 0.72 | 0.58 | 0.48 | 0.41 | 0.36 | ||
| 975 | 0.99 | 0.74 | 0.59 | 0.49 | 0.42 | 0.37 | ||
| 1000 | 0.76 | 0.61 | 0.51 | 0.43 | 0.38 | |||
Note: To obtain gallons per acre, multiply application depth (inches) in table by 27,154. Application depths to 1.00 inch are shown but applications greater than 0.75 inch are not recommended.
| discharge (gpm) | Tractor Speed (mph) | |||||||
|---|---|---|---|---|---|---|---|---|
| 0.5 | 1 | 1.5 | 2 | 2.5 | 3 | 3.5 | 4 | |
| 300 | 0.73 | 0.36 | 0.24 | 0.18 | 0.15 | 0.12 | 0.10 | 0.09 |
| 325 | 0.79 | 0.39 | 0.26 | 0.20 | 0.16 | 0.13 | 0.11 | 0.10 |
| 350 | 0.85 | 0.43 | 0.28 | 0.21 | 0.17 | 0.14 | 0.12 | 0.11 |
| 375 | 0.91 | 0.46 | 0.30 | 0.23 | 0.18 | 0.15 | 0.13 | 0.11 |
| 400 | 0.97 | 0.49 | 0.32 | 0.24 | 0.19 | 0.16 | 0.14 | 0.12 |
| 425 | 0.52 | 0.34 | 0.26 | 0.21 | 0.17 | 0.15 | 0.13 | |
| 450 | 0.55 | 0.36 | 0.27 | 0.22 | 0.18 | 0.16 | 0.14 | |
| 475 | 0.58 | 0.38 | 0.29 | 0.23 | 0.19 | 0.16 | 0.14 | |
| 500 | 0.61 | 0.41 | 0.30 | 0.24 | 0.20 | 0.17 | 0.15 | |
| 525 | 0.64 | 0.43 | 0.32 | 0.26 | 0.21 | 0.18 | 0.16 | |
| 550 | 0.67 | 0.45 | 0.33 | 0.27 | 0.22 | 0.19 | 0.17 | |
| 575 | 0.70 | 0.47 | 0.35 | 0.28 | 0.23 | 0.20 | 0.17 | |
| 600 | 0.73 | 0.49 | 0.36 | 0.29 | 0.24 | 0.21 | 0.18 | |
| 625 | 0.76 | 0.51 | 0.38 | 0.30 | 0.25 | 0.22 | 0.19 | |
| 650 | 0.79 | 0.53 | 0.39 | 0.32 | 0.26 | 0.23 | 0.20 | |
| 675 | 0.82 | 0.55 | 0.41 | 0.33 | 0.27 | 0.23 | 0.21 | |
| 700 | 0.85 | 0.57 | 0.43 | 0.34 | 0.28 | 0.24 | 0.21 | |
| 725 | 0.88 | 0.59 | 0.44 | 0.35 | 0.29 | 0.25 | 0.22 | |
| 750 | 0.91 | 0.61 | 0.46 | 0.36 | 0.30 | 0.26 | 0.23 | |
| 775 | 0.94 | 0.63 | 0.47 | 0.38 | 0.31 | 0.27 | 0.24 | |
| 800 | 0.97 | 0.65 | 0.49 | 0.39 | 0.32 | 0.28 | 0.24 | |
| 825 | 1.00 | 0.67 | 0.50 | 0.40 | 0.33 | 0.29 | 0.25 | |
| 850 | 0.69 | 0.52 | 0.41 | 0.34 | 0.30 | 0.26 | ||
| 875 | 0.71 | 0.53 | 0.43 | 0.35 | 0.30 | 0.27 | ||
| 900 | 0.73 | 0.55 | 0.44 | 0.36 | 0.31 | 0.27 | ||
| 925 | 0.75 | 0.56 | 0.45 | 0.37 | 0.32 | 0.28 | ||
| 950 | 0.77 | 0.58 | 0.46 | 0.38 | 0.33 | 0.29 | ||
| 975 | 0.79 | 0.59 | 0.47 | 0.39 | 0.34 | 0.30 | ||
| 1000 | 0.81 | 0.61 | 0.49 | 0.41 | 0.35 | 0.30 | ||
| Note: To obtain gallons per acre, multiply application depth (inches) in table by 27,154. Application depths to 1.00 inch are shown but applications greater than 0.75 inch are not recommended. | ||||||||
| discharge (gpm) | Tractor Speed (mph) | |||||||
|---|---|---|---|---|---|---|---|---|
| 0.5 | 1 | 1.5 | 2 | 2.5 | 3 | 3.5 | 4 | |
| 500 | 0.91 | 0.46 | 0.30 | 0.23 | 0.18 | 0.15 | 0.13 | 0.11 |
| 525 | 0.96 | 0.48 | 0.32 | 0.24 | 0.19 | 0.16 | 0.14 | 0.12 |
| 550 | 1.00 | 0.50 | 0.33 | 0.25 | 0.20 | 0.17 | 0.14 | 0.13 |
| 575 | 0.52 | 0.35 | 0.26 | 0.21 | 0.17 | 0.15 | 0.13 | |
| 600 | 0.55 | 0.36 | 0.27 | 0.22 | 0.18 | 0.16 | 0.14 | |
| 625 | 0.57 | 0.38 | 0.28 | 0.23 | 0.19 | 0.16 | 0.14 | |
| 650 | 0.59 | 0.39 | 0.30 | 0.24 | 0.20 | 0.17 | 0.15 | |
| 675 | 0.62 | 0.41 | 0.31 | 0.25 | 0.21 | 0.18 | 0.15 | |
| 700 | 0.64 | 0.43 | 0.32 | 0.26 | 0.21 | 0.18 | 0.16 | |
| 725 | 0.66 | 0.44 | 0.33 | 0.26 | 0.22 | 0.19 | 0.17 | |
| 750 | 0.68 | 0.46 | 0.34 | 0.27 | 0.23 | 0.20 | 0.17 | |
| 775 | 0.71 | 0.47 | 0.35 | 0.28 | 0.24 | 0.20 | 0.18 | |
| 800 | 0.73 | 0.49 | 0.36 | 0.29 | 0.24 | 0.21 | 0.18 | |
| 825 | 0.75 | 0.50 | 0.38 | 0.30 | 0.25 | 0.21 | 0.19 | |
| 850 | 0.77 | 0.52 | 0.39 | 0.31 | 0.26 | 0.22 | 0.19 | |
| 875 | 0.80 | 0.53 | 0.40 | 0.32 | 0.27 | 0.23 | 0.20 | |
| 900 | 0.82 | 0.55 | 0.41 | 0.33 | 0.27 | 0.23 | 0.21 | |
| 925 | 0.84 | 0.56 | 0.42 | 0.34 | 0.28 | 0.24 | 0.21 | |
| 950 | 0.87 | 0.58 | 0.43 | 0.35 | 0.29 | 0.25 | 0.22 | |
| 975 | 0.89 | 0.59 | 0.44 | 0.36 | 0.30 | 0.25 | 0.22 | |
| 1000 | 0.91 | 0.61 | 0.46 | 0.36 | 0.30 | 0.26 | 0.23 | |
| 1025 | 0.93 | 0.62 | 0.47 | 0.37 | 0.31 | 0.27 | 0.23 | |
| 1050 | 0.96 | 0.64 | 0.48 | 0.38 | 0.32 | 0.27 | 0.24 | |
| 1075 | 0.98 | 0.65 | 0.49 | 0.39 | 0.33 | 0.28 | 0.24 | |
| 1100 | 1.00 | 0.67 | 0.50 | 0.40 | 0.33 | 0.29 | 0.25 | |
| 1125 | 0.68 | 0.51 | 0.41 | 0.34 | 0.29 | 0.26 | ||
| 1150 | 0.70 | 0.52 | 0.42 | 0.35 | 0.30 | 0.26 | ||
| 1175 | 0.71 | 0.54 | 0.43 | 0.36 | 0.31 | 0.27 | ||
| 1200 | 0.73 | 0.55 | 0.44 | 0.36 | 0.31 | 0.27 | ||
Note: To obtain gallons per acre, multiply application depth (inches) in table by 27,154. Application depths to 1.00 inch are shown but applications greater than 0.75 inch are not recommended.
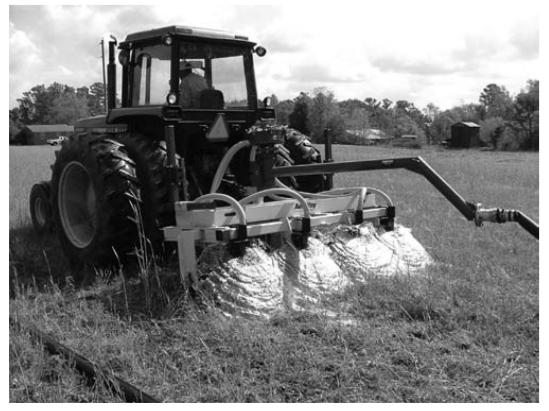
Figure 1. An AerWay unit with Hydro Engineering manifold (hose drag application unit (low-profile-type)).
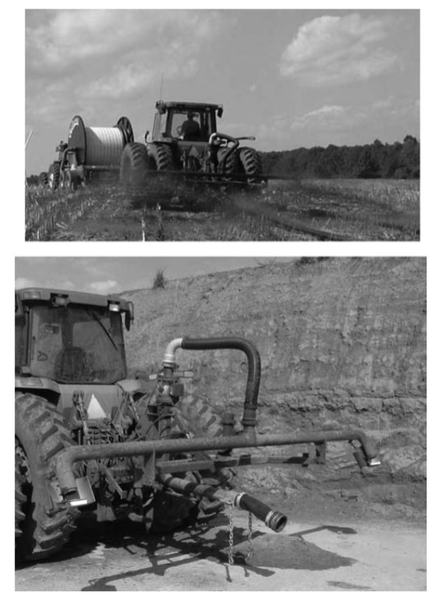
Figure 2. Cadman two nozzle boom with splash plate kit (hose drag (boom-type) unit) is shown in these two photos.
Field Procedure
The field procedure consists of 1) measuring tractor speed, 2) measuring flow rate, and 3) for boom-type systems, measuring effective width. Enter collected information into the appropriate field data sheet (Figure 5 for low-profile type units and Figure 6 for boom-type units).
Determining Tractor Speed, S
See Figure 3.
(You will need flags, a stop watch or watch with second hand, and a tape measure or measuring wheel). Repeat steps 2 through 4 below and average the two measured speeds.
-
Measure a distance over a relatively at area where application will occur. A minimum distance of 100 feet is recommended. Set flags at each end.
-
Operate tractor with unit and hose attached, but no wastewater being discharged, to establish a targeted speed. Record gear range and gear, throttle setting (rpm), and speedometer reading (if tractor has a speedometer).
-
Record the time is takes for the unit to cover the distance established in step 1. Make sure to start and stop your watch at either end of the run at a common point of reference on the unit, such as when the front axle of the tractor passes the flag.
-
Calculate tractor speed. Tractor speed in miles per hour can be calculated by using:
Equation 3:
distance in feet ÷ (seconds it takes to cover distance × 1.47)
If you use a distance of 100 feet, get tractor speed by dividing 68.18 by the seconds it takes to cover 100 feet.
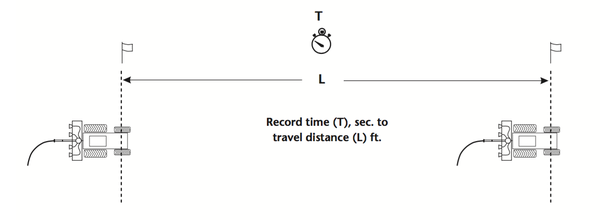
Figure 3. When determining tractor speed, travel distance (L) should be at least 100 feet.
Determining Flow Rate, Q
(You will need a flow meter and a stop watch or watch with a second hand.)
Determine flow rate by either 1) recording the instantaneous flow rate or 2) by using the ow totalizer and elapsed time. Measure flow rate with the unit in motion to avoid over-application and after determining tractor speed as outlined in the previous section.
1. Run the system in motion until all air is out of the mainline and hose, and the flow rate has been stabilized as shown by the flow rate needle or the digital readout on flowmeter. If a hose reel is used to supply wastewater, record the pressure at the reel. If a reel is not used, record the pressure at the pump.
2a. Record instantaneous flow rate in gallons per minute (gpm).
OR
2b. Subtract beginning ow totalizer reading from ending flow totalizer reading for a time period not less than 15 minutes. Convert to gpm by dividing gallons by elapsed time in minutes. When reading the totalizer, make sure to note the value of the last (farthest right) digit. Often this digit indicates hundreds of gallons, in which case the totalizer number needs to be multiplied by 100.
Note: Step 2b should be used rather than 2a if the instantaneous flow rate varies by more than 10 percent after all the air has been purged from the system and the flow has stabilized. For flow meters with needles (normally propeller-type), this is indicated by a “bouncing” needle.
Determining Effective Width, W
(You will need flags and a tape measure or measuring wheel.)
Low-profile-type units
For “low-profile”-type units (Figure 1 and Figure 4a) operated with little to no overlap (edge-to-edge), simply record the advertised width. This width is roughly the width of the unit.
Boom-type units
It is not as easy to determine the effective width for boom-type units (Figure 2, Figure 4b, 4c). To achieve consistent application uniformity between adjacent passes, the distance between the nozzles in adjacent passes should be the same as the fixed distance between the nozzles on the boom. This requires a tractor pass spacing equal to the number of nozzles on the boom times the distance between the nozzles (“N” in Figure 4b) . For the case with two nozzles the effective width should be 2 x N . If the field measured effective width calculated in the following steps differs by more than 15 percent of this target value, adjust the pass distance.
For boom-type units, the wetted widths measured in step 2 will depend upon nozzle pressure, boom height, and angle of the splash plates. If boom height and splash plate angle are adjustable, make note of these settings as an adjustment will alter the wetted width and, therefore, the calibration. Boom-type units may also be subject to drift, so calibration of these units should be done in wind speeds of 5 mph or less.
- Measure the distance between the fixed nozzles. Multiply this distance by the number of nozzles on the boom to obtain the target effective width.
- For boom-type units (see Figure 2 and Figure 4b) that spread wastewater an appreciable distance from the nozzle:
- Measure the wetted width of a single pass (Wm)
- Measure the wetted width of two adjacent passes (W2m)
Repeat steps 2a and 2b twice for a total of three measurements each. Take these measurements at least 25 feet from each other, and average both wetted width measurements.
The effective width (We) is:
Equation 4:
The tractor speed, flow rate, and effective width measurements are used to calculate application depth in the field data sheet or with Equation 1. Data from the field data sheet may be used with Equation 2 to determine the target tractor speed to achieve a desired application depth.
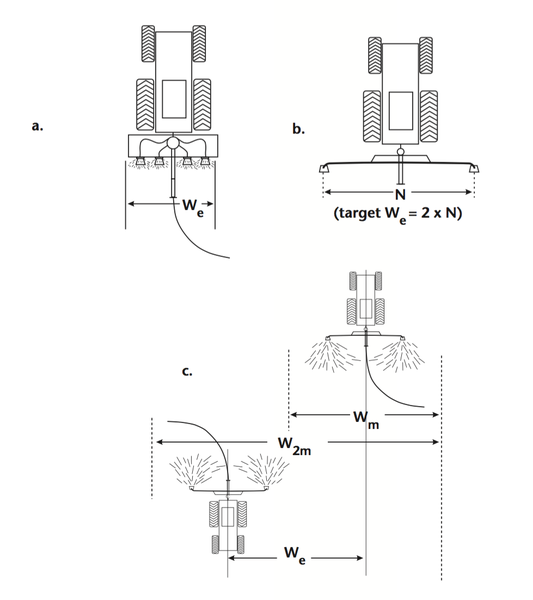
Figure 4. Determination of a.) effective width (Wₑ) for low-profile-type hose drag units; b.) target effective width for a 2 nozzle boom example, and c.) eld-determined effective width for boom-type hose drag units.
Interpretation and Adjustment
Compare the calculated application depth against the depth allowed in the animal waste utilization plan, and against any problems observed in the field. If either the application depth measured in the field is greater than the limit in the waste utilization plan, or runoff occurs on the field, the application rate is too high. To reduce the application rate, increase the tractor speed. The target tractor speed may be calculated from Equation 2 using the system flow rate and effective width determined in the field procedure.
If the application rate is less than desired (and under the permitted limit), reduce tractor speed to increase the application rate. After adjusting the tractor speed, verify the new speed using the procedure previously described. In no case should the application rate allow ponding or runoff, regardless of the permitted limit.
To achieve consistent application uniformity, boom-type units should be driven such that the distance between nozzles in adjacent passes is about the same as the distance between the fixed nozzles on the boom (see Figure 4). In this case the target effective width (target We), the distance between the centerline of the tractor in two adjacent passes, is equal to the number of nozzles on the boom times the distance between the fixed nozzles (N). If the field-measured effective width (We) calculated in Equation 4 differs by more than 15 percent from the target value, adjust the pass width.
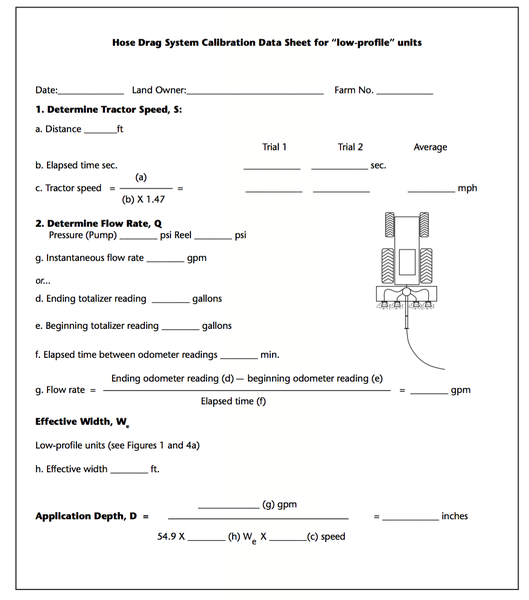
Figure 5. Field Data Sheet for “low-profile” units.
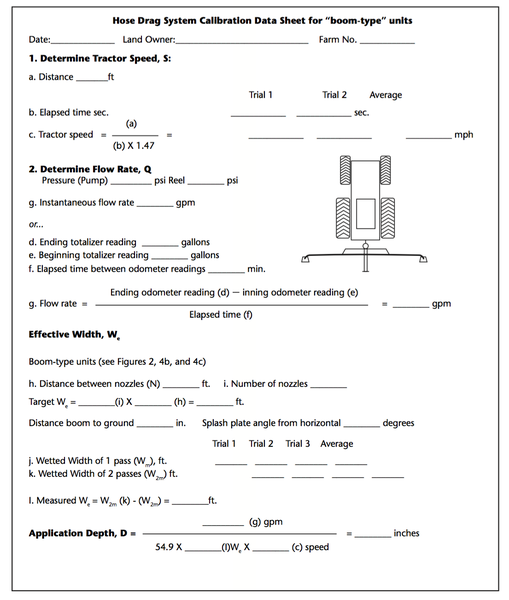
Figure 6. Field Data Sheet for “boom-type” units.
Publication date: Dec. 1, 2007
Reviewed/Revised: Jan. 10, 2025
AG-553-08
N.C. Cooperative Extension prohibits discrimination and harassment regardless of age, color, disability, family and marital status, gender identity, national origin, political beliefs, race, religion, sex (including pregnancy), sexual orientation and veteran status.