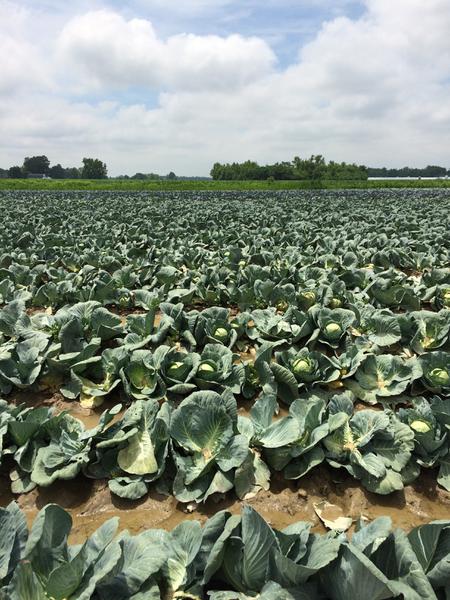
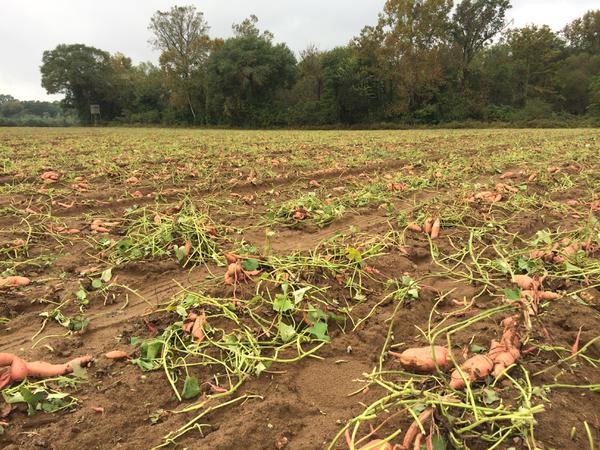
Vegetable growers can use many strategies to increase quality and yield. To boost productivity, they can optimize fertilization, irrigation, and pest and disease management, and they can plant improved varieties. An often overlooked method is to reduce field loss, which can amount to a significant portion of the harvested yield. In North Carolina and around the country, crops that are left unharvested in the field have the potential to increase yield by up to an estimated 20 percent. Another way to increase yield is to expand the range of product quality you sell to buyers that accept a wider range of quality, or even focus on “ugly” produce. Often, crops are left unharvested in response to market conditions, but these crops could be marketed with connections to more flexible buyers. When crops that could be used are lost in the field, it results in a double loss. There is a loss of potential yield, but also a loss of resource efficiency since significant chemical inputs and land are used in their production.
When Losses Are Measured, They Can Be Managed
The focus of this field note is to provide a simple technique for measuring unharvested crops, as these crops may be the best option for a source of greater yield.
Understanding why losses are occurring on the farm provides insight to potentially reduce those losses in the future. Determining the amount and type of these losses can help you make better production management decisions, such as whether to put more land in production, expand the harvest crew, slow the harvest, time field plantings differently, or return to the field again after the primary harvest. Knowing what volume and quality are left unharvested provides the opportunity to further market the crop, possibly to alternative markets.
Losses Occur Throughout the Supply Chain
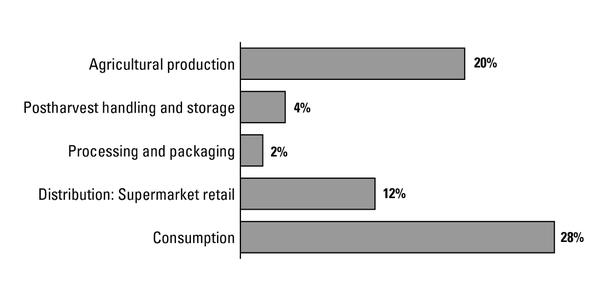
In the United States and other developed countries, significant losses occur throughout the supply chain (Figure 2). Sophisticated storage and logistics systems allow produce to move quickly from the farm to the consumer, maximizing shelf life. These and other postharvest handling and technology improvements have reduced losses in the middle of the supply chain.
Retailers use sales and produce quality control to ensure losses are minimized. The highest losses seem to result from consumer actions, such as choosing produce based on cosmetic appearance, storing produce improperly, or not planning meals. Second to that are estimated losses in production, which can occur at all stages of production and for a variety of reasons.
Losses Occur at All Stages of Production
In the production of a vegetable crop, losses can occur well before harvest. Losses in some stages of production may limit yield, and some will directly impact profit. Losses may result from lower than expected yield and related economic loss. An economic loss may also result from inefficient use of production resources, such as chemical inputs used to produce a crop that is then not fully used. It is important to focus on minimizing losses at each stage of production, as even minor losses can have a multiplying effect when it comes to profit.
There are many ways yield can be lost during crop production and harvest, such as through careless handling, spillage, plant breakage, and physical damage. Additionally, market factors can impact yield losses, resulting in economic losses to the grower. Because production requires the valuable resources of time, labor, fuel, chemical inputs, water, and land, these costs can also be lost when crops are left unharvested in the field. There are many other reasons crops can be left in the field, but the important thing to remember is that, despite these reasons, edible crops usually will be produced that could be harvested and marketed.
Some causes of losses in production:
- Labor shortages or labor arriving late
- Food safety risk in the field or industry-wide
- Overplanting on the farm or in the region
- Pest or disease damage
- Market price too low to justify harvesting further
- Field grading stricter than intended
- Inadequate storage on the farm
- Pollination failure leading to misshapenness
- Nutrient deficiency leading to irregular color
- Whole field doesn’t meet grade when the buyer needs it
- Weather problems, such as wind, rain, hail, or hurricane
- Contract specifications require a certain volume
- Import price or quality impacts the market
Measuring the Available Marketable Crop
Depending on the labor efficiency unique to each grower, there may be enough marketable product in the field to justify returning to harvest one more time, turning what would have been a loss into the potential for profit. Measuring that potential can help you in making this management decision. Making this measurement is much like determining harvest potential, but at the end of the season, and it only takes a few simple steps. This protocol is suitable for hand-harvested cucumber, tomato, bell pepper, squash, sweetpotato, watermelon, cantaloupe, green bean, eggplant, sweet corn, cabbage, and lettuce. It could be suitable for other crops as well.
End-of-season harvest potential protocol
- Note the row spacing and the acreage in the field. Gather equipment.
- Mark rows randomly in the field.
- Harvest rows.
- Sort samples into categories.
- Weigh and record samples in each category.
- Calculate an estimate of the potential in the field.
- Calculations for determining the estimated volume of available marketable and edible produce in the field are found below. Note the row spacing and the acreage in the field (Figure 3). This information is critical for calculating potential yield with this method. In addition, gather flags, a measuring tape, harvest containers, and a weighing scale. This is all the equipment you will need.
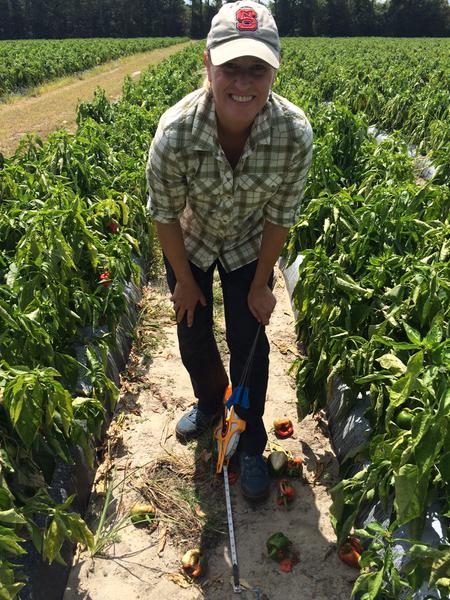
- Mark three sample rows for a 10-acre field. Flags can be used for marking, but other techniques would also work well (Figure 4). The sample row locations in the field should be randomly chosen in areas of the field that seem representative of field conditions. Sections of rows should be marked A, B, and C, for example, to a known length. Fifty feet works well with fruiting crops; 25 feet or less can be used if sampling speed is more critical than the accuracy of the estimate. Depending on the crop, one person should be able to make this assessment in 3 hours or less. Three rows are ideal for sampling in order to account for differences in field conditions and harvesting techniques used by farm personnel.
- Harvest each row. To accurately analyze what quality remains in the field, collect all of the remaining vegetables in the marked row lengths into any suitable harvest container. Even diseased, decayed, overly mature, sun-scalded, or damaged vegetables that remain attached to the plant should be harvested for this measurement; that information will be important for calculations. In determining what portion of the remaining crop is edible or marketable, collect all sizes, even if they are considered immature. This will determine how much of the remaining crop was damaged by disease or is inedible for another reason. Do not collect vegetables that have fallen to the ground and are no longer attached to the plant.
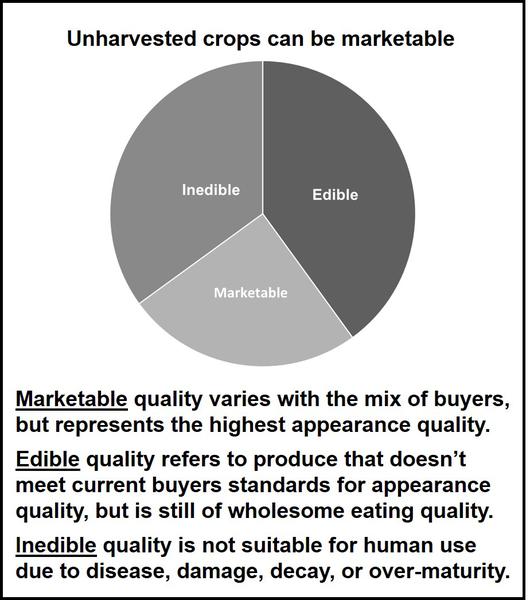
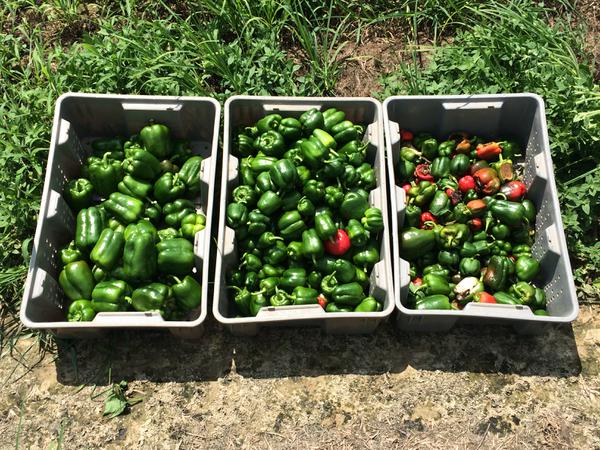
- Sort the collected samples from each row into three main categories: marketable, edible, and inedible (Figure 5 and Figure 6). These three categories will provide an overview of the potential remaining in the field and indicate whether it is traditionally marketable or simply edible, which could be marketed to an alternative buyer. Marketability is unique to every grower, based on their buyers’ specifications, which can be different from published U.S. Department of Agriculture standards.
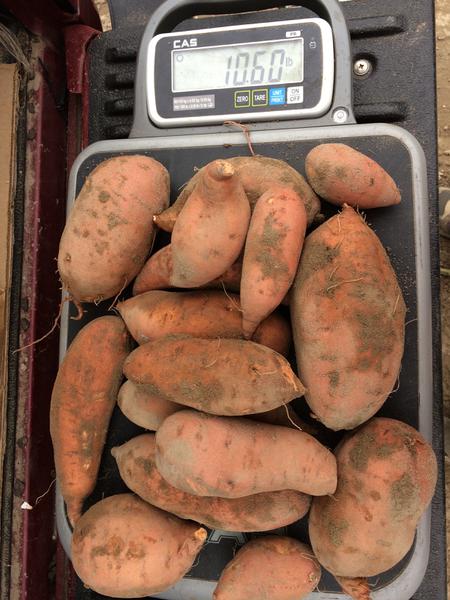
- Weigh each sample category by taking into account the tare weight of the container (Figure 7). Ensure the scale you are using is accurately balanced and zeroed, then record the weights. Data should be recorded in pounds for each of the three categories from each row A, B, and C. Total the marketable, edible, and inedible categories.
- Calculate the potential within each category. The calculation finds the area sampled first and then finds estimates of available volumes in the field for each of the three categories.
Calculate available produce in the field
Determine how much of the field you sampled. Multiply the number of rows by the length of the rows and by the row spacing. Sampling three 50-foot rows spaced 6 feet apart looks like this:
3 × 50 × 6 = 900 square feet in the sample
Total the weight of marketable produce found in the sample area. Set up a ratio with x serving as the unknown amount of marketable produce per acre. If 100 pounds were found in 900 square feet, and because an acre contains 43,560 square feet, the calculation looks like this:
(100 lbs ÷ 900 sq ft) = (x lbs ÷ 43,560 sq ft)
Solve for the unknown:
(43,560 sq ft)(100 lbs) = (900 sq ft)(x)
[(43,560)(100)] ÷ 900 = x
4,840 = x
The amount of marketable produce in one acre of this field is 4,840 pounds. Multiply by the number of acres to determine the remaining harvest potential in this field. In a 15-acre field, the calculation looks like this:
15(4,840) = 72,600 lbs remaining
Divide by the number of pounds in a box to determine how many boxes are potentially available. Repeat this calculation to estimate how much produce of edible quality is in the field if a buyer should be available.
Buyers May Be Becoming More Accepting of a Wider Range of Quality
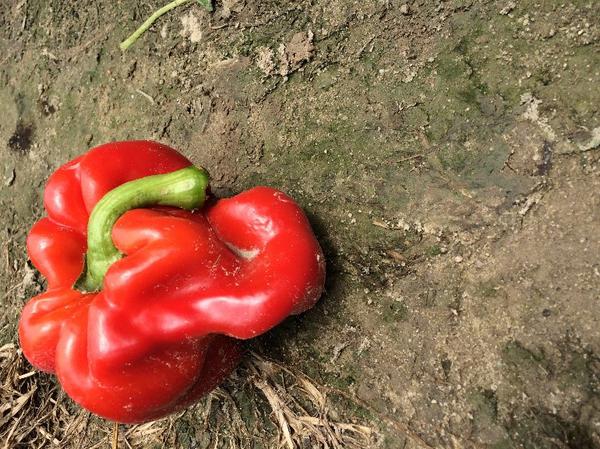
In many production regions, it is possible to connect with buyers that will accept a wider range of quality or that have more flexible specifications. Large national companies and smaller, regional distributors are beginning to offer programs that purchase blemished and misshapen produce in a developing trend that caters to consumer interest in “ugly” produce (Figure 8). Subscription box companies are starting to source produce that was once considered unmarketable to fill weekly boxes for customers. In addition, food banks are beginning to be able to pay for field-run produce in bins, reducing or eliminating the cost of packing. These prices are intended to cover the harvest cost and may or may not result in a profit of significance to the grower. To begin a relationship with an unfamiliar buyer, you might offer to send samples of the product quality you are interested in selling or attend grower-buyer meetups. For more information, connect with the Whole Crop Harvest Initiative through the Center for Environmental Farming Systems.
Consider Measurement of Available Volume in the Field for More Informed Management
Crops are often left unharvested because the grower has secured a profit and does not perceive the need to further use the crop. Management decisions are made much easier by being in the black. Consider production budgets, the size of the harvesting crew on the farm, and the speed at which they can harvest. Take an hour or two to measure what is left in the field. The amount left could translate into another truckload or two, which could mean an increase in your overall profit.
Additional Resources
Business for Social Responsibility (BSR). 2013. “Losses in the Field: An Opportunity Ripe for Harvesting.”
Food and Agriculture Organization of the United Nations (FAO). 2011. “Global Food Losses and Food Waste—Extent, Causes, and Prevention.” Rome, Italy.
Kantor, L. S., K. Lipton, A. Manchester, and V. Oliveira. 1997. “Estimating and Addressing America’s Food Losses.” USDA-ERS Food Review.
U.S. Department of Agriculture. 2015. “Selected New and Ongoing USDA Food Loss and Waste Reduction Activities.”
This material is based upon work that is supported by the National Institute of Food and Agriculture, U.S. Department of Agriculture, under award numbers 580143-02452 and 571385-02452 through the Southern Sustainable Agriculture Research and Education program.
Publication date: Feb. 26, 2018
Reviewed/Revised: March 6, 2023
AG-840
N.C. Cooperative Extension prohibits discrimination and harassment regardless of age, color, disability, family and marital status, gender identity, national origin, political beliefs, race, religion, sex (including pregnancy), sexual orientation and veteran status.

