
Where Can I Find Information on the Probable Last and First Dates of Freeze and Frost?
The National Centers for Environmental Information (NCEI), an office within the National Oceanic and Atmospheric Administration (NOAA), prepares tables outlining the probable dates associated with the last frost, freeze, and hard freeze in spring and the first frost, freeze, and hard freeze in fall for locations across the United States (Arguez et al. 2010). The probable dates are calculated from 30-year periods, with the current period of reference spanning 1981-2010. Updates to the freeze / frost date probabilities will likely be released within the next few years based on the 1991-2020 reference period.
The probabilities summarized in the freeze / frost tables offer valuable insight for scheduling planting and harvesting dates, as well as other decision-making related to freeze / frost avoidance. This factsheet describes the information contained in the freeze / frost tables and offers guidance on how to interpret the information.
Frosts, Freezes, and Hard Freezes
A freeze occurs when air temperature falls below 32°F. A hard freeze occurs when air temperature dips below 28°F. Frost occurs as a function of temperature and relative humidity, the amount of water vapor in the air relative to the air’s maximum water-holding capacity at a given temperature (Poling and Hopper 2017). A freeze can occur without a frost, and a frost can occur without a freeze. As a result, there is no single temperature threshold for the occurrence of frost, but the risk of frost is relatively higher once temperatures fall below 36°F (NWS Forecast Office 2019). Therefore, 36°F is the temperature associated with the occurrence of frost in NCEI’s freeze / frost tables. For more information on the conditions needed for a freeze or frost, refer to the North Carolina Climate Office’s webpage on southeast frosts and freezes.
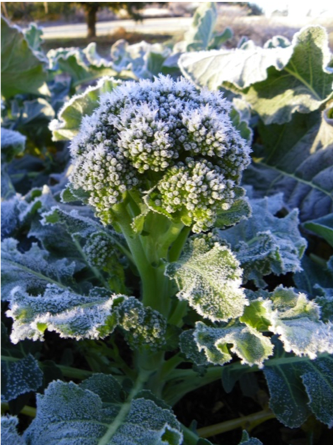
Broccoli with a dusting of frost.
Reading the Freeze / Frost Tables
North Carolina has 120 weather stations for which freeze / frost tables are available (Figure 1). Figure 2 presents an example of these tables, specifically for the Raleigh State University station, with five section labels. Details on the content of these sections are provided.
- Current Location and Station: The latitude and longitude coordinates for each station are provided, as is the land elevation where the station is located.
- Temp: Temperature thresholds are in degrees Fahrenheit (F) and range from 36°F to 16°F in 4°F increments. The thresholds that are generally most important for agricultural decision-making are 36°F (frost), 32°F (freeze), and 28°F (hard freeze).
- Spring Freeze Dates (Month / Day): Spring dates associated with the last freeze / frost at different probability levels are provided. Section 3 of the table includes nine columns: 0.1 – 0.9, which refer to probability levels of 10% to 90%. Although the information across these columns is valuable, the columns associated with probability levels of 0.1, 0.5, and 0.9 usually offer the most practical insight. Probability levels of 0.1 and 0.9 capture the overall range, whereas a probability level of 0.5 corresponds to the middle of the range (also referred to as the “median”). The dates included in these columns correspond to the probability of the listed dates being the last day of spring when temperatures fall below a freeze / frost threshold (36°F, 32°F, or 28°F) for the specified station. For example, at the Raleigh State University station, there is a 90% chance that a frost (36°F) will occur on or after March 28 (Figure 3), a 50% chance that a frost will occur on or after April 12, and a 10% chance that a frost will occur on or after April 26. Said another way, there is a 10% chance that the last frost will occur before March 28, a 50% chance that the last frost will occur before April 12, and a 90% chance that the last frost will occur before April 26.
- Fall Freeze Dates (Month / Day): Fall dates associated with the first freeze / frost at different probability levels are provided. Similar to Section 3 on Spring Freeze Dates, Section 4 is divided into nine columns: 0.1 – 0.9, which refer to probability levels of 10% to 90%. Dates in these columns correspond to the probability of the listed dates being the first day of fall when temperatures fall below a freeze / frost threshold for the specified station. For example, at the Raleigh station, there is a 10% chance that the first hard freeze (28°F) will occur on or before November 7, a 50% chance that the first hard freeze will occur on or before November 25, and a 90% chance that the first hard freeze will occur on or before December 14.
- Freeze Free Period (Days): This is the number of days between the last spring freeze and first fall freeze. Section 5 is divided into nine columns: 0.1 – 0.9, which refer to probability levels of 10% to 90%. Values listed in these columns correspond to the probability (10%, 50%, or 90%) that a number of back-to-back days without temperatures falling below a freeze / frost threshold will occur. For example, at the Raleigh station there is a 10% chance that there will be 278 continuous days between the last hard freeze (28°F) in spring and the first hard freeze in fall, a 50% chance that there will be 252 continuous days without a hard freeze, and a 90% chance that there will be 226 continuous days without a hard freeze.
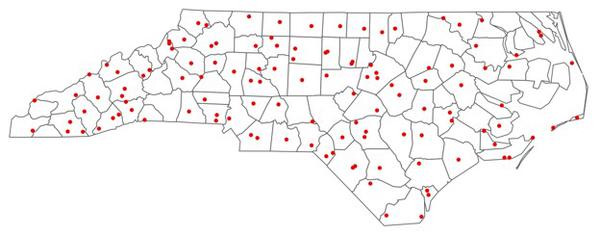
Figure 1. Weather stations (120 total) in North Carolina with available freeze / frost tables.
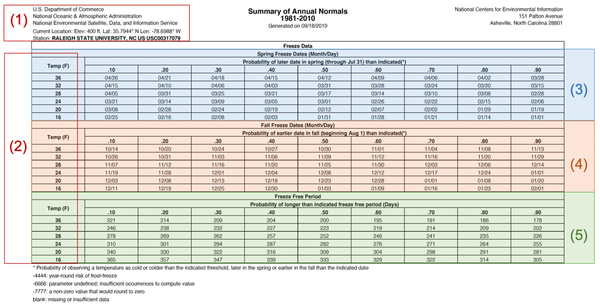
Figure 2. Sample freeze / frost table for the weather station Raleigh State University, North Carolina.
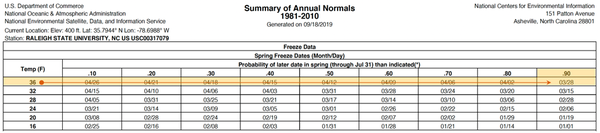
Figure 3. Example: To identify there is a 90% probability that a frost will occur on or after 3/28, start at the Temp column. Find the row corresponding to 36°F. Follow to where it intersects the .90 column.
Interpreting Probabilities
The freeze / frost tables consider nine probability levels in increments of 10: 10%, 20%, 30%, 40%, 50%, 60%, 70%, 80%, and 90%. The nine probability levels offer a high level of detail on how the probabilities of freeze and frost vary. Here, we focus on probability levels of 10%, 50%, and 90%, as these levels capture different levels of precision. A probability level of 10% means that, based on past temperature measurements, it is expected that the condition described will occur in 1 out of 10 years on average. Similarly, a probability level of 90% indicates that the condition described is expected to occur in 9 out of 10 years on average.
The values associated with the probability levels were calculated by analyzing weather data records collected from January 1, 1981 to December 31, 2010. These probability levels capture past trends, but trends from the past might not correspond to what we will experience today or in the future. Therefore, when interpreting these probability levels, keep in mind that the dates and values presented in the tables are best guesses of what might occur in a given year based on trends observed in previous years.
To use the dates and values summarized in the freeze / frost tables to inform selection of planting and harvesting dates, interpret the information as follows:
- Spring and Fall Freeze Dates (Month / Day):
90%: Low precision, high risk. Use this date for risk-seeking / aggressive decision-making.
50%: Medium precision, medium risk. Use this date for risk-tolerant / moderate decision-making.
10%: High precision, low risk. Use this date for risk-averse / conservative decision-making.
- Freeze Free Period (Days):
90%: High precision, low risk. Use this date for risk-averse / conservative decision-making.
50%: Medium precision, medium risk. Use this date for risk-tolerant / moderate decision-making.
10%: Low precision, high risk. Use this date for risk-seeking / aggressive decision-making.
Additional Resources
- Summary of Annual Normals 1981-2010
The freeze / frost tables for all stations in North Carolina with available freeze / frost date probabilities.
- Midwestern Regional Climate Center’s Vegetation Impact Program Freeze Maps
National maps illustrating the dates of the first freeze or hard freeze in fall, and last freeze or hard freeze in spring. These maps combine climatological probabilities and current seasonal information.
- Southeast Regional Climate Center Historical Climate Summaries
Station-level climate summaries for sites across the United States, presented both as tables and graphics for probability levels ranging from 10% to 90% and temperatures from 20°F to 36°F.
- AgroClimate Freeze Risk Probabilities
Interactive maps illustrating the probable dates (10%, 50%, and 90% probability levels) of the first and last freeze / frost events at the county scale for the southeastern United States. Users can select additional criteria such as ENSO phase and temperature (20°F-32°F).
References
Arguez, A, I. Durre, S. Applequist, M. Squires, R. Vose, X. Yin, and R. Bilotta. 2010. NOAA’s U.S. Climate Normals (1981-2010). NOAA National Centers for Environmental Information. ↲
NWS Forecast Office. NOAA National Weather Service. Accessed on 2019-09-30. Frost Freeze Information and Climatology Maps. Raleigh, NC. ↲
NOAA National Centers for Environmental Information. Accessed on 2019-09-30. When to Expect Your Last Spring Freeze. ↲
Poling, E. Barclay (updated by Brandon Hopper). 2017. Comments on Types of Spring Cold Events in North Carolina. NC State Extension. ↲
Acknowledgments
The authors would like to thank Pam Knox of University of Georgia, Rebecca Cumbie Ward and Charlotte Glen of NC State University for constructive input that improved the editorial quality of this publication.
Publication date: Feb. 28, 2020
Reviewed/Revised: Dec. 11, 2024
AG-873
N.C. Cooperative Extension prohibits discrimination and harassment regardless of age, color, disability, family and marital status, gender identity, national origin, political beliefs, race, religion, sex (including pregnancy), sexual orientation and veteran status.