Determining nitrogen rates for a given field, crop, and year is always difficult due to complex interactions between soil, weather, management practices, and plant varieties. Nitrogen rate recommendations from soil test reports are not reliable; growers should not use soil tests to make decisions about nitrogen rate application. Instead in North Carolina, we recommend using the Realistic Yield Expectation (RYE) database. This online tool recommends the appropriate nitrogen rate when you select your county, soil series, and crop.
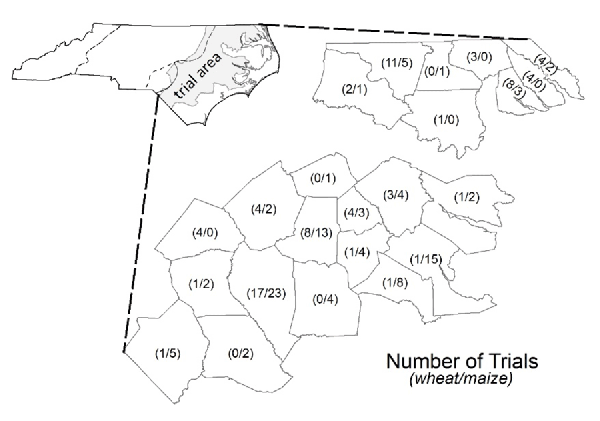
North Carolina State University continually conducts nitrogen rate trials on corn, wheat, and other commodity crops to support and validate the RYE database. On-farm trials were established to reflect the individual grower’s nitrogen rate with additional treatments of ±25% of that nitrogen rate. These trials occurred from 2013 to 2017 throughout the coastal plain (Figure 1).
Trials were set up as 13 equal-width strips prior to N fertilization with four replicates of the three rates—the farmer’s standard nitrogen (N) rate (Nstd); 25% more than the standard rate (N+25%); 25% less than the standard rate (N-25%)—and one calibration strip used for nitrogen rate adjustments. Strip lengths were a minimum of 250 ft, while strip width ranged from 10 ft to 40 ft depending on plant spacing, crop, and width of the combine header. Farmer-owned yield monitors were used to harvest the strips, and the yield data were transferred to researchers at North Carolina State University for review, cleaning, and data analysis.
Crop management was based on farmers’ standard production practices, and information was collected on variety; seed population; prior crop; tillage practice; planting and harvest dates; and fertilizer applications (source and rate). Fertilizer source was always urea-ammonium-nitrate (UAN), and it was split-applied in both wheat (fall and late winter) and corn (planting and layby). In wheat, 54% of the trials followed corn, 24% cotton, 12% tobacco and peanuts, and the remaining 10% soybeans, sweet potatoes, or sorghum. Tillage included 65% conventional, 27% no-till, and 8% strip-till. The majority of growers (60%) planted between 140 to 180 lbs ac-1 of wheat seed with 75% drilled at a 7.5’ spacing, and the remaining 25% of growers broadcast. In corn, more than 63% of the trials followed soybeans, with the remaining trials planted after cotton (15%), peanuts (10%), corn (8%), or sweet potato or tobacco (4%). Tillage operations included 44% strip-till, 39% conventional, and 17% no-till. Populations ranged from 23,000 to 34,000 seeds ac-1 with most trials planting between 26,000 and 30,000 seeds ac-1. Seed varieties varied but were typically classed as mid- to long-season varieties.
The grower-selected N rate in wheat ranged from 98 to 134 lb N ac-1 and averaged 117 lb N ac-1, whereas in corn, the grower-selected rate was 159 to 207 lb N ac-1 with an average rate of 174 lb N ac-1. In 79 site-years of wheat, N-25%, Nstd, and N+25% rate treatments were the agronomic best in 37%, 35%, and 28% of the trials, respectively. In 100 site-years of corn, N-25%, Nstd, and N+25% rate treatments were the agronomic best in 58%, 30%, and 12% of the trials, respectively. Growers’ selected nitrogen rates in wheat were similar to recommendations from the North Carolina RYE database, while corn nitrogen rates averaged 43 lb ac-1 higher; however, N-25% rates, which were best 58% of the time in corn, were similar to RYE nitrogen rate. These results support the use of the RYE online database as a nitrogen rate decision tool and demonstrate that most farmers in North Carolina provide adequate but not excessive nitrogen to their wheat and corn; in some cases, farmers could slightly lower their nitrogen rates on corn without the risk of a significant yield drop. Beyond affirming the use of the RYE database, results from the on-farm trials suggest that improved approaches to nitrogen rate selection and nitrogen efficiency will likely require in-season adjustments to yield-based nitrogen rates that incorporate local management and environmental conditions throughout the growing season.
References
Austin, Robert, Deanna Osmond, and Shelby Shelton. 2019. Optimum Nitrogen Rates for Maize and Wheat in North Carolina. Agronomy Journal III, no. 5: 1-11.
Acknowledgements
This project was funded by North Carolina Environmental Defense Fund and five crop consultants: Billy McLawhorn, Hank Haddock, and Chad Docsh of McLawhorn Crop Services, Inc.; Daniel Fowler of Fowler Crop Consulting, Inc.; and Stan Winslow of Tidewater Agronomics, Inc. Al Averitt of Protech Advisory Services, Inc., participated in the trials along with North Carolina State University Crop and Soil Sciences Department researchers (Robert Austin, Daniel Hedgecock, and Deanna Osmond). North Carolina State University specialists performed data analysis and interpretation. The conclusions are those of the authors and do not necessarily reflect the positions of the funders or advisors.
Publication date: Aug. 15, 2019
Reviewed/Revised: May 28, 2024
AG-864
N.C. Cooperative Extension prohibits discrimination and harassment regardless of age, color, disability, family and marital status, gender identity, national origin, political beliefs, race, religion, sex (including pregnancy), sexual orientation and veteran status.
N.C. Cooperative Extension prohibits discrimination and harassment regardless of age, color, disability, family and marital status, gender identity, national origin, political beliefs, race, religion, sex (including pregnancy), sexual orientation and veteran status.

