
Southern Foresters’ Observations of Threats to Forest Health and Implications for Continuing Education
Introduction
The Southern Forest Futures report details that southern forests experience several threats to health and productivity (e.g., warming temperatures, invasive plants, pest infestations), and suggests that these threats are expected to increasingly stress forests through the 21st century (Wear & Greis, 2013). Threats to forest health exact an economic, conservation, and aesthetic toll on southern forests with impacts to the wood products industry, ecosystem services, outdoor recreation, and threatened and endangered species (Holmes, Aukema, Von Holle, Liebhold, & Sills, 2009; Mack et al., 2000; Westbrooks, 1998). Planted pine (Pinus spp.), an economically-important part of the South’s wood products industry, may be particularly susceptible to some forest stressors. Cogongrass (Imperata cylindrica L.) and Japanese honeysuckle (Lonicera japonica), two common invasive plant species, reduce vigor and growth of naturally regenerated and planted loblolly (P. taeda L.) and shortleaf (P. echinata M.) pine (Skulman, Mattice, Cain, & Gbur, 2004; Jose, Cox, Miller, Shilling, & Merritt, 2002). Among invasive pests, southern pine beetle (SPB) can be particularly damaging. In the 1999-2002 SPB outbreak, over one million acres of pine forest valued at more than $1.5 billion were destroyed (Wear & Greis, 2013). Millions of acres across the South continue to be at high risk of SPB even as forecasts of pest outbreaks project increased activity (Wear & Greis, 2013; Rivera Rojas, Locatelli, & Billings, 2010). Warming temperatures are likely to exacerbate invasive plant and pest infestations as well as extend spring and fall fire seasons and acreage burned (McNulty et al., 2012; Flannigan, Stocks, & Wotton, 2000; Hanson & Weltzin, 2000), increase drought impacts (McNulty et al., 2012), and possibly affect seedling selection, source, and time of planting (Langvall, 2011; Millar, Stephenson, & Stephens, 2007; Schmidtling, 1994).
Forest management strategies to increase resistance, resiliency, and adaptive capacity of southern forests to past and emerging threats (i.e., adaptive forest management), is critical to retaining and protecting their ecological and economic value (Spittlehouse & Stewart, 2003). A growing literature database documents the perceptions and educational needs of natural resource professionals and landowners concerning invasive plants and pests (Kokotovich & Zeilinger, 2011), extreme weather events (DeWalle, Buda, & Fisher, 2003), and climate change and variability (Burnett, Vuola, Megalos, Adams, & Monroe, 2014; Grotta, Creighton, Schnepf, & Kantor, 2013; Labriole & Luzadis, 2011; Riddle, 2011). Additional data is needed to assess relative differences in threats among states, prioritize threats within states, and tailor educational outreach based on prioritization schemes. We surveyed southern professional foresters to assess a) how foresters perceive multiple threats to forest health and b) how foresters’ responses may be spatially correlated across the South. Results presented herein are key to developing locally-relevant educational programs and materials about adaptive management.
Methods
In January of 2013, Pine Integrated Network: Education, Mitigation, and Adaptation Project (PINEMAP) collaborators sent a 24-question web-based survey to 6,607 usable contacts from professional forestry organizations, government databases, Cooperative Extension lists, forestry-related organizations, state registered forester lists, and personal contacts. Questions aimed to gauge perceptions of threats to forest health, interest in continuing education opportunities, and use of weather and climate tools (Morris, 2014). Survey design and implementation followed the Tailored Design Method for internet and email surveys to ensure proper survey implementation and repeated contact (Dillman, Smyth, & Christian, 2009). Questions were compared to other surveys about threats to natural resources (e.g. Maibach, E., Roser-Renouf, C., & Leiserowitz, A., 2009) to ensure consistency of questions and format. The survey used less controversial terminology to avoid politically-charged language such as global warming and climate change. We administered a pilot survey to a random sample of 100 respondents before launching the full survey in February of 2013.
More than 1,782 foresters completed the survey at a 27% response rate and non-response bias was not detected. After excluding respondents who did not self-identify as a forester and/or do not work exclusively in the southern U.S., results were used from 858 foresters were used for analysis. Responding foresters worked in all thirteen southern states: Alabama, Arkansas, Florida, Georgia, Kentucky, Louisiana, Mississippi, North Carolina, Oklahoma, South Carolina, Tennessee, Texas, and Virginia.
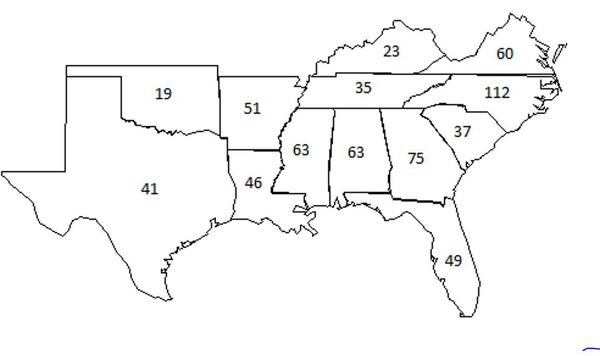
We analyzed to what extent southern foresters and their clients have observed a change in the frequency and/or severity of seventeen threats that affect pine forests. Questions were related to changes in seasonal temperatures, rainfall, extreme events, planting, invasive plants, and damage from pests and disease. Responses were measured with an ordinal Likert-type scale where categorical forced-choice options were never (1), rarely (2), occasionally (3), frequently (4), and very frequently (5). Differences in foresters’ responses for each question among southern states were compared with an Analysis of Variance (ANOVA). When p<0.05, pairs of states were evaluated using Tukey’s Honestly Significant Differences (HSD) correction for multiple comparisons in SAS 9.4 using PROC GLM. Foresters working exclusively in each state and forested working in at least three southern states (hereafter, multi-state foresters) were compared to test for differences in threat perceptions among states. This comparison scheme ensured independence of state and multi-state group samples. Sample sizes for single-state foresters are shown in Figure 1. There were 184 multi-state foresters.
Figure 1. Sample sizes of foresters working in a single southern state.
Following state comparisons, we evaluated to what extent spatial correlations were present in observations of forest threats using responses from single-state foresters (n=674). Spatial correlation was computed using Moran’s I and Geary’s c (Geary, 1954) statistics using the Monte Carlo approach in R version 3.0.3. Both test statistics report the likelihood of spatial autocorrelation (i.e., that adjacent states have similar or dissimilar responses beyond what is expected by random chance). Moran’s I and Geary’s c statistics are standardized, facilitating hypothesis testing and comparisons. Moran’s I statistic is a measure of global spatial autocorrelation and is more sensitive to extreme values. Values of I range from -1 (strongest negative spatial autocorrelation) to +1 (strongest positive spatial autocorrelation). Geary’s c statistic is similar to Moran’s I, but c is more sensitive to large differences between nearby values (i.e., responses of adjacent states; Fortin, Dale, & ver Hoef, 2002). Geary’s c has values ranging from 0 (strongest positive spatial autocorrelation) to 2 (strongest negative spatial autocorrelation). Both statistics are accompanied by p-values. A significant p-value indicates that the observed spatial pattern is very unlikely to have occurred if the mean response in one state had no impact, positive or negative, on any other state’s mean response.
Results
Southern foresters report observing greater frequency and/or severity of invasive plant infestations, overall change in climate, longer dry periods or drought conditions, warmer winters, and hotter summers at least on occasion (Table 1). Variables with the least observed change include increased soil erosion and cooler summers. Notably, foresters are observing warmer-than-normal temperatures in winter and summer, but cooler summers and winters are observed with rarity. Single-state and multi-state foresters’ reports of observed changes in forest threats differed significantly in at least one pair of states for ten questions. Generally, Kentucky, Oklahoma, and Florida report observations of forest threats at a higher rate than other states. Conversely, responses from foresters working in Mississippi and Alabama indicate that they rarely observed increased frequency and/or severity of threats. Responses of multi-state foresters were close to overall mean responses. Here, we discuss regional results and state differences in southern foresters’ observations of threats to forest health. All reported statistically significant differences are at α=0.05 significance level.
| Climate Observation Questions: "have you experienced...?" | Mean | Standard Deviation |
|---|---|---|
| Greater Frequency and/or Severity of Invasive Plant Infestationsa | 3.36 | 1.05 |
| Longer Dry Periods or Drought Conditionsa | 3.27 | 0.90 |
| Overall Change in Climatea | 3.21 | 1.04 |
| Warmer Winters | 3.20 | 0.90 |
| Hotter Summersa | 3.03 | 0.98 |
| Drier Plantinga | 2.88 | 0.87 |
| Greater Frequency of Extreme Weather Events | 2.77 | 1.01 |
| More Frequent or Extreme Rainfall Eventsa | 2.61 | 0.88 |
| Change in Length of Growing Season | 2.61 | 0.96 |
| Greater Frequency and/or Severity of Fire Eventsa | 2.60 | 1.06 |
| Greater Frequency and/or Severity of Floodinga | 2.49 | 0.85 |
| Greater Frequency and/or Severity of Insect Damagea | 2.46 | 0.88 |
| Greater Frequency and/or Severity of Disease Damagea | 2.40 | 0.90 |
| Wetter Planting | 2.40 | 0.72 |
| Cooler Winters | 2.25 | 0.65 |
| Increased Soil Erosion | 2.16 | 0.80 |
| Cooler Summers | 2.08 | 0.69 |
| a Mean significantly (p<0.05) differs between at least one pair of states. | ||
Overall Change in Climate
Foresters responded to the following statement: “In my lifetime, I have noticed a change in the climate (longer, hotter summers; warmer, drier winters; cooler, moister summers; earlier, drier springs; etc.).” Responses ranged from strongly disagree (=1) to strongly agree (=5). Foresters reported an overall change in climate that ranged from a mean of 2.82 in Mississippi to 3.76 in Kentucky. Mississippi and Kentucky were the only pair of states to significantly differ in their reported observation of overall change in climate.
Seasonal Temperatures
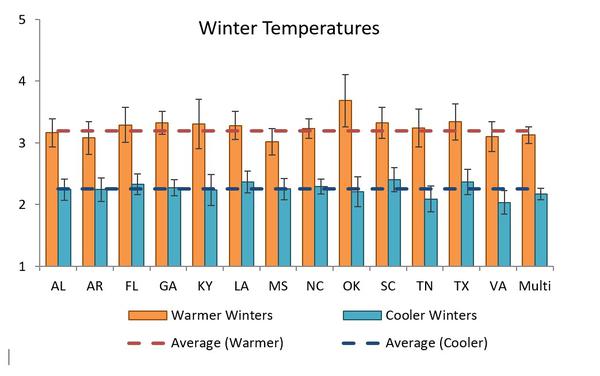
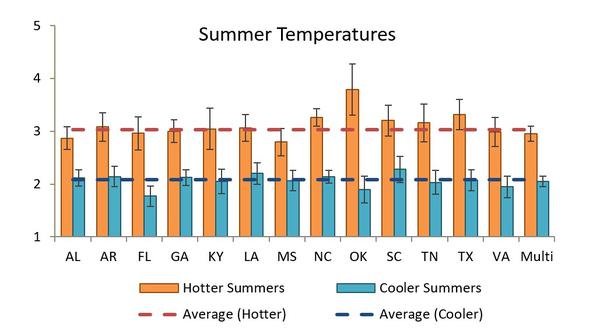
Southern foresters reported higher frequency of warmer than cooler winters (Figure 2) and hotter than cooler summers (Figure 3). Mean responses did not differ among states for reported observations of cooler winters, warmer winters, or cooler summers. Reports of hotter summers differed substantially, ranging from 2.79 (Mississippi) to 3.79 (Oklahoma). Foresters working in Oklahoma reported hotter summers significantly more than Mississippi, Alabama, and multi-state foresters (Figure 3).
Figure 2. Means and confidence intervals for single-state and multi-state southern foresters reporting the frequency with which they observe warmer winters (F=1.19, p=0.2842) and cooler winters (F=1.29, p=0.2100). Responses were measured with a Likert-type scale that ranges from strongly disagree (1) to strongly agree (5).
Figure 3. Means and confidence intervals for single-state and multi-state southern foresters reporting the frequency with which they observe hotter summers (F=2.24, p=0.0070) and cooler summers (F=1.46, p=0.1277). Responses were measured with a Likert-type scale that ranges from never (1) to very frequently (5).
Moisture Regime and Fire
Foresters reported how often they observed three factors related to moisture regime (i.e., rainfall, flooding, and drought) and the frequency and/or severity of fire. Foresters rarely to occasionally observed more frequent or extreme rainfall events and greater frequency and/or severity of flooding events (Table 1). Kentucky foresters reported observing more frequent and/or extreme rainfall events significantly higher than reports from Texas. Tennessee foresters reported experiencing greater frequency and/or severity of flooding significantly higher than reports from Texas, Alabama, and Virginia.
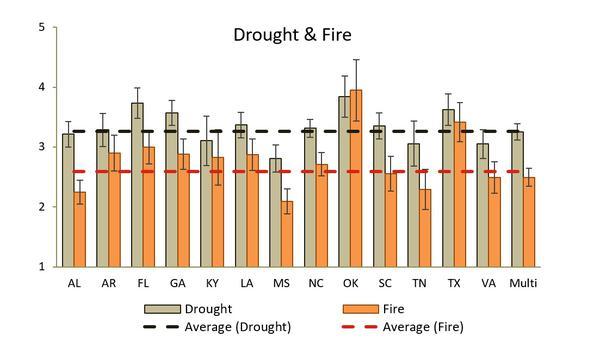
Foresters reported occasional to frequent observations of longer dry periods and/or drought conditions throughout the South. Oklahoma foresters reported observing longer dry periods and drought conditions (3.84) with the highest frequency followed by Florida foresters (3.73; Figure 4). Mississippi foresters had the lowest average response (2.81). Mississippi foresters observed significantly less change in drought conditions compared to Oklahoma, Florida, Texas, Georgia, North Carolina, and multi-state foresters.
Reports of increased frequency and/or severity of fire events averaged 2.60 in the South, but some states had mean responses much higher. Oklahoma foresters reported frequently (3.95) observing increased frequency and/or severity of fire events (Figure 4). Oklahoma foresters’ frequent observations of increased fire frequency and severity is likely related to their frequent observations of longer dry periods and drought conditions, warmer winters, and hotter summers. Oklahoma foresters’ observance of fire frequency and severity was significantly higher than all other groups of foresters except respondents from Texas.
Figure 4. Means and confidence intervals of single-state and multi-state southern foresters’ observations of longer dry periods/drought conditions (F=4.54, p<0.0001) and increased frequency/severity of fire events (F=8.43, p<0.0001). Responses were measured with a Likert-type scale that ranges from never (1) to very frequently (5).
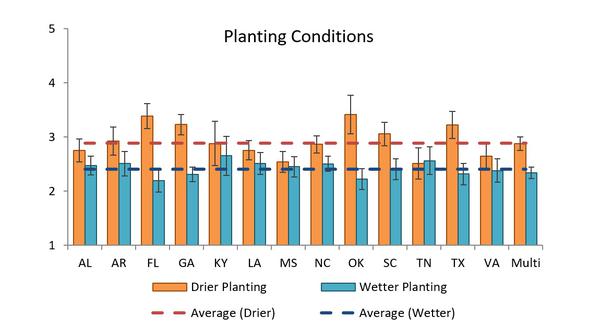
Planting
Foresters from Oklahoma, Florida, Georgia, and Texas reported that frequency of drier planting conditions is increasing occasionally to frequently (Figure 5). Foresters from states with the highest observance of drier planting conditions also consistently had the fewest observations of wetter planting conditions. Mean responses indicate that wetter planting is observed rarely to occasionally throughout the South with no significant differences among state mean responses. These results may indicate soil moisture at time of planting for Oklahoma, Florida, Georgia, and Texas is trending toward drier planting conditions.
Figure 5. Means and confidence intervals for single-state and multi-state southern foresters reporting frequency with which they have observed drier planting conditions (F=5.15, p<0.0001) and wetter planting conditions (F=1.39, p=0.1582). Responses were measured with a Likert-type scale that ranges from never (1) to very frequently (5).
Impacts to Forest Health: Invasive Plants, Insects, and Disease
Southern foresters observed a greater increase in invasive plant infestations than any other climate change or impact variable tested by our survey. Kentucky foresters frequently observed increased invasive plant infestations with a mean response of 4.01 (“frequently”), the highest response from any state for any climate question. Kentucky foresters report significantly higher invasive plant increases than Texas, Arkansas, and multi-state foresters.
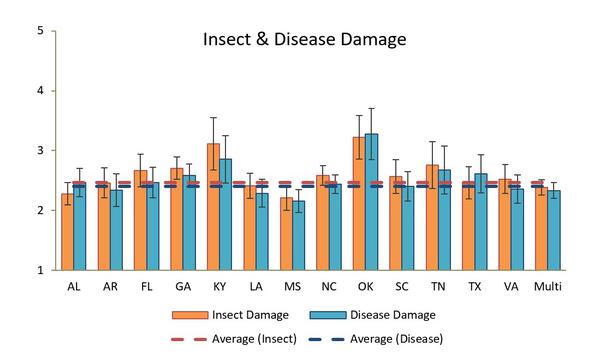
Foresters from Oklahoma and Kentucky reported observing the greatest increase in the frequency and/or severity of insect damage. Oklahoma and Kentucky foresters reported significantly more observations of insect damage than Mississippi, Alabama, and multi-state foresters (Figure 6). Oklahoma foresters also report the greatest increase in the frequency and/or severity of disease damage. As with flooding, even the highest-scoring state (Oklahoma) reported observing increased disease damage only on occasion whereas all other states fell between rarely and occasionally (Figure 6).
Figure 6. Means and confidence intervals of single-state and multi-state southern foresters’ observations of greater frequency and/or severity of insect (F=3.64, p<0.0001) and disease (F=2.84, p<0.0005) damage. Responses were measured with a Likert-type scale that ranges from never (1) to very frequently (5).
Spatial Trends
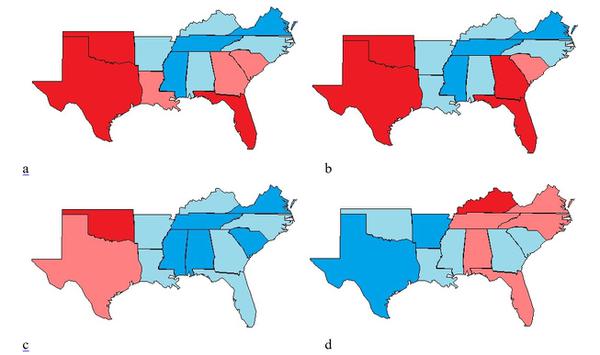
We explored the tendency of adjacent states to have similar or dissimilar reports of threats to forest health (i.e., spatial autocorrelation) using Moran’s I and Geary’s c statistics. There was significant (p<0.05) evidence of positive spatial autocorrelation for four observations of forest threats: longer dry periods or drought conditions, greater frequency and/or severity of fire events, drier planting, and greater frequency and/or severity of invasive plant infestations (Figure 7). Foresters’ observations were positively correlated across the spatial domain such that foresters working in one state generally had similar observations to the foresters of neighboring states. Observations with significant spatial autocorrelation (i.e., dissimilar responses) also had at least one pair of states whose foresters significantly differed in their mean responses.
When responses to questions concerning drought and drier planting were evaluated, mean responses of foresters from Florida, Oklahoma, Texas, and Georgia were highest while states at the South’s center (e.g., Mississippi, Alabama, Tennessee) consistently had low mean responses. Western states (Oklahoma and Texas) have the highest mean responses concerning fire frequency/severity while the lowest mean responses occur exclusively in the east (i.e., Georgia, Virginia, Tennessee, Alabama, Mississippi). In contrast, the highest mean frequency or severity of invasive plant infestations are primarily located in the northeastern quadrant of the South (with the exceptions of Florida and Alabama), with the lowest mean responses generally located in the western quadrants of the South.
Figure 7. Southern foresters’ reports of four threats to forest health had positive spatial autocorrelation: increase in frequency and/or severity of a) dry conditions and/or drought (Moran’s I=0.2903, Geary’s c=0.5718), b) drier planting (Moran’s I=0.2905, Geary’s c=0.6654), c) fire (Moran’s I=0.3330, Geary’s c=0.5057), and d) invasive plant infestations (Moran’s I=0.3931, Geary’s c=0.4766). States are grouped by quartiles with the lowest means (i.e., threat underwent little to no change) in the first quartile (dark blue) and the highest means (i.e., threat has substantially increased) in the fourth quartile (dark red).
Discussion & Implications for Continuing Education
Southern foresters across the South observed greater frequency and/or severity of invasive plant infestations, overall change in climate, longer dry periods or drought conditions, warmer winters, and hotter summers. Other threats to forest health (e.g., fire and drier planting) were observed with greater frequency and/or severity in select states (e.g., Texas and Oklahoma), indicating that these threats may be good candidates for local educational outreach programs. Survey data are susceptible to confirmation bias and could be influenced by survey timing. For example, our survey was conducted following Texas’ worst drought on record (Nielsen-Gammon, 2011), and survey results may be different if conducted during a period without record drought. However, southern foresters’ reports of threats to forest health are consistent with physical data and modelling efforts for warmer temperatures, fire events, and invasive plant, pest, and disease infestations (Intergovernmental Panel on Climate Change, 2015; Wear & Greis, 2013; McNulty et al., 2012).
Due to differences in foresters’ observations of forest threats among southern states, there is a need to create continuing education programs tailored to state-specific concerns. These regional and statewide survey results can provide vital information for the development of relevant programs and educational materials that target specific forester concerns – the key that potentially unlocks resilient forest management. For example, audiences in Kentucky may be most interested in programs addressing invasive plant infestations and insect damage whereas fire, drought, and drier planting would be more appropriate in Oklahoma and Texas.
Programs may also differ in their approach and method of delivery based on the receptivity of audiences to adaptive forest management, particularly when threats may be augmented by climate change. Morris (2014) demonstrated that foresters who accept climate change are more likely to observe climatic changes and believe that climate change will require different forest management strategies. If foresters are not experiencing or observing climatic change or other forest threats, their perceptions of climate science and attitudes about climate education, Extension programs, and adaptive forest management will be affected (Lenart & Jones, 2014). Programs can explicitly address climate aspects of adaptive management in states with foresters reporting more climatic changes (e.g., seasonal temperature changes). Extension and other outreach professionals in states with fewer observations of forest threats may choose to focus on a few local threats to forest health and/or capture the interest of foresters after an extreme event (e.g., record drought, extreme windthrow). Tailoring delivery to meet local needs and observations will be critical to advance adaptive management to increase profitability while reducing risk.
Southern foresters reporting the frequency with which they observe warmer winters /cooler.
R. Greene CC BY 4.0
Southern foresters reporting the frequency with which they observe hotter summers.
R. Greene CC BY 4.0
Southern foresters reporting frequency with which they have observed drier planting conditions.
R. Greene CC BY 4.0
Southern foresters’ observations of greater frequency and/or severity of insect & disease.
R. Greene CC BY 4.0
References
Burnett, R. E., Vuola, A. J., Megalos, M. A., Adams, D. C., & Monroe, M. C. (2014). N.C. Cooperative Extension professionals’ climate change perceptions, willingness, and perceived barriers to programming: An educational needs assessment. Journal of Extension [On-line], 52(1) Article 1RIB1.
DeWalle, D. R., Buda, A. R., & Fisher, A. (2003). Extreme weather and forest management in the mid-Atlantic region of the United States. Northern Journal of Applied Forestry, 20(2), 61-70.
Dillman, D. A., Smyth, J. D., & Christian, L. M. (2009). Internet, mail and mixed-mode surveys: The tailored design method (3rd ed.). Hoboken, NJ: John Wiley & Sons, Inc.
Flannigan, M. D., Stocks, B. J., & Wotton, B. M. (2000). Climate change and forest fires. Science of the Total Environment, 262(3), 221-229.
Fortin, M. J., Dale, M. R. T., & ver Hoef, J. (2002). Spatial analysis in ecology. In A. H. El-Shaarawi & W.W. Piegorsch (Eds.), Encyclopedia of Environmentrics Volume 4 (pp. 2051-2058). Chichester, England: John Wiley & Sons, Ltd.
Geary, R. C. (1954). The contiguity ratio and statistical mapping. The Incorporated Statistician, 5(3), 115-127, 129-146. Retrieved from: http://www.jstor.org/stable/2986645
Grotta, A. T., Creighton, J. H., Schnepf, C., & Kantor, S. (2013). Family forest owners and climate change: Understanding, attitudes, and education needs. Journal of Forestry, 111(2), 87-93.
Hanson, P. J., & Weltzin, J. F. (2000). Drought disturbance from climate change: Response of United States forests. The Science of the Total Environment, 262(3), 205-220.
Holmes, T. P., Aukema, J. E., Von Holle, B., Liebhold, A., & Sills, E. (2009). Economic impacts of invasive species in forests: Past, present, and future. Annals of the New York Academy of Sciences, 1162, 18-38.
Intergovernmental Panel on Climate Change. (2015). The Synthesis Report of the Fifth Assessment Report: Summary for Policymakers. Intergovernmental Panel on Climate Change. Retrieved from: http://ipcc.ch/pdf/assessment-report/ar5/syr/AR5_SYR_FINAL_SPM.pdf
Jose, S., Cox, J., Miller, D. L., Shilling, D. G., & Merritt, S. (2002). Alien plant invasions: The story of cogongrass in southeastern forests. Journal of Forestry, 100, 41-44.
Kokotovich, A. E., & Zeilinger, A. R. (2011). Exploring social and institutional variation across oak wilt risk management programs in Minnesota, USA. Urban Forestry and Urban Greening, 10(1), 39-45.
Labriole, M. M., & Luzadis, V. A. (2011). New York Society of American Foresters’ perceptions of climate change. Journal of Forestry, 109(2), 89-94.
Langvall, O. (2011). Impact of climate change, seedling type and provenance on the risk of damage to Norway spruce (Picea abies (L.) Karst.) seedlings in Sweden due to early summer frosts. Scandinavian Journal of Forest Research, 26(Suppl 11), 56-63.
Lenart, M., & Jones, C. (2014). Perceptions on climate change correlate with willingness to undertake some forestry adaptation and mitigation practices. Journal of Forestry, 112(6), 553-563.
Mack, R., Simberloff, D., Lonsdale, W. [and others]. (2000). Biotic invasions: Causes, epidemiology, global consequences and control. Issues in Ecology, 5, 1-21.
Maibach, E., Roser-Renouf, C., & Leiserowitz, A. (2009). Global Warming’s Siz America’s 2009: An Audience Sigmentation Analysis. Yale University, New Haven, CT: Yale Project on Climate Change.
McNulty, S., Caldwell, P., Doyle, T. W., Johnsen, K., Liu, Y., Mohan, J., Prestemon, J., & Sun, G. (2013). Forests and climate change in the southeast. In K. T. Ingram, K. Dow, & L. Carter (Eds.), Climate of the Southeast United States: Variability, change, impacts, and vulnerability (pp. 165-189). Washington, D.C.: Island Press.
Millar, C. I., Stephenson, N. L., & Stephens, S. L. (2007). Climate change and forests of the future: Managing in the face of uncertainty. Ecological Applications, 17(8), 2145-2151.
Morris, H. L. C. (2014). Climate change attitude of Southeast forestry professionals: Implications for outreach. (Unpublished thesis). North Carolina State University, North Carolina. Retrieved from:
Nielsen-Gammon, J. W. (2011). The 2011 Texas Drought: A Briefing Packet for the Texas Legislature. College Station, TX: Office of the State Climatologist, Texas A&M University.
Riddle, A. A. (2011). Climate change and the U.S. Forest Service: Opportunities for adaptation and mitigation. (Unpublished thesis). North Carolina State University, North Carolina.
Rivera Rojas, M., Locatelli, B., & Billings, R. (2010). Cambio climático y eventos epidémicos del gorgojo descortezador del pino Dendroctonus frontalis en Honduras (Climate change and outbreaks of the southern pine beetle, Dendroctonus frontalis, in Honduras). Forest Systems, 19, 70-76.
Schmidtling, R. C. (1994). Use of provenance tests to predict response of climatic change: Loblolly pine and Norway spruce. Tree Physiology, 14, 805-817.
Skulman, B. W., Mattice, J. D., Cain, M. D., & Gbur, E. E. (2004). Evidence for allelopathic interference of Japanese honeysuckle (Lonicera japonica) to loblolly and shortleaf pine regeneration. Weed Science, 52, 433-439.
Spittlehouse, D. L., & Stewart, R. B. (2003). Adaptation to climate change in forest management. BC Journal of Ecosystems and Management, 4(1), 1-11.
Wear, D. N., & Greis, J. G., eds. (2013). The southern forest futures project: Technical report. Gen. Tech. Rep. SRS-178. Asheville, NC: U.S. Department of Agriculture, Forest Service, Southern Research Station. 552 p.
Westbrooks, R. (1998). Invasive plants, changing the landscape of America: Fact book. Washington, DC: Federal Interagency Committee for the Management of Noxious and Exotic Weeds (FICMNEW). 109 p.
Publication date: Jan. 5, 2018
Reviewed/Revised: Nov. 28, 2022
N.C. Cooperative Extension prohibits discrimination and harassment regardless of age, color, disability, family and marital status, gender identity, national origin, political beliefs, race, religion, sex (including pregnancy), sexual orientation and veteran status.
N.C. Cooperative Extension prohibits discrimination and harassment regardless of age, color, disability, family and marital status, gender identity, national origin, political beliefs, race, religion, sex (including pregnancy), sexual orientation and veteran status.