Stationary Sprinkler Irrigation System
Land application equipment used on animal production farms must be field calibrated or evaluated in accordance with existing design charts and tables according to state rules that went into effect September 1, 1996. Technical Specialist certifying waste management plans after September 1, 1996, must also certify that operators have been provided calibration and adjustment guidance for all land application equipment. The rules apply to irrigation systems as well as all other types of liquid, slurry, or solid application equipment.
Information presented in manufacturers’ charts are based on average operating conditions for relatively new equipment. Discharge rates and application rates change over time as equipment ages and components wear. As a result, equipment should be field calibrated regularly to ensure that application rates and uniformity are consistent with values used during the system design and given in manufacturers’ specifications. Field calibration is a simple procedure involving collection and measurement of the material being applied at several locations in the application area. This publication contains step-by-step guidelines for field calibration of stationary sprinkler irrigation systems.
General Guidelines
Operating an irrigation system differently than assumed in the design will alter the application rate, uniformity of coverage, and subsequently the application uniformity. Operating with excessive pressure results in smaller droplets, greater potential for drift, and accelerates wear of the sprinkler nozzle. Pump wear tends to reduce operating pressure and flow. With continued use, nozzle wear results in an increase in the nozzle opening, which will increase the discharge rate while decreasing the wetted diameter. Clogging of nozzles or crystallization of main lines can result in increased pump pressure but reduced flow at the sprinkler. Plugged intakes will reduce operating pressure. An operating pressure below design pressure greatly reduces the coverage diameter and application uniformity. Field calibration helps ensure that nutrients from animal waste are applied uniformly and at proper rates.
The calibration of a stationary sprinkler irrigation system involves setting out collection containers, operating the system, measuring the amount of wastewater collected in each container, and then computing the average depth of application (application volume) and application uniformity.
An in-line flow meter installed in the main irrigation line provides a good estimate of the total volume pumped from the lagoon during each irrigation cycle. The average application depth can be determined by dividing the pumped volume by the application area. The average application depth is computed from the formula:
\(\mathrm{Average\ application\ depth\ (inches)\ =\ }\frac{\mathrm{Volume\ pumped\ (gallons)}}{27,154\ (gal/ac-in)\ \times\ Application\ area\ (acres)}\)
The average application depth is the average amount applied throughout the field. Unfortunately, sprinklers do not apply the same depth of water throughout their wetted area. Under normal operating conditions, application depth decreases towards the outer perimeter of the wetted diameter. Stationary sprinkler systems are designed to have overlap of 50 to 65 percent of the wetted sprinkler diameter to compensate for the declining application along the outer perimeter. When operated at the design pressure, this overlap results in acceptable application uniformity.
When operated improperly, well-designed systems will not provide acceptable application uniformity. For example, if the pressure is too low, the application depth will be several times higher near the center of sprinkler and water will not be thrown as far from the sprinkler as indicated in manufacturers’ charts. Even through the average application depth may be acceptable, some areas receive excessively high application while others receive no application at all.
When applying wastewater high in nutrients, it is important to determine the application uniformity. Collection containers distributed throughout the application area must be used to evaluate application uniformity. Many types of containers can be used to collect flow and determine the application uniformity. Standard rain gauges work best and are recommended because they already have a graduated scale from which to read the application depth.
Pans, plastic buckets, jars, or anything with a uniform opening and cross section can be used, provided the container is deep enough (at least 4 inches deep) to prevent splash and excessive evaporation, and the liquid collected can be easily transferred to a scaled container for measuring. All containers should be the same size and shape.
All collection containers should be set up at the same height relative to the height of the sprinkler nozzle (discharge elevation ). Normally, the top of each container should be no more than 36 inches above the ground. Collectors should be located so that there is no interference from the crop. The crop canopy should be trimmed to preclude interference or splash into the collection container.
Calibration should be performed during periods of low evaporation. Best times are before 10 a.m. or after 4 p.m. on days with light wind (less than 5 miles per hour. On cool, cloudy days the calibration can be performed any time when wind velocity is less than 5 miles per hour.
General Guidelines for Stationary Sprinklers
Rain gauges or other collection containers should be spaced in a grid pattern fully enclosing the “effective” wetted area defined by the sprinkler spacing. The most common spacing pattern for stationary sprinklers is a square spacing where the distance between sprinklers is the same as the spacing between laterals. The spacing between sprinklers and laterals is normally between 50 to 65 percent of the sprinkler wetted diameter specified by the manufacturer.
Collection gauges should be placed one-fourth the lateral line length from the main and no further apart than one-fourth the wetted sprinkler radius or effective sprinkler spacing. (For example, if the effective spacing is 80 feet, spacing between gauges should be no more than 20 feet).
The grid pattern and number of gauges required to complete the calibration depends on the pattern of operating the irrigation system. The size of the calibration area should be no less than the “effective” area of one sprinkler. When sprinklers are arranged in a rectangular or square pattern with proper overlap, an “effective area” receives flow from four sprinklers. Thus, a minimum of four sprinklers should be included in the calibration.
The reliability of the calibration generally improves as more sprinklers are included in the calibration area. If all sprinklers contributing flow to the calibration area are functioning correctly, it is necessary to include only the minimum number of sprinklers as described in the preceding paragraph. But, a malfunctioning sprinkler can greatly influence the calibration results. Its effect on the calibration depends on the calibration setup and number of sprinklers being calibrated, the malfunctioning sprinkler’s position within the calibration area, the direction of the prevailing wind, and the nature of the malfunction. For these reasons, it is extremely important to observe the performance of every sprinkler contributing to the calibration while the calibration is being performed and to record any obvious performance irregularities. The more sprinklers that can be included in the calibration, the more representative the calibration results will be of the entire field and the less influence one malfunctioning sprinkler will have on the calibration results.
The volume (depth) collected during calibration should be read as soon as a zone or sprinkler is shut off to minimize evaporation from the rain gauge. Where a procedure must be performed more than once, (Setups 3, 4, or 5 described below) containers should be read and values recorded immediately after each different set up.
Operating patterns affect collection container layout and calibration procedures and results. Typical patterns for stationary sprinklers include:
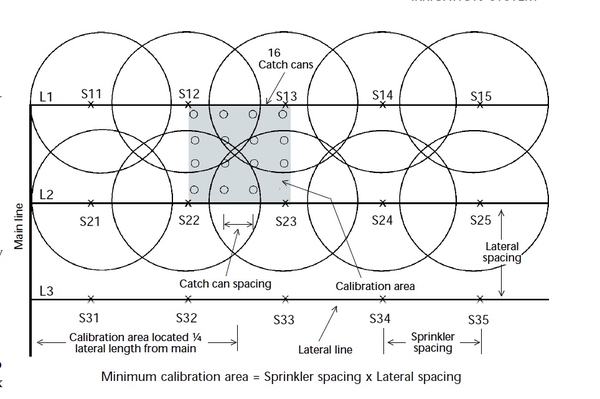
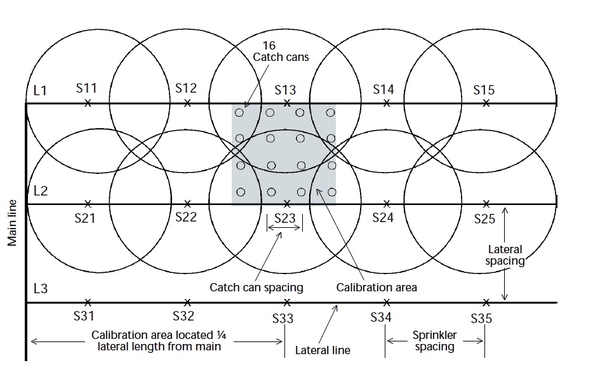
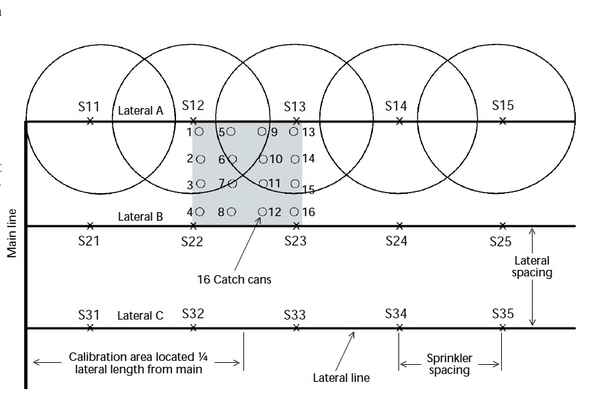
1. Square sprinkler spacing operated as a block (two or more adjacent laterals operating at the same time) Figure 1 or Figure 2.
The calibration area may be positioned or centered between the two laterals as shown in either Figure 1 or Figure 2. Four sprinklers contribute flow to the calibration area in the setup shown in Figure 1, while six sprinklers contribute for the setup shown in Figure 2. If all sprinklers are functioning properly, similar results would be obtained with either setup.
In case 1, with no wind effects, all four sprinklers should contribute equal flow to the calibration area (provided all sprinklers are functioning properly). If one of the four sprinklers is functioning improperly, the calibration results are not biased by its position within the calibration area.
In case 2, six sprinklers contribute flow to the calibration area, but their contribution is not equal. Sprinklers S13 and S23 contribute much more flow to the calibration area than sprinklers S12 S14 S22 or S24. (The first number refers to the lateral number and the second number refers to the sprinkler number along the lateral.) The setup shown in Figure 2 provides the advantage of more sprinklers contributing to the calibration, but the disadvantage of the results potentially being biased by sprinklers S13 and S23 if they are malfunctioning. For a square sprinkler spacing with collection gauges set at one-fourth the distance of the sprinkler spacing, the minimum number of collection gauges required to perform the calibration is 16. Step- by-step procedures for this pattern are presented in the Case I example.
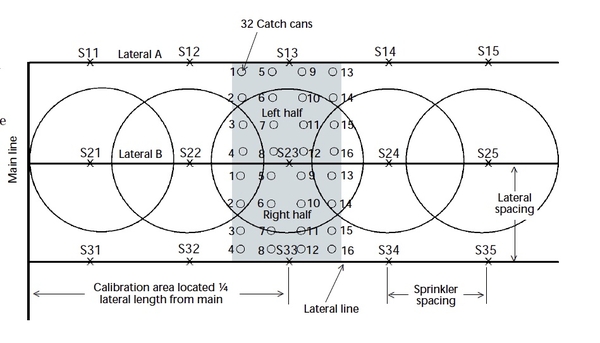
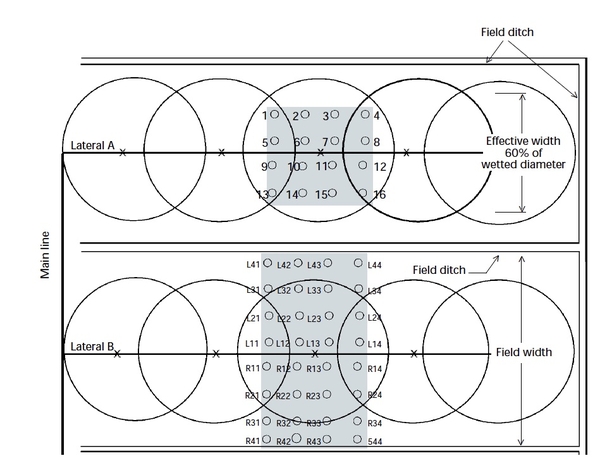
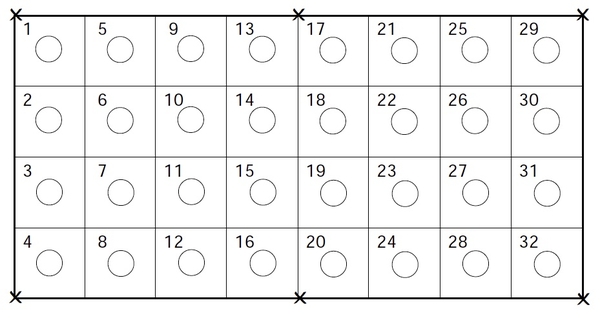
2. One lateral operating at a time with standard overlap from adjacent laterals — collection containers must be placed on each side of the lateral, Figure 3, which requires twice as many collectors (minimum 32).
A second alternative is to perform the procedure twice, once on each side of the lateral using 16 containers at a time, Figure 4. When selecting this alternative, pay attention to changes in operating conditions, such as change in wind speed or direction, that could result in variability.
In either alternative, the amounts collected must be combined to account for overlap. Step-by-step procedures for this calibration pattern are presented in the Case II example.
3. One lateral operating with no overlap between laterals — typical case when large gun-type sprinklers are operated in narrow fields, Figure 5. Calibration procedure is similar to procedure in #2 except outer edges do not receive overlap and must be excluded from the effective area calculations. Collection gauges may be centered about one sprinkler or positioned between two adjacent sprinklers. One of two approaches can be used to perform this calibration. A general rule in irrigation design is to assume that the width of the effective area is between 50 to 65 percent of the wetted diameter of the sprinkler (often 60 percent is used). The first edges are ignored at the onset of the calibration. Flow from all sprinklers is summed then averaged to compute the average application depth for the effective area.
For the second alternative, the entire width of the field is included in the calibration as shown in Figure 5 (Lateral B). At least 16 gauges should be set out on each side of the lateral. The calibration can be performed all at once (both sides of the lateral which requires 32 gauges) or the procedure can be performed twice, once on each side of the lateral using 16 gauges at a time. The “non-zero” volumes collected are averaged to get a “preliminary” average application depth for the wetted area. Next, the average application depth for each row of gauges is computed (rows are assumed to be oriented parallel to the lateral). In this computation, zero values are included.
Those rows whose row average is less than one-half the average from the entire wetted area are then excluded and assumed to fall outside the effective area. The effective width is the distance from the lateral line to the furthest row from the lateral that is retained. Step-by-step procedures for this method are given in the Case III example.
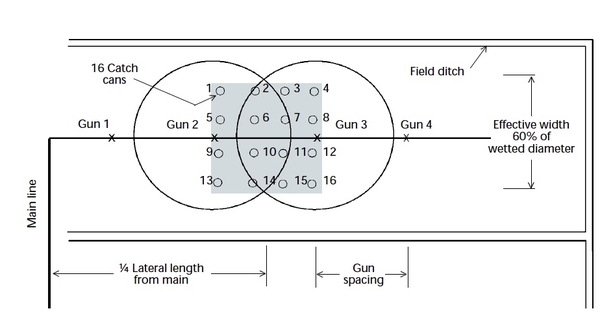
4. Big gun sprinkler operating individually, Figure 6. Procedure must be repeated for each gun sprinkler or sprinkler position (hydrant) contributing to the effective area being calibrated. This operating situation results where one or two guns or big sprinklers are moved from hydrant to hydrant throughout the field. Since stationary big guns should not be operated “head to head.” (two or more sprinklers throwing water on the same area simultaneously); the procedure must be repeated several times.
Collection gauges may be centered about one gun sprinkler. This setup requires that the procedure be performed three times, once while Gun 2 operates, again when Gun 3 operates, and a third time when Gun 4 operates. Collection gauges may also be centered between Gun 2 and 3 or Guns 3 and 4 as shown in Figure 6. (Actual location depends on the length of the lateral). In this setup, the procedure would be performed twice since only two guns or gun locations contribute to the calibration.
Case I. Block Pattern With 2 or More Laterals Operating Simultaneously
(Scenarios shown in Figure 1 and Figure 2)
- Determine the effective sprinkler area. (Area defined by sprinkler spacing along a lateral multiplied by the spacing between laterals. (Example: 80 feet by 80 feet are typical for a solid set wastewater system). The effective sprinkler area is the minimum area to be included in the calibration area. Note: The calibration area can be more than the effective area of one sprinkler.
- Determine the necessary spacing between collection gauges (1/4 the sprinkler spacing). For an effective sprinkler spacing of 80 feet, the rain gauge spacing should not exceed 20 feet. (80 ft / 4 = 20 ft). Gauges closest to the sprinklers should be placed a distance of 1/2 the gauge spacing from the sprinkler. For a gauge spacing of 20 feet, the first row of gauges should be 10 feet from the lateral line or sprinklers.
- Determine the number of gauges required. (Minimum number is 16.)
\(\mathrm{Number\ of\ gauges=}\frac{Calibration\ area\ ({\rm ft}^2)}{Gauge\ area\ ({\rm ft}^2)}\)
Example:
\(Calibration\ area\ =\ 80\ ft\ \times\ 80\ ft\ =\ 6400\ {\rm ft}^2\)
\(Gauge\ area\ =\ 20\ ft\ \times\ 20\ ft\ =\ 400\ {\rm ft}^2\)
\(Number\ of\ gauges\ =\frac{6400\ {\rm ft}^2}{400\ {\rm ft}^2}=\ 16\ gauges\)
- Set out gauges in a rectangular pattern as shown in Figure 1 or Figure 2, equally spaced at the distance determined in item 2 (20 feet) within the calibration area.
- Operate the system for normal operating time for a full cycle. Record the time of operation (duration in hours).
- Immediately record the amounts collected in each gauge. (Refer to Worksheet No. 1 for an example.)
- Add the amounts in #6 and divide by the number of gauges. This is the average application depth (inches).
\(Average\ application\ depth=\frac{Sum\ of\ amounts\ collected\ in\ all\ gauges}{Number\ of\ gauges}\)
-
Calculate the deviation depth for each gauge. The deviation depth is the difference between each individual gauge value and the average value of all gauges (#7). Record the absolute value of each deviation depth (absolute value means the sign of the number (negative sign) is dropped and all values are treated as positive). The symbol for absolute value is a straight thin line. For example, |2| means treat the number 2 as an absolute value. It does not mean the number 121. Because this symbol can lead to misunderstandings, it is not used with numbers in the worksheets at the end of this publication. The symbol is used in formulas in the text.
\(Deviation\ depth\ =\ |Depth\ collected\ in\ gauge\ i\ -\ average\ application\ depth|\)
“i” refers to the gauge number
-
Add amounts in #8 to get “sum of the deviations” from the average depth and divide by the number of gauges to get the average deviation.
\(\mathrm{Average\ deviation\ depth\ =\ }\frac{\mathrm{Sum\ of\ deviations\ (add\ amounts\ computed\ in\ step\ 8)}}{Number\ of\ gauges}\)
-
The precipitation rate (inches/hour) is computed by dividing the average application depth (inch) by the
application time (hours)
\(\mathrm{Precipitation\ rate\ =\ }\frac{\mathrm{Average\ application\ depth\ (inch)}}{Application\ time\ (hours)}\)
-
Determine the application uniformity. The application uniformity is often computed using the mathematical formula referred to as the Christiansen Uniformity Coefficient. It is computed as follows:
\(U_c=\frac{Average\ depth\ (step\ 7)\ -\ Average\ deviation\ (step\ 9)}{Average\ depth\ (step\ 7)}\times 100\)
-
Interpret the calibration results. The higher the index value, the more uniform the application. An index of 100 would mean that the uniformity is perfect — that the exact same amount was collected in every gauge.
An application uniformity greater than 75 is excellent for stationary sprinklers.
Application uniformity between 50 to 75 is in the “good” range and is acceptable for wastewater application.
Generally, an application uniformity below 50 is not acceptable for wastewater irrigation with stationary sprinklers. If the computed Uc is less than 50, system adjustments are required. Contact your irrigation dealer or Certified Technical Specialist for assistance.
Case II. Single Lateral Operated at One Time But Receives Overlap From Adjacent Laterals.
(Scenarios shown in Figure 3 and Figure 4)
- Determine the effective sprinkler area. (Lateral spacing times sprinkler spacing along lateral).
- Determine the necessary spacing between collection gauges. (Lateral spacing divided by 4). Gauges closest to the sprinklers should be placed a distance of one-half the gauge spacing from the sprinkler.
- Determine the number of gauges required.
- The amount collected on one side of the lateral must be added to the amount collected from respective positions on the other side of the lateral. This is necessary to account for overlap from adjacent laterals. Therefore, collection gauges should be labeled to indicate their respective positions, such as left or right of the lateral.
- Set out gauges in a rectangular pattern as shown in Figure 3 or Figure 4, equally spaced at the distance determined in item 2.
- Operate the system for normal operating time for a full cycle. Record the time of operation (duration in hours).
- Immediately record the amounts collected in each gauge. (Refer to Worksheet No. 2 for an example). If only one side of the lateral is calibrated at a time, after recording collection amounts, empty and move the collection containers to the other side and repeat steps 5 through 7 for exactly the same time duration as recorded in item 6.
- Collection amounts from pairs of cans should be added to simulate overlap. Contents should be combined from one side of the lateral to the other side as shown in Figure 3. Referring to Figure 3, container L1 is combined to R1, L2 to R2, L3 to R3, L4 to R4, L5 to R5, and so on.
- Add the amounts from all containers and divide by the number of gauges on one side of the lateral. This is the average application depth (inches).
\(Average\ application\ depth=\frac{Sum\ of\ amounts\ collected\ in\ all\ gauges}{Number\ of\ gauges\ on\ one\ side\ of \ lateral}\)
-
Calculate the deviation depth for each gauge. The deviation depth is the difference between combined depth for each position (values computed in #8) and the average application depth (#9). Record the absolute value of each deviation depth. Absolute value means the sign of the number (negative sign) is dropped and all values are treated as positive. The symbol for absolute value is a thin straight line.
\(Deviation\ depth\ =\ |Depth\ collected\ at\ position\ i\ -\ average\ application\ depth|\)
“i” refers to the gauge position within the effective calibration area
-
Add amounts in #10 to get “sum of the deviations” from the average depth and divide by the number of gauges (number of gauges on one side of lateral) to get the average deviation depth.
\(\mathrm{Average\ deviation\ depth\ =\ }\frac{\mathrm{Sum\ of\ deviations\ (add\ amounts\ computed\ in\ step\ 10)}}{Number\ of\ gauges\ on\ one\ side\ of\ lateral}\)
-
Determine the application uniformity. The application uniformity is often computed using the mathematical formula referred to as the Christiansen Uniformity Coefficient. It is computed as follows:
\(U_c=\frac{Average\ depth\ (step\ 9)\ -\ average\ deviation\ (step\ 11)}{Average\ depth\ (step\ 9)}\times100\)
-
Interpret the calibration results. The higher the index value, the more uniform the application. An index of 100 would mean that the uniformity is perfect — the exact amount was collected in every gauge.
An application uniformity greater than 75 is excellent for stationary sprinklers.
Application uniformity between 50 to 75 is in the “good” range and is acceptable for wastewater application.
Generally, an application uniformity below 50 is not acceptable for wastewater irrigation. If the computed Uc is less than 50, system adjustments are required. Contact your irrigation dealer or Certified Technical Specialist for assistance.
Case III. Single Lateral or Gun Sprinkler Without Overlap From Adjacent Laterals.
(Scenarios shown in Figure 5 or Figure 6)
- Determine the wetted diameter of a sprinkler or field width.
-
Determine the necessary spacing between collection gauges. The spacing in the direction along the lateral should be one-fourth the effective sprinkler spacing. The gauge spacing perpendicular to the lateral should be 1/8 the wetted diameter or width of the field.
\(\mathrm{Spacing\ between\ collection\ gauges\ parallel\ to\ lateral=}\frac{Effective\ sprinkler\ spacing\ in\ feet}{4}\)
\(\mathrm{Spacing\ between\ collection\ gauges\ perpendicular\ to\ lateral=}\frac{Sprinkler\ wetted\ diameter\ in\ feet}{8}\)
- Determine the number of gauges required.
-
Minimum number is 32 to perform the procedure in one setup (both sides of lateral at the same time).
-
One side of lateral calibrated at a time requires 16 gauges, procedure performed twice, once on each side of the lateral.
-
-
Set out gauges in a rectangular grid pattern as shown in Figure 5, spaced at the distances determined in item 2. Be sure to label gauges by rows (rows should be oriented parallel to and outward from the lateral line). The first row of gauges should be located 1/2 the gauge spacing from the lateral.
-
Operate the system for normal operating time for a full cycle. Record the time of operation (duration in hours).
-
Immediately record the amounts collected in each gauge. (Refer to Worksheet No. 3 for an example). If only one side of the lateral is calibrated at a time, after recording collection amounts, empty and move the collection containers to the other side and repeat steps 4 through 6 for exactly the same time duration as recorded in item 5.
-
Add the “non-zero” amounts collected and divide by the number of gauges with a non-zero amount. This is the “preliminary” average application depth (inches) within the “wetted” calibration area.
\(Average\ application\ depth=\frac{Sum\ of\ non-zero\ amounts\ collected}{Number\ of\ non-zero\ gauges}\)
- Determine the average application depth by rows. Include zero catches in the row computations.
\(Average\ row\ application\ depth=\frac{Sum\ of\ collection\ amounts\ from\ all\ gauges\ on\ the\ row}{Number\ of\ row\ gauges}\)
-
Identify and delete those rows whose average application depth (#8) is less than one-half the preliminary
average application depth (#7).
-
Determine the effective application width. The boundary is defined as the distance from the lateral to the last row furthest from the lateral that is retained.
-
Determine the average application depth within the effective area. Add amounts from all gauges in rows within the effective width (Rows retained in #9 and #10).
\(\mathrm{Corrected\ average\ application\ depth\ =\ }\frac{\mathrm{Sum\ of\ amounts\ collected\ in\ rows\ within\ effective\ width}}{Number\ of\ gauges\ within\ the\ effective\ width}\)
-
Calculate the deviation depth for each gauge. The deviation depth is the difference collected in each usable gauge and the average application depth (#11). Record the absolute value of each deviation depth. Absolute value means the sign of the number (negative sign) is dropped and all values are treated as positive. The symbol for absolute value is a thin straight line.
\(Deviation\ depth\ =\ |Depth\ collected\ at\ position\ i\ -\ average\ application\ depth\ (step\ 11)|\)
“i” refers to the gauge position within the effective calibration area
-
Add amounts in #12 to get “sum of the deviations” from the average depth and divide by the number of gauges.
\(\mathrm{Average\ deviation\ depth\ =\ }\frac{\mathrm{Sum\ of\ deviations\ (add\ amounts\ computed\ in\ step\ 12)}}{Number\ of\ gauges\ within\ the\ effective\ width}\) -
Determine the application uniformity. The application uniformity is often computed using the mathematical formula referred to as the Christiansen Uniformity Coefficient. It is computed as follows:
\( U_c=\frac{Average\ depth\ (step\ 11)\ -\ Average\ deviation\ (step\ 14)}{Average\ depth\ (step\ 11)}\times100 \)
-
Interpret the calibration results. The higher the index value, the more uniform the application. An index of 100 would mean that the uniformity is perfect — the exact amount was collected in every gauge.
An application uniformity greater than 75 is excellent for stationary sprinklers.
Application uniformity between 50 to 75 is in the “good” range and is acceptable for wastewater application.
Generally, an application uniformity below 50 is not acceptable for wastewater irrigation. If the computed Uc is less than 50, system adjustments are required. Contact your irrigation dealer or Certified Technical Specialist for assistance.
Worksheet 1. Example Calibration Data for a Stationary Sprinkler System Operated in a Block Pattern.
(Setup as shown in Figure 1)
- Effective sprinkler area: 80 ft by 80 ft = 6400 ft2
-
Spacing between collection containers (spacing 80 (ft)/4) = 20 ft
-
\(\mathrm{Number\ of\ gauges=}\frac{calibration\ area\ ({\rm ft}^2)}{effective\ gauge\ area\ ({\rm ft}^2)}=\frac{6400\ {\rm ft}^2}{20\ ft\ \times\ 20\ ft}=16\)
-
Start of Irrigation event 7:15 a.m.
-
End of Irrigation event 9:30 a.m.
-
Duration (e−d) 2.25 hours
-
Operate the system and collect data
Gauge No. Volume Collected (inches) Deviation from Average* (absolute value) Gauge No. Volume Collected (inches) Deviation from Average* (absolute value) 1 .57 .005 9 .51 .065 2 .69 .115 10 .26 .315 3 .83 .255 11 .36 .215 4 .65 .075 12 .52 .055 5 .61 .035 13 .79 .215 6 .38 .195 14 .65 .075 7 .27 .305 15 .61 .035 8 .64 .065 16 .86 .285 * Record the absolute value of each deviation, so all values are treated as positive.
-
Sum of volume collected in all catches = 9.20 inches
-
Average application depth (h/c) = (9.2/16) = .576 inches
-
\(\mathrm{Precipitation\ rate\ =\ }\frac{\mathrm{0.576\ inches}}{(2.25\ hour)}\ =\ 0.26\ inches/hour\)
-
Sum of all deviations from the average depth = 2.31
-
Average deviation from average depth (k/c) = 0.144
-
Uniformity coefficient
\( U_c=\frac{0.576\ -\ 0.144}{0.576}\times100\ =\ 74.9\)
-
Interpret Results. Uniformity coefficient is in the good range, so no adjustments are necessary
Worksheet 2. Example Calibration Data for a Stationary Sprinkler System, one Lateral Operated at a Time.
(Setup as shown in Figure 3.)
- Effective sprinkler area: 80 ft by 80 ft = 6400 ft2
-
Spacing between collection containers (spacing 80 (ft)/4) = 20 ft
-
\(\mathrm{Number\ of\ gauges=}\frac{Calibration\ area\ ({\rm ft}^2)}{Effective\ gauge\ area\ ({\rm ft}^2)}=\frac{2\ \times\ 80\ ft\ \times\ 80\ ft}{20\ ft\ \times\ 20\ ft}=32\)
-
Start of Irrigation event 7:15 a.m.
-
End of Irrigation event 9:30 a.m.
-
Duration (e−d) 2.25 hours
-
Operate the system, collect data, and record on the worksheet.
Gauge No. Volume Collected (inches) Overlap Adjustment Deviation from Average* L1 .00 .67 (L1 + R1) .012 (L1+R1) − i) L2 .15 .64 (L2 + R2) .042 (L2+R2)− i) L3 .38 .72 (L3 + R3) .038 (etc) L4 .71 .71 (L4 + R4) .028 L5 .02 .86 (L5 + R5) .178 L6 .20 .79 (etc) .108 L7 .43 .53 .152 L8 .78 .80 .118 L9 .04 .82 .138 L10 .33 .94 .258 L11 .51 .74 .058 L12 .69 .69 .008 L13 .00 .51 .172 L14 .11 .44 .242 L15 .37 .47 .212 L16 .58 .58 .102 * Record the absolute value of each deviation, so all values are treated as positive.
R1 0.67 R2 0.49 R3 0.34 R4 0.00 R5 0.84 R6 0.59 R7 0.10 R8 0.02 R9 0.78 R10 0.61 R11 0.23 R12 0.00 R13 0.51 R14 0.33 R15 0.10 R16 0.00 -
Sum of all catches = 10.91 inches
-
Average application depth (h/16) = (9.2/16) = 0.682 inches
-
Sum of all deviations from the average depth = 1.866
-
Average deviation from average depth = 0.117
-
Uniformity coefficient
\( U_c=\frac{0.682\ -\ 0.117}{0.682}\times100\ =\ 82.8\)
-
Interpret Results. Uniformity coefficient is in the excellent range for a stationary sprinkler system. No adjustment necessary.
Worksheet 3. Example Calibration Data for a Stationary Sprinkler System
*one lateral operated at a time, no overlap from adjacent laterals.
(Setup as shown in Figure 5, lateral B.)
- Determine the wetted diameter of a sprinkler.
From manufacturers literature, wetted diameter is 160 feet, sprinkler spacing along lateral is 100 feet.
-
Determine the necessary spacing between collection gauges.
\(parallel\ to\ lateral\ =\ \frac{sprinkler\ spacing\ }{4}=\frac{100\ ft}{4}=25\ feet\)
\(perpendicular\ to\ lateral\ =\ \frac{sprinkler\ wetted\ diameter}{8}=\frac{160\ ft}{8}=20\ feet\)
-
Determine the number of gauges required.
Will calibrate both sides of lateral at one time so need 32 collection gauges.
First row of gauges should be located a distance of 1/2 the gauge spacing from the lateral line. i.e.,
if the gauge spacing is 20 feet, first row of gauges should be 10 feet from the lateral.
-
Start of Irrigation event 7:15 a.m.
-
End of Irrigation event 9:30 a.m.
-
Duration (e−d) 2.25 hours
-
Operate the system and collect data.
Gauge No. Distance from Lateral Volume Collected (inches) Row Average Usable Values Deviation from Average L11 10 0.77 0.77 0.260 L12 10 0.69 0.69 0.180 L13 10 0.83 0.83 0.320 L14 10 0.65 0.74 0.65 0.140 L21 30 0.61 0.61 0.100 L22 30 0.57 0.57 0.060 L23 30 0.48 0.48 0.030 L24 30 0.44 0.53 0.44 0.070 L31 50 0.31 .31 0.200 L32 50 0.22 .22 0.290 L33 50 0.18 0.18 0.330 L34 50 0.29 0.25 0.29 0.220 L41 70 0.12 L42 70 0.00 L43 70 0.00 L44 70 0.08 .05 (discard) R11 10 0.67 0.67 0.160 R12 10 0.79 0.79 0.280 R13 10 0.81 0.81 0.300 R14 10 0.77 0.76 0.77 0.260 R21 30 0.59 0.59 0.080 R22 30 0.51 0.51 0.000 R23 30 0.62 0.62 0.110 R24 30 0.50 0.56 0.50 0.010 R31 50 0.37 0.37 0.140 R32 50 0.17 0.17 0.340 R33 50 0.15 0.15 0.360 R34 50 0.24 0.23 0.24 0.270 R41 70 0.07 R42 70 0.00 R43 70 0.00 R44 70 0.09 0.04 (discard) -
Add the non zero amounts collected and divide by the number of gauges with a non-zero amount. This is the average application depth (inches) within the “wetted” calibration area.
Sum of non zero catches in column 3 = 12.59 inches
Number of gauges with non-zero catch = 28 gauges
\(Average\ catch\ all\ non-zero\ gauges\ =\ \frac{12.59}{28}=0.45\ inches\)
-
Determine the average application depth by rows. Include zero catches in the row computations. Row averages are shown in column 4.
-
Identify and delete those rows whose average application depth (#i) is less than one-half the average application depth (#h).
Application depth of Row L4 is 0.05 inches and Row R4 is 0.04 inches so discard row 4 values on both sides (left and right) of lateral.
-
Determine the effective application width.
Row 3 is last usable row and is located 50 feet from lateral (column 3). Therefore, effective width is 50 feet on each side of lateral or 100 feet total.
-
Determine the average application depth within the effective area. Add amounts from all gauges in rows within the effective width (Rows 1, 2, and 3 on both sides of lateral.)
Usable values are shown in column 5 sum of amounts collected in rows within effective width (sum of column 5) = 12.23 inches
\(Average\ application\ depth=\frac{12.23\ inches}{24 \ gauges}=\ 0.51\ inches\)
-
Calculate the deviation depth for each gauge. Values shown in column 6.
\(Deviation\ depth\ =\ |Depth\ collected\ at\ position\ i\ -\ average\ application\ depth\ (step\ l)|\)
i refers to the gauge position within the effective calibration area
-
Sum of deviations (sum of values in column 6) = 4.511 inches
\(\mathrm{Average\ deviation\ depth\ =\ }\frac{\mathrm{4.511\ inches}}{24\ gauges}= 0.188\ inches\)
-
Determine the application uniformity.
\( U_c=\frac{0.51\ inches\ (step\ l)-\ 0.188\ inches\ (step\ n)}{0.51\ inches\ (step\ l)}\times100\ =\ 63.1\)
-
Interpret the calibration results. An index value of 63 percent is acceptable for a stationary sprinkler system. No adjustments are needed.
Irrigation System Calibration Data Sheet for Stationary Sprinkler
Date_______Farm_______Tract No._______
-
Effective sprinkler area:_______ Lateral spacing_______ft by spacing along lateral_______ft=_______ft2
Sprinkler: Make_______Model_______Nozzle Dia._______Discharge_______GPM
Pressure: Sprinkler_______Pump Pressure_______
-
Spacing between collection containers (sprinkler spacing _______ (ft)/4) = _______ ft
-
Number of collection containers _____
Wind speed_______
-
Start of Irrigation event _______
-
End of Irrigation event _______
-
Duration (e-d) _______ hours
-
Operate the system, collect data, and record on the worksheet
-
Sum of all catches ________ inches
-
Average application depth (h/c) ________ inches
-
Precipitation rate = \(\frac{(i)}{(f)}\)= ______ inches/hr
-
Sum of all deviations from the average catch ______
-
Average deviation from average application depth ______
Uniformity coefficient \(U_c=\frac{\ \ \ \ \ \ \ \ \ \ \ \ \ \ \ \ \ \ \ \ \ (i)\ -\ \ \ \ \ \ \ \ \ \ \ \ (l)}{\ \ \ \ \ \ \ \ \ \ \ \ \ \ \ \ \ \ \ \ \ \ \ \ \ \ (i)}\times100=\ \)
Interpret the calibration results.
An application uniformity greater than 75 is excellent for stationary sprinklers.
Application uniformity between 50 to 75 is in the “good” range and is acceptable for wastewater application.
Generally, an application uniformity below 50 is not acceptable for waste- water irrigation. If the computed Uc is less than 50 percent, system adjustments are required. Contact your irrigation dealer or Certified Technical Specialist for assistance.
Calibration Data Sheet for Stationary Sprinkler
Publication date: April 1, 1997
Reviewed/Revised: July 26, 2024
AG-553-01
N.C. Cooperative Extension prohibits discrimination and harassment regardless of age, color, disability, family and marital status, gender identity, national origin, political beliefs, race, religion, sex (including pregnancy), sexual orientation and veteran status.

