
The research reported in this publication was funded by the North Carolina Agricultural Research Service (NCARS) and the United States Department of Agriculture-Agricultural Research Service (USDA-ARS) as part of a joint forage-animal research program. Mention of trade names, proprietary products, or specific equipment does not constitute a guarantee or warranty by either NCARS or USDA-ARS and does not imply its approval to the exclusion of other products that may be suitable.
Cover photographs courtesy of NCARS and USDA-ARS.
Contents
I. Evaluation of Tall Fescue Cultivars and Endophyte Type
Experiment 1. Dry Matter Intake, Digestibility, and Masticate Characteristics of Three Tall Fescue Cultivars
Experiment 2. Comparison of Nutritive Value and Quality of Fall Growth of Forager and Johnstone Tall Fescue Preserved as Hay
Experiment 3. An Assessment of Nutritive Value and Quality of Jesup Tall Fescue Hay Infected with Either a Novel or a Wild-Type Endophyte
II. Evaluation of Tall Fescue at Differing Maturities
Experiment 4. The Influence of Maturity of Initial Tall Fescue Growth Cut for Hay on Steer Intake and Digestibility
III. Evaluation of the Influence of Drying Methods on Nutritive Value and Quality of Tall Fescue
Experiment 5. The Influence of Drying Methods on Dry Matter Intake and Digestibility of Direct-Cut Tall Fescue Forage
Experiment 6. The Influence of Drying Method on Dry Matter Intake and Dry Matter Digestion of Fall-Accumulated Kentucky 31 Tall Fescue
IV. Evaluation of Diurnal Changes in the Nutritive Value of Cool-Season Forages
Experiment 7. Influence of Five Diurnal Cuts on the Nutritive Value and Quality of MaxQ Tall Fescue Hay
Experiment 8. Influence of Six Diurnal Cuts on the Nutritive Value, Preference, and Quality of MaxQ Tall Fescue Hay
Experiment 9. The Influence of Five Diurnal Cuts of Alfalfa on Nutritive Value and Preference by Sheep and Goats
V. Evaluation of an Improved Cool-Season Grass for the Mid-Atlantic Region
Experiment 10. Intake and Digestibility of Palaton Reed Canarygrass Hay
General Procedures of Experimentation
GP-2. Dry Matter Intake and Whole Tract Digestibility
GP-3. Masticate Collection and Processing
GP-5. Particle Size Determination
Abstract
This bulletin publishes the results of 10 experiments that addressed aspects of nutritive value (i.e., laboratory estimates of dry matter disappearance and chemical composition) and quality (i.e., animal responses) of cool-season perennial forages preserved as hay. Although each experiment was conducted independently, those with similar objectives have been grouped into one of five categories. The focus of this bulletin is the evaluation of tall fescue cultivars, forage maturity, drying methods, and diurnal changes in forages. However, experiments on other forages (i.e., reed canarygrass and alfalfa) have also been included.
The purpose of this bulletin is to provide original research data in a summarized format, with associated methodology, for future reference. A brief Results and Discussion section has been included for each experiment, followed by a Summary and Conclusions section highlighting the major findings. Consequently, the interested reader is directed to the Summary and Conclusions section at the end of each experiment for an assessment of the findings that is not reiterated elsewhere.
Introduction
The north-south transition zone encompasses North Carolina, enabling the production of both cool-season and warm-season forage species. Cool-season forages generally are more productive farther north, and warm-season species are more productive farther south. When crops are well managed, the presence of both cool- and warm-season forages provides near year-round forage production. This requires integrating both cool- and warm-season forage (grass and legume) species into production systems. Still, there remains a need for conserved forage for use during periods of excessive drought (summer and fall) or prolonged cold (mid- to late winter). This need is frequently met through the conservation of forage as hay. This forage is sometimes conserved as conventional square bales and stored under a roof, but more often it is stored as large round bales without any cover. Because of humidity during the summer and the frequency of rain-bearing fronts moving through the region, adequate field curing of hay for storage can be problematic.
Both tall fescue [Festuca arundinacea Schreb. or Lolium arundinaceum (Schreb.) Darbysh.] and orchardgrass (Dactylis glomerata L.) are adapted to the north-south transition zone and have similar nutritive values. Tall fescue has been found to be more reliable than orchardgrass in terms of persistence and growth. Growth of tall fescue occurs during the spring and into early summer; it then resumes in late summer and continues into the fall and early winter. The previously observed problem of fescue toxicosis associated with poor animal performance has been essentially resolved. This involved the introduction and evaluation of a novel or nontoxic endophyte, resulting in tall fescue that is persistent without causing toxicosis. Such cultivars are on the market and available when establishing new tall fescue stands.
This bulletin gathers information primarily on the evaluation of tall fescue as a hay crop. It also includes evaluation of reed canarygrass (Phalaris arundinacea L.) as a potential perennial forage for the region and evaluation of the diurnal shifts in the nutritive value of alfalfa (Medicago sativa L.). The main purpose of this document is to provide a record of the data obtained from a number of different experiments, with only the main points highlighted in the Results and Discussion sections and in the Summary and Conclusions sections. The general procedures used in conducting the research presented in this bulletin are provided in the Appendix. Throughout the bulletin, “nutritive value” refers to laboratory estimates of dry matter disappearance and the chemical composition of the forage, such as crude protein, neutral detergent fiber, etc., and “quality” refers to animal responses such as dry matter intake and dry matter digestibility.
I. Evaluation of Tall Fescue Cultivars and Endophyte Type
Experiment 1. Dry Matter Intake, Digestibility, and Masticate Characteristics of Three Tall Fescue Cultivars
Tall fescue is the primary perennial cool-season grass that contributes to animal production systems across the mid-Atlantic region. The cultivar Kentucky 31 has been the major contributor over the years, with improvements occurring through breeding programs with the release of Forager in 1979, Triumph in 1981, and Johnstone in 1983.
The objective of this experiment was to compare the nutritive value and quality of these three tall fescue cultivars when cut at the same physiological maturity under the same environmental (climate and soil) conditions.
Materials and Methods
Well-established stands of Johnstone, Forager, and Triumph tall fescue in the piedmont of North Carolina (Piedmont Research Station, Salisbury, NC) provided the experimental hays. The fields were cut in late February to a 3-inch stubble to remove all fall and winter carryover growth. All stands were topdressed in early March with 70 pounds of nitrogen per acre in preparation for the production of the following experimental hays:
- Johnstone tall fescue cut June 10 in the boot (heads emerging) stage
- Forager tall fescue cut June 11 in the boot (heads emerging) stage
- Triumph tall fescue cut June 12 in the boot (heads emerging) stage
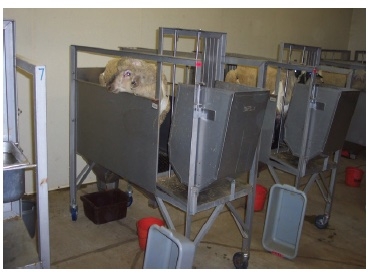
All hays were cut with a mower-conditioner set to a 3-inch stubble, and they were allowed to field cure. Once dried, the hays were baled by a conventional square baler and transported and stored on wooden pallets in an experimental hay-storage barn at the NC State University Forage-Animal Metabolism Unit in Raleigh until fed (Appendix GP-1). Two experiments were conducted. One experiment evaluated dry matter intake and digestion (Experiment 1A), and the other experiment evaluated characteristics of masticated forage (Experiment 1B). The design of Experiment 1A was a 3 × 3 Latin square. Three steers (mean weight = 535 ± 20 pounds) were randomly assigned to a hay treatment in period 1, and data were collected according to the procedures in Appendix GP-2. Steers were fed at an average excess of 13.1%.
In Experiment 1B, six esophageally fistulated steers were used to provide sources of masticated forage in a 3 × 3 Latin square design with two squares. Steers were fed their assigned experimental hay on day 1, day 2, and day 3, with each day representing a period in the Latin square. The mastication and associated sieving and processing of samples were conducted according to the procedures in Appendix GP-3 and GP-5, and the data were analyzed statistically according to the procedures in Appendix GP-8.
Results and Discussion
Experiment 1A.
Steers consumed all three tall fescue cultivars similarly (mean = 2.22 pounds/100 pounds of body weight), but whole-tract dry matter digestibility was greater for Johnstone than for the mean of Forager and Triumph (59.1% vs. 55.2%). Digestibility was greater for Triumph than for Forager (58.2% vs. 56.2%), and this is reflected in neutral detergent fiber digestion (Table 1.1). The in vitro dry matter disappearance of the as-fed hays reflects dry matter digestion, with Johnstone being greater (61.0%) than the mean of Forager and Triumph (54.9%) (Table 1.2). The neutral detergent fiber concentrations of Johnstone hay were the least compared to the mean of Forager and Triumph (63.2% vs. 65.1%).
| Cultivar | DMI (lbs/100 lbs2) |
Digestibility1 (%) |
Digestible Intakes (lbs/100 lbs2) |
||||||||
|---|---|---|---|---|---|---|---|---|---|---|---|
| DM | NDF | ADF | HEMI | CELL | DM | NDF | ADF | HEMI | CELL | ||
| Johnstone (J) | 2.363 | 59.1 | 59.5 | 55.9 | 63.7 | 66.6 | 1.39 | 0.87 | 0.43 | 0.44 | 0.43 |
| Forager (F) | 2.17 | 54.6 | 56.0 | 51.4 | 61.6 | 63.7 | 1.17 | 0.77 | 0.38 | 0.39 | 0.39 |
| Triumph (T) | 2.12 | 55.8 | 58.2 | 52.3 | 65.1 | 64.3 | 1.18 | 0.81 | 0.40 | 0.40 | 0.40 |
| Significance (P): | |||||||||||
| Cultivar: | 0.46 | 0.07 | 0.04 | 0.03 | 0.25 | 0.17 | 0.24 | 0.33 | 0.19 | 0.50 | 0.42 |
| J vs. (F+T)/2 | 0.27 | 0.04 | 0.03 | 0.02 | 0.80 | 0.09 | 0.13 | 0.20 | 0.11 | 0.30 | 0.25 |
| F vs. T | 0.80 | 0.30 | 0.05 | 0.26 | 0.13 | 0.63 | 0.93 | 0.56 | 0.36 | 0.77 | 0.68 |
| MSD4 | 0.53 | 3.5 | 2.2 | 2.7 | 5.0 | 3.5 | 0.33 | 0.17 | 0.07 | 0.12 | 0.09 |
1 NDF = neutral detergent fiber; ADF = acid detergent fiber; HEMI = hemicellulose; CELL = cellulose. ↲
2 Body weight basis. ↲
3 Each value is the mean of three steers. ↲
4 MSD = minimum significant difference from the Waller-Duncan k-ratio (k = 100) t test; can be used to compare any two treatments. ↲
Experiment 1B.
Examinations of the whole masticate collected from each cultivar revealed few differences, with the exception of neutral detergent fiber (Table 1.3). The neutral detergent fiber concentration was greatest in Johnstone (66.4%) compared with the mean of the other two (61.7%). Separation of masticate dry matter into large, medium, and small particle-size classes resulted in similar differences. Also, the median particle sizes of the masticate samples, determined by estimating percentage cumulative particle weight oversize (Figure 1.1), were similar among cultivars. However, medium particle size of the feces differed among cultivars, with Johnstone being greatest at 0.42 mm, followed by Forager (0.37 mm) and Triumph (0.32 mm). This indicates some differences in how the hays were chewed (data not shown) and subsequently digested. However, composition of the feces was similar among cultivars, averaging 11.1% crude protein, 63.7% neutral detergent fiber, 38.5% acid detergent fiber, 25.3% hemicellulose, 23.3% cellulose, and 10.3% lignin.
| Cultivar | IVDMD | CP | NDF | Fiber Fractions1 | ||||||
|---|---|---|---|---|---|---|---|---|---|---|
|
AF (%) |
DV2 (%) |
AF (%) |
DV (%) |
AF (%) |
DV (%) |
ADF (%) |
HEMI (%) |
CELL (%) |
Lignin (%) |
|
| Johnstone (J) | 61.03 | -12.7 | 10.8 | -0.3 | 63.2 | 2.8 | 33.9 | 29.3 | 27.5 | 4.65 |
| Forager (F) | 55.1 | -7.3 | 10.7 | -0.1 | 64.3 | 1.7 | 34.9 | 29.4 | 28.1 | 5.24 |
| Triumph (T) | 54.7 | -9.9 | 10.2 | 0.7 | 65.8 | 1.2 | 36.5 | 29.3 | 29.1 | 5.05 |
| Significance (P): | ||||||||||
| Cultivar: | 0.04 | 0.35 | 0.43 | 0.09 | <0.01 | 0.12 | 0.15 | 0.99 | 0.02 | 0.17 |
| J vs. (F+T)/2 | 0.02 | 0.23 | 0.46 | 0.10 | <0.01 | 0.07 | 0.11 | 0.95 | 0.01 | 0.10 |
| F vs. T | 0.71 | 0.45 | 0.31 | 0.08 | <0.01 | 0.35 | 0.18 | 0.93 | 0.02 | 0.43 |
| MSD4 | 4.4 | 9.3 | 1.4 | 0.9 | 0.4 | 1.7 | 2.8 | 2.2 | 0.7 | 0.70 |
1 CP = crude protein; ADF = acid detergent fiber; HEMI = hemicellulose; CELL = cellulose. ↲
2 DV = difference value (weighback concentration minus AF concentration). ↲
3 Each value is the mean of three samples. ↲
4 MSD = minimum significant difference from the Waller-Duncan k-ratio (k = 100) t test; can be used to compare any two treatments. ↲
| Cultivar | Whole Masticate | Large | Medium | Small | |||||||||
|---|---|---|---|---|---|---|---|---|---|---|---|---|---|
| DM (%) |
MPS (%) |
IVDMD (%) |
NDF (%) |
Prop (%) |
IVDMD (%) |
NDF (%) |
Prop (%) |
IVDMD (%) |
NDF (%) |
Prop (%) |
IVDMD (%) |
NDF (%) |
|
| Johnstone (J) | 16.73 | 1.4 | 58.8 | 66.4 | 36.0 | 59.9 | 67.7 | 51.6 | 58.1 | 66.7 | 12.4 | 58.7 | 60.7 |
| Forager (F) | 15.7 | 1.7 | 62.5 | 61.6 | 52.3 | 63.2 | 62.7 | 38.7 | 61.9 | 61.1 | 9.0 | 61.7 | 57.5 |
| Triumph (T) | 15.1 | 1.5 | 62.7 | 61.8 | 42.2 | 63.8 | 62.6 | 46.8 | 61.7 | 61.9 | 11.0 | 62.1 | 57.3 |
| Significance (P): | |||||||||||||
| Cultivar: | 0.16 | 0.23 | 0.14 | 0.03 | 0.15 | 0.14 | 0.03 | 0.12 | 0.16 | 0.03 | 0.34 | 0.17 | 0.14 |
| J vs. (F+T)/2 | 0.08 | 0.16 | 0.06 | 0.01 | 0.12 | 0.06 | 0.01 | 0.10 | 0.07 | 0.01 | 0.25 | 0.07 | 0.06 |
| F vs. T | 0.47 | 0.31 | 0.92 | 0.91 | 0.21 | 0.73 | 0.98 | 0.18 | 0.94 | 0.62 | 0.37 | 0.80 | 0.89 |
| MSD4 | 1.9 | 0.4 | 5.0 | 3.8 | 18.7 | 4.6 | 3.9 | 13.7 | 5.1 | 4.3 | 5.8 | 4.5 | 4.3 |
1 IVDMD = in vitro dry matter disappearance; NDF = neutral detergent fiber. ↲
2 Large = > 1.7mm; medium = ≤ 1.7mm and ≥ 0.5mm; small < 0.5 mm. ↲
3 Each value is the mean of six steers. ↲
4 MSD = minimum significant difference from the Waller-Duncan k-ratio (k = 100) t test; can be used to compare any two treatments. ↲
Summary and Conclusions
- Steers readily consumed Johnstone, Forager, and Triumph tall fescue hays and ate similar amounts of them, averaging 2.22 pounds per 100 pounds of body weight.
- Johnstone had greatest dry matter digestion (59.1%), with Forager and Triumph showing results similar to one another (54.6% and 55.8%, respectively).
- Digestible intakes of dry matter, neutral detergent fiber, and constituent fiber fractions were similar among the three cultivars.
- Johnstone had some quality advantages over Forager and Triumph. However, all three cultivars can have an important role in ruminant production systems.
- Because of the general similarity among cultivars in nutritive value and quality, the agronomic aspects of growth and regrowth rates and persistence under defoliation may be more important characteristics on which to base cultivar selection.
Experiment 2. Comparison of Nutritive Value and Quality of Fall Growth of Forager and Johnstone Tall Fescue Preserved as Hay
Selection to improve the agronomic characteristics of a forage may also alter nutritive value and consequently forage quality. The tall fescue cultivars Forager and Johnstone, released for improved persistence when grazed and for reduced perloline concentrations, respectively, were evaluated with steers to test dry matter intake and digestion.
Materials and Methods
Well-established stands of both cultivars, located in the piedmont of North Carolina (Piedmont Research Station, Salisbury, NC), were the sources of the experimental hays. The fields were clipped to 2 inches in late August and topdressed with 60 pounds of nitrogen per acre. Autumn regrowth accumulated, resulting in the following two treatments:
- Forager tall fescue cut in the vegetative stage on October 10, field cured and baled
- Johnstone tall fescue cut in the vegetative stage on October 13, field cured and baled
Both forages were cut with a conventional mower conditioner to a 3-inch stubble, field cured, baled, and then transported and stored on wooden pallets in an experimental hay-storage barn at the NC State University Forage-Animal Metabolism Unit in Raleigh. Prior to feeding, the hays were processed according to the procedueres in Appendix GP-1 and stored in carts until fed.
The intake and digestion experiment was designed as four 2 × 2 Latin squares conducted simultaneously. Eight steers of British breeding and of similar weight (mean = 534 ± 21.6 pounds) were assigned at random to a treatment within period 1 of each square. Intake and digestibility estimates were obtained by using the procedures in Appendix GP-2. Animals were fed similarly between treatments, averaging 13.8% excess. During the digestion phase, total urine output and total fecal output were determined (Appendix GP-2). Urine samples were obtained for further analysis. Separate fecal samples were also obtained for particle-size determination (Appendix GP-5).
All as-fed hay samples were composited by treatment prior to chemical analyses. Samples were analyzed for in vitro dry matter, crude protein, and neutral detergent fiber and its constituent fiber fractions (Appendix GP-7). Because hay samples from each animal were composited by treatment, they could not be statistically analyzed; however, the treatment means are presented. All animal response data, including fecal samples, were retained by experimental unit and analyzed statistically according to the design (Appendix GP-8).
Results and Discussion
Steers fed Johnstone tall fescue consumed greater amounts of dry matter, averaging 2.44 pounds per 100 pounds body weight compared with 2.04 for Forager. Steers fed Johnstone tall fescue also had greater whole-tract dry matter digestibility, averaging 70.7% compared with 66.8% for Forager (Table 2.1). These dry matter digestibility differences favoring Johnstone were also reflected in digestible intakes (Table 2.1) and in nutritive value assessment of the as-fed hays of the two cultivars (Table 2.2).
Comparison of the nitrogen status of the steers fed the two hays revealed similar daily nitrogen intakes, averaging 0.186 pounds per day; but the two hays differed in quantity of nitrogen excreted in the urine. The animals fed Forager retained a greater amount of nitrogen than those fed Johnstone (Table 2.3). Nitrogen exceeded 11% of dry matter (Table 2.2) in the as-fed hays and was not a limiting factor in either diet.
Steers appear to have processed the two hays similarly, as no differences were noted in fecal median particle size (0.31 mm); in the proportions of large, medium, and small particle-size classes, which averaged 1.7%, 28.2%, and 70.1%, respectively; or in dry matter distributions of cumulative percent oversize (data not shown). The fecal compositions from steers fed the two hays were also generally similar, averaging 13.6% crude protein, 59.6% neutral detergent fiber, 33.0% acid detergent fiber, 26.6% hemicellulose, 20.5% cellulose, and 9.3% lignin (data not shown). The noted exception was the nitrogen concentration in the acid detergent fiber fraction of the feces, which averaged greater (P < 0.01) for Forager (1.13%) than for Johnstone (1.02%).
| Cultivar |
DMI (lbs/ 100 lbs2) |
Apparent Digestibilities1 (%) |
Digestible Intake (lbs/ 100 lbs2) |
||||||||
|---|---|---|---|---|---|---|---|---|---|---|---|
| DM | NDF | ADF | HEMI | CELL | DM | NDF | ADF | HEMI | CELL | ||
| Forager | 2.043 | 66.8 | 64.3 | 61.4 | 67.4 | 72.5 | 1.36 | 0.76 | 0.38 | 0.38 | 0.39 |
| Johnstone | 2.44 | 70.7 | 68.0 | 66.1 | 70.1 | 75.7 | 1.73 | 0.91 | 0.46 | 0.45 | 0.46 |
| Significance (P) | 0.05 | 0.04 | 0.11 | 0.11 | 0.13 | 0.14 | 0.03 | 0.08 | 0.09 | 0.08 | 0.08 |
1 NDF = neutral detergent fiber; ADF = acid detergent fiber; HEMI = hemicellulose; CELL = cellulose. ↲
2 Body weight basis. ↲
3 Each value is the mean of eight steers. ↲
| Cultivar |
IVDMD (%) |
CP (%) |
NDF (%) |
Fiber Fractions | |||
|---|---|---|---|---|---|---|---|
|
ADF (%) |
HEMI (%) |
CELL (%) |
Lignin (%) |
||||
| Forager | 59.72 | 13.7 | 57.8 | 30.2 | 27.7 | 26.1 | 3.1 |
| Johnstone | 66.0 | 11.6 | 55.1 | 28.6 | 26.5 | 25.1 | 2.8 |
| Significance (P) | (Composite samples analyzed and not tested for significance) | ||||||
1 CP = crude protein; NDF = neutral detergent fiber; ADF = acid detergent fiber; HEMI = hemicellulose; CELL = cellulose. ↲
2 Each value is the mean of eight samples. ↲
| Cultivar | Total Output | Nitrogen Status | ||||||
|---|---|---|---|---|---|---|---|---|
|
Intake (lbs/day) |
Present | Excreted | Retained (lbs/day) |
|||||
|
Urine (lbs/day) |
Feces (lbs/day) |
Urine (%) |
Feces (%) |
Urine (lbs/day) |
Feces (lbs/day) |
|||
| Forager | 9.01 | 2.9 | 0.189 | 0.83 | 2.23 | 0.075 | 0.063 | 0.051 |
| Johnstone | 12.5 | 2.7 | 0.183 | 0.80 | 2.14 | 0.098 | 0.059 | 0.029 |
| Significance (P) | 0.01 | 0.46 | 0.52 | 0.75 | 0.25 | 0.03 | 0.30 | 0.01 |
1 Each value is the mean of eight steers. ↲
Summary and Conclusions
- Steers readily consumed both Forager and Johnstone tall fescue hays.
- Johnstone tall fescue was higher in quality than Forager, displaying greater dry matter intake and dry matter digestion.
- Nutritive value of as-fed Johnstone hays may have been greater (not compared statistically) than that of Forager, which would be consistent with the observations of greater forage quality.
- Steers processed the two hays similarly, as no difference was noted in fecal particle size or fecal composition.
- The nitrogen status differed between forages; this was attributed mainly to greater quantities of nitrogen lost through urine from steers fed Johnstone compared with those fed Forager (0.98 vs. 0.75 pounds per day), resulting in lesser quantities retained in animals fed Johnstone compared with those fed Forager (0.026 vs. 0.051 pounds per day).
- Both Forager and Johnstone tall fescue can be used in production enterprises, with Johnstone generally being of greater quality when Forager and Johnstone are managed similarly.
Experiment 3. An Assessment of Nutritive Value and Quality of Jesup Tall Fescue Hay Infected with Either a Novel or a Wild-Type Endophyte
The persistence and survival of tall fescue in the north-south transition zone has been partly attributed to the presence of the endophyte Neotyphodium coenophialum, but this endophyte has also been linked to fescue toxicosis. Fescue toxicosis results in a collection of symptoms including economically important reductions in animal weight gains. An endophyte-free cultivar, Jesup, was developed in Georgia, being selected for improved stand survival. Further, a novel or nontoxic endophyte of N. coenophialum was incorporated into Jesup to improve stand persistence and is being marketed as MaxQ tall fescue.
The objective of this study was to determine whether the introduction of the novel endophyte altered the quality of Jesup compared with no endophyte (endophyte free) or with the presence of the wild-type (toxic) endophyte when fed to animals without long-term exposure to ergot alkaloids.
Materials and Methods
Three separate well-established stands of Jesup tall fescue served as the source of the experimental hays. One stand was Jesup tall fescue free of endophyte, the second was Jesup with the novel endophyte (MaxQ), and the third was Jesup with a wild-type (toxic) endophyte assumed to be capable of producing ergot-like alkaloids that can produce toxicosis. This resulted in the following three Jesup tall fescue treatments for evaluation:
- Hay with wild-type (toxic) endophyte (94% infected) present
- Hay with novel (MaxQ) or non-toxic endophyte (95% infected) present
- Hay free of endophyte (5% infected)
Endophyte infection levels were determined by randomly cutting basal tillers from each hay field prior to cutting (150 tillers) and submitting them for analysis to the Tall Fescue Endophyte Testing Laboratory, North Carolina Department of Agriculture and Consumer Services, Raleigh.
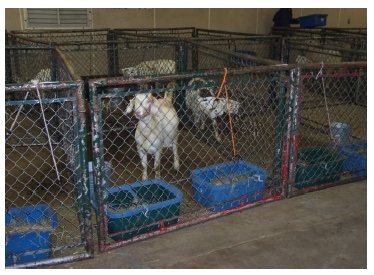
The fields were flail chopped on February 25 to remove the winter carryover and were topdressed with 70 pounds of nitrogen per acre. The experimental hays were cut June 29 with a mower conditioner, field cured, and baled with a conventional square baler. The bales were stored on wooden pallets in an experimental-hay barn at the NC State University Forage-Animal Metabolism Unit in Raleigh until processed (Appendix GP-1) and fed. The intake and digestibility of the three hays were evaluated using 18 Boer-Spanish cross goats (mean weight = 52 ± 2.2 pounds) in a randomized complete block design with six replicates. The goats were blocked by weight into groups of three and randomly assigned within block to the three treatments. Intake and digestion estimates were obtained (Appendix GP-2); during the experiment animals were fed 12.6% in excess.
All as-fed and weighback samples were analyzed for in vitro dry matter disappearance, neutral detergent fiber, acid detergent fiber, hemicellulose, cellulose, and lignin (Appendix GP-7). The data were analyzed statistically according to the design (Appendix GP-8).
Results and Discussion
Hay quality was generally not altered by the presence of either the novel or wild-type endophyte. The three treatments had similar dry matter intake (mean = 2.56 pounds per 100 pounds body weight), whole-tract dry matter digestion (mean = 60.5%), and digestible dry matter intake (mean = 1.55 pounds per 100 pounds body weight). Also, digestibility of the neutral detergent fiber was similar (mean = 62.6%) among hays, as was digestible neutral detergent fiber intake (mean = 1.09 pounds per 100 pounds body weight).
Examination of the nutritive value revealed that Jesup free of endophyte was greater in nutritive value than Jesup with the novel endophyte, having greater in vitro dry matter disappearance and crude protein and lesser neutral detergent fiber and constituent fiber fractions. Jesup with novel endophyte had greater in vitro dry matter disappearance and less hemicellulose than Jesup with the wild type. Although these differences were statistically significant, they did not result in differences in either dry matter intake or dry matter digestibility.
| Endophyte2 | DMI (lbs/100 lbs3) |
Digestibility | Digestible Intake | Nutritive Value | |||||||||
|---|---|---|---|---|---|---|---|---|---|---|---|---|---|
| Infection | Level | DM (%) |
NDF (%) |
DM (lbs/100 lbs3) |
NDF (lbs/100 lbs3) |
IVDMD (%) |
CP (%) |
NDF (%) |
ADF (%) |
HEMI (%) |
CELL (%) |
Lignin (%) |
|
| Wild type (WT) | 94 | 2.394 | 60.1 | 62.8 | 1.42 | 1.03 | 70.7 | 14.5 | 69.1 | 34.3 | 34.8 | 30.3 | 3.9 |
| Novel | 95 | 2.62 | 60.3 | 62.9 | 1.58 | 1.13 | 71.6 | 14.3 | 68.4 | 34.0 | 34.4 | 29.9 | 3.9 |
| Free | 5 | 2.67 | 61.2 | 62.0 | 1.64 | 1.12 | 73.8 | 14.8 | 67.1 | 33.2 | 33.9 | 29.0 | 3.7 |
| Significance (P): | |||||||||||||
| Infection: | - | 0.57 | 0.78 | 0.89 | 0.33 | 0.53 | <0.01 | 0.10 | <0.01 | 0.03 | <0.01 | 0.01 | 0.01 |
| Novel vs. WT | - | 0.42 | 0.89 | 0.96 | 0.29 | 0.31 | 0.03 | 0.40 | 0.07 | 0.41 | 0.03 | 0.32 | 0.42 |
| Novel vs. Free | - | 0.86 | 0.60 | 0.67 | 0.70 | 0.89 | <0.01 | 0.04 | 0.01 | 0.05 | 0.02 | 0.02 | 0.01 |
| MSD5 | - | 0.72 | 5.3 | 6.6 | 0.37 | 0.26 | 0.7 | 0.7 | 0.9 | 0.9 | 0.5 | 0.8 | 0.1 |
1 NDF = neutral detergent fiber; IVDMD = in vitro dry matter disappearance; CP = crude protein; ADF = acid detergent fiber; HEMI = hemicellulose; CELL = cellulose. ↲
2 Wild type associated with toxicosis; novel type nontoxic and marketed as MaxQ. ↲
3 Body weight basis. ↲
4 Each value is the mean of six goats or six samples (nutritive value). ↲
5 MSD = minimum significant difference from the Waller-Duncan k-ratio (k = 100) t test; can be used to compare any two treatments. ↲
Summary and Conclusions
- All three hays were readily consumed and similarly digested, indicating that presence of and differences in endophytes made no difference in animals’ digestion of dry matter.
- The nutritive values of the hays differed, with the hay made from fescue free of endophyte having greater nutritive value than hay containing the novel endophyte.
- The differences noted among hays in nutritive value apparently were not of sufficient scope to significantly alter estimates of hay quality.
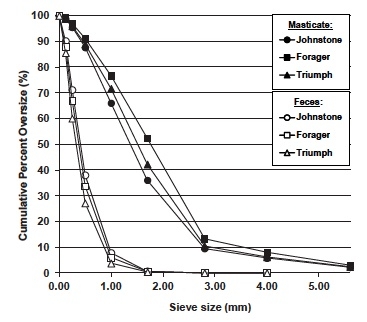
Figure 1.1. Dry matter distribution of masticate (Experiment 1B) and fecal particle sizes (Experiment 1A) from Johnstone, Forager, and Triumph tall fescue hays.
II. Evaluation of Tall Fescue at Differing Maturities
As plants mature from the early vegetative stages through stem elongation to heading, crude protein concentration generally decreases, and fiber fractions increase. This is associated with a greater proportion of the dry matter composed of stem and the relatively greater cell-wall thickening found in stem tissue. Associated with this decline in nutritive value and quality, however, is the increase in harvestable dry matter, which continues into seed formation. The producer is constantly faced with the decision of balancing declining nutritive value of the forage to be cut and preserved as hay while maximizing dry matter yield per acre.
Experiment 4. The Influence of Maturity of Initial Tall Fescue Growth Cut for Hay on Steer Intake and Digestibility
Generally, tall fescue is cut and conserved as hay when the forage matures to the early-boot stage. This maturity generally provides a good balance between nutritive value of the tissue and desirable dry matter yield per acre. Large (but poorly quantified) declines in nutritive value occur if the cutting of tall fescue is delayed past the boot stage to increase the harvestable yield. The objective of this experiment was to determine the change in nutritive value and subsequent dry matter intake and whole-tract dry matter digestion as tall fescue matures from the late-boot stage into the seed stage.
Materials and Methods
A well-established stand of Kentucky 31 tall fescue served as the source of the experimental hays. The accumulated winter growth was removed in early March with a flail chopper set to a 3-inch stubble, blown into a self-unloading wagon, and removed from the site. The field was subsequently topdressed with 90 pounds of nitrogen per acre in preparation for the production of the experimental hays. Four sequential harvests were made with a conventional mower-conditioner beginning May 14 with forage in the late-boot stage through seed set. The four treatments evaluated are noted as follows:
- Cut May 14, late-boot stage with heads starting to emerge at 23% dry matter and a forage mass of 4,957 pounds per acre
- Cut May 24, in anthesis at 31% dry matter and a forage mass of 5,699 pounds per acre
- Cut June 11, seed filling at 34% dry matter and a forage mass of 8,340 pounds per acre
- Cut June 28, hard-dough stage at 33% dry matter and a forage mass similar to treatment 3
These treatments encompassed the physiological growth stages over which major changes occur in nutritive value.
For purposes of estimating change over time, the first cut was taken May 14, representing day 0, followed by cuts on May 24 (day 10), June 11 (day 28), and June 28 (day 45). Each treatment was cut to about 2 inches, tedded daily, and baled with a conventional square baler when field cured. The baled hay was transported to the NC State University Forage-Animal Metabolism Unit in Raleigh and stored on wooden pallets in an experimental hay-storage barn until feeding. The hays were processed (Appendix GP-1) and retained in feeding carts until fed.
A 4 × 4 Latin square design was used. Four Angus steers of similar weight (mean = 490 ± 29.6 pounds) were used and assigned at random to a series of treatments in the Latin square for estimates of intake and digestibility (Appendix GP-2). Steers were fed during the experiment at 14.5% excess. Particle size distribution of the feces was determined (Appendix GP-5), and the as-fed and weighback samples of the hays were analyzed for dry matter, in vitro dry matter disappearance, crude protein, neutral detergent fiber, acid detergent fiber, hemicellulose, cellulose, and lignin (Appendix GP-7). The fecal particle sizes were also analyzed for neutral detergent fiber. All data were analyzed statistically according to the experimental design (Appendix GP-8).
Results and Discussion
Tall fescue cut for hay in the late-boot stage was consumed by steers at 2.24 pounds per 100 pounds of body weight, with a dry matter digestion of 65.6% and crude protein in excess of 13% (Table 4.1). The digestibility and crude protein concentrations would support daily gain of about 1.5 pounds for a 600 pound steer; however, the dry matter intake was inadequate, limiting gain to about 1 pound per day. Delaying harvest to June 28, 45 days after the initial cut, reduced dry matter intake linearly (in a line without curves) as well as digestion of dry matter, neutral detergent fiber, and hemicellulose. Not all responses were linear. Cellulose digestion was reduced quadratically (in a curved manner; Table 4.1). A lack of fit (multiple curves) is noted for acid detergent fiber digestion and is associated with little change between days 10 and 28 and with further reduction in acid detergent fiber digestion between days 28 and 45. The digestible intakes all had strong linear declines with increasing maturity, with the quadratic component becoming significant for dry matter and acid detergent fiber and associated with the rate of decline between days 10 and 28 (Table 4.1). A polynomial equation with appropriate coefficients for an animal response variable of interest has been provided to estimate values for any day between days 0 and 45 (Table 4.2).
Changes in the as-fed hays reflect steer responses, with in vitro dry matter disappearance decreasing quadratically and crude protein decreasing linearly with increasing maturity (Table 4.3). Concentrations of neutral detergent fiber and its fiber constituents of acid detergent fiber, cellulose, and lignin increased linearly with advancing maturity, whereas hemicellulose concentrations were not altered. Selective consumption was evident, with the difference value for neutral detergent fiber being positive, i.e., greater concentrations in the weighback, and difference values for in vitro dry matter disappearance and crude protein were negative (Table 4.3). Increasing maturity influenced only the difference value for crude protein, giving a quadratic response with increasing maturity that was especially evident at the day 45 cut. The concentration of a specific nutritive value constituent can be obtained for any day between day 0 and day 45 from the data in Table 4.2, as noted above. The relationships among dry matter intake, dry matter digestion, digestible dry matter intake, and neutral detergent fiber concentrations are more readily viewed in figure format (Figure 4.1).
The influence of tall fescue maturity on the way steers processed the hays was examined in terms of fecal particle-size distribution and the neutral detergent fiber concentration of the particle-size fractions. In general, tall fescue maturity had no significant effect on particles within a sieve size or on cumulative percentage oversize. However, neutral detergent fiber of the particle dry matter gave quadratic responses (P ≤ 0.01) with increasing maturity.
| Date of Cut | Days of Growth1 |
DMI (lbs/100 lbs2) |
Apparent Digestibilities1 |
Digestible Intakes |
||||||||
|---|---|---|---|---|---|---|---|---|---|---|---|---|
|
DM (%) |
NDF (%) |
ADF (%) |
HEMI (%) |
CELL (%) |
DM (lbs/100 lbs2) |
NDF (lbs/100 lbs2) |
ADF (lbs/100 lbs2) |
HEMI (lbs/100 lbs2) |
CELL (lbs/100 lbs2) |
|||
| May 14 | 0 | 2.243 | 65.6 | 64.1 | 61.2 | 67.9 | 69.6 | 1.47 | 0.96 | 0.52 | 0.44 | 0.49 |
| May 24 | 10 | 1.98 | 58.5 | 58.3 | 48.7 | 68.3 | 59.5 | 1.15 | 0.85 | 0.43 | 0.39 | 0.42 |
| June 11 | 28 | 1.82 | 53.0 | 50.5 | 47.4 | 54.8 | 56.5 | 0.97 | 0.65 | 0.37 | 0.29 | 0.35 |
| July 28 | 45 | 1.72 | 47.7 | 48.8 | 44.3 | 55.7 | 53.3 | 0.82 | 0.62 | 0.33 | 0.29 | 0.32 |
|
Significance (P): |
||||||||||||
| Date of cut: | 0.01 | <0.01 | 0.01 | <0.01 | 0.08 | 0.01 | <0.01 | <0.01 | <0.01 | 0.01 | <0.01 | |
| Linear | <0.01 | <0.01 | <0.01 | <0.01 | 0.02 | <0.01 | <0.01 | <0.02 | <0.01 | <0.01 | <0.01 | |
| Quadratic | 0.14 | 0.10 | 0.20 | <0.01 | 0.51 | 0.03 | 0.01 | 0.10 | 0.03 | 0.21 | 0.09 | |
| Lack of fit | 0.36 | 0.16 | 0.95 | 0.01 | 0.29 | 0.08 | 0.06 | 0.75 | 0.23 | 0.59 | 0.63 | |
1 NDF = neutral detergent fiber; ADF = acid detergent fiber; HEMI = hemicellulose; CELL = cellulose. ↲
2 Body weight basis. ↲
3 Each value is the mean of four steers. ↲
| Variableb | Intercept (a) |
Componenta |
R2 | |
|---|---|---|---|---|
| Linear (b1) | Quadratic (b2) | |||
|
In vivo response |
||||
|
Intake (lbs/100lbs body weight) |
||||
| DM | 2.17 | -0.011 | - | 0.89 |
| Digestible DM | 1.39 | -0.014 | - | 0.91 |
|
Digestibility (%) |
||||
| DM | 64.3 | -0.385 | - | 0.96 |
| CP | 64.2 | -0.599 | - | 0.98 |
| NDF | 64.9 | -0.774 | 0.009 | 0.99 |
|
Constituents of digestible intake (lbs/100 lbs body weight) |
||||
| CP | 0.20 | -0.006 | 7x10⁻⁵ | 0.99 |
| NDF | 0.93 | -0.008 | - | 0.92 |
| CELL | 0.47 | -0.004 | - | 0.92 |
|
Nutritive value |
||||
| 48-hr DM disappearance | 59.5 | -0.358 | - | 0.94 |
| NDF concentration | 67.5 | 0.144 | - | 0.96 |
a The greatest significant (P < 0.05) component of the equation is given. ↲
b DM = dry matter; CP = crude protein; NDF = neutral detergent fiber; CELL = cellulose. ↲
| Date of Cut | Days of Growth | IVDMD | CP |
NDF |
Fiber Fractions | ||||||
|---|---|---|---|---|---|---|---|---|---|---|---|
|
AF (%) |
DV2 (%) |
AF (%) |
DV2 (%) |
AF (%) |
DV2 (%) |
ADF (%) |
HEMI (%) |
CELL (%) |
Lignin (%) |
||
| May 14 | 0 | 61.13 | -1.0 | 13.1 | -0.7 | 67.1 | 1.6 | 38.3 | 28.7 | 31.4 | 6.2 |
| May 24 | 10 | 54.1 | -1.3 | 11.2 | -0.4 | 69.7 | 1.1 | 41.5 | 28.2 | 33.2 | 7.4 |
| June 11 | 28 | 48.2 | -1.6 | 9.2 | -0.2 | 71.3 | 1.9 | 42.6 | 28.7 | 33.9 | 8.0 |
| July 28 | 45 | 44.6 | -3.6 | 8.9 | -1.8 | 73.9 | 1.2 | 44.0 | 29.9 | 34.7 | 8.7 |
|
Significance (P): |
|||||||||||
| Date of cut: | <0.01 | 0.62 | <0.01 | 0.04 | <0.01 | 0.96 | <0.01 | 0.20 | <0.01 | 0.01 | |
| Linear | <0.01 | 0.24 | <0.01 | 0.05 | <0.01 | 0.98 | <0.01 | 0.09 | <0.01 | <0.01 | |
| Quadratic | 0.03 | 0.63 | 0.11 | 0.03 | 0.57 | 0.86 | 0.13 | 0.20 | 0.12 | 0.28 | |
| Lack of fit | 0.28 | 0.84 | 0.92 | 0.67 | 0.25 | 0.63 | 0.13 | 0.63 | 0.14 | 0.21 | |
1 CP = crude protein; NDF = neutral detergent fiber; ADF = acid detergent fiber; HEMI = hemicellulose; CELL= cellulose. ↲
2 DV = difference value (weighback concentration minus AF concentration). ↲
3 Each value is the average of daily subsamples and the mean of four steers. ↲
Summary and Conclusions
- Tall fescue was readily consumed by steers at all maturities.
- Tall fescue in the late-boot stage had greatest dry matter intake, at 2.24 pounds per 100 pounds of body weight, with a dry matter digestion of 65.6% and crude protein of 13.1%. However, this dry matter intake would not support desirable daily steer performance.
- The emergence of heads and the following seed set reduced dry matter intake and apparent digestibilities of dry matter and constituent fiber fractions.
- For maximum daily performance, tall fescue should be cut in the vegetative stage, as reduction in dry matter intake had already occurred by late boot. This is less of an issue for animals fed for maintenance (mature dry cows).
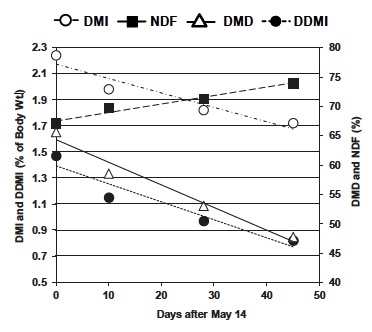
Figure 4.1. The influence of increasing maturity of tall fescue on neutral detergent fiber (NDF) concentration of Kentucky 31 hay and steer dry matter intake (DMI), dry matter digestion (DMD), and digestible dry matter intake (DDMI).
III. Evaluation of the Influence of Drying Methods on Nutritive Value and Quality of Tall Fescue
When green forage plants are cut for hay, their respiration rate temporarily increases, and the nutritive value of the tissue declines. The magnitude of these changes is dependent on drying conditions and how quickly drying results in the cessation of respiration. Studies have shown that rapid drying terminates the respiratory process and preserves nutritive value, but this generally requires supplemental heat. Supplemental heat applied to forages with appreciable soluble carbohydrates and nitrogen can initiate the Maillard (browning) reaction, resulting in an increased proportion of dry matter that is not readily digested. The use of quick freezing with liquid nitrogen and freeze drying is appropriate for the preservation of forage samples when the compositional results are applied to the green plant (i.e., in grazing experiments).
Experiment 5. The Influence of Drying Methods on Dry Matter Intake and Digestibility of Direct-Cut Tall Fescue Forage
Generally, rapidly removing moisture from plants prevents losses in nutritive value through respiratory processes. This experiment compares the nutritive value and quality of tall fescue when dried using different methods.
Materials and Methods
A well-established stand of Kentucky 31 tall fescue served as the source of the experimental forage. The field was clipped in late August and fertilized with 70 pounds of nitrogen per acre in preparation for fall growth that was harvested for the experiment. Five methods of drying were evaluated after the accumulated forage had ceased growth. The first treatment was harvested November 17, and the last treatment was harvested on November 19. The five treatments were as follows:
- Freeze dried
- Field cured
- Dried at 100°F
- Dried at 145°F
- Dried at 190°F
Forage for the freeze-dried treatment (treatment 1) was cut with a flail chopper (to aid processing) to a 3-inch stubble, windrowed, and baled green with a conventional square baler. Forage was transported to a field laboratory in bales that were then opened and divided into sheaves of 4 to 6 pounds, placed in cloth bags, and held in a freezer (5°F) until freeze dried. Forage for the field-cured treatment (treatment 2) was flail chopped to a 3-inch stubble and placed on the stubble through the open door at the back of the flail chamber. After field drying, it was windrowed and baled with a conventional square baler. The bales were stored on wooden pallets in an experimental hay-storage barn at the NC State University Forage-Animal Metabolism Unit in Raleigh. Forages for the other three treatments (treatments 3, 4, and 5) were cut with a flail chopper to a 3-inch stubble, blown into a self-unloading wagon, and transferred into the bulk-drying barn at the Forage-Animal Metabolism Unit. The inlet temperature was varied to produce the three treatments. The hays were processed prior to feeding (Appendix GP-1).
Because of the limited quantities of the freeze-dried treatment, two experiments were conducted. In one experiment (Experiment 5A), dry matter intake was determined for treatments 2 through 5 using steers (mean weight = 559 ± 24.9 pounds) in a 4 × 4 Latin square design and fed at 13.2% excess (Appendix GP-2). We did not have sufficient quantities of treatment 1 for a feeding trial with steers. Dry matter and fiber digestion were determined in the second experiment with sheep (Experiment 5B) using all five treatments. In Experiment 5B, five sheep in a 5 × 5 Latin square design and fed at 13.2% excess were used for evaluation (Appendix GP-2). The freeze-dried treatment (treatment 1) was not available in adequate quantities to complete the last period. All as-fed and weighback samples were analyzed for in vitro dry matter disappearance. These samples and fecal samples were also analyzed for crude protein, neutral detergent fiber, and constituent fiber fractions (Appendix GP-7). All data were analyzed statistically according to the experimental design (Appendix GP-8).
Results and Discussion
Experiment 5A.
The field-cured hay was consumed in greater amounts than the forced air-dried hays (Table 5.1). Among the hays dried with heated forced air, the hays dried at 145°F and190°F were consumed in similar amounts and in greater quantities than hay dried at 100°F. These results were also reflected in nutritive value estimates. The field-cured hay was greater in in vitro dry matter disappearance and less in neutral detergent fiber and its constituent acid detergent fiber, cellulose, and lignin, compared with the dried treatments. The 100°F treatment had greater concentrations of neutral detergent fiber and cellulose compared with the 145°F and 190°F treatments, which were similar. Selective consumption was only significant for in vitro dry matter disappearance of the 100°F vs. the 145°F and 190°F treatments. This indicates that steers may have been somewhat more selective when consuming the 100°F treatment.
| Drying Method |
DMI (lbs/100 lbs3) |
IVDMD | CP | NDF | Fiber Fractions1 | ||||||
|---|---|---|---|---|---|---|---|---|---|---|---|
|
AF (%) |
DV2 (%) |
AF (%) |
DV (%) |
AF (%) |
DV (%) |
ADF (%) |
HEMI (%) |
CELL (%) |
Lignin (%) |
||
| Field cured (FC) | 2.294 | 64.1 | -1.9 | 14.3 | -1.3 | 53.3 | 2.5 | 26.7 | 26.6 | 22.8 | 3.3 |
|
Forced air-dried (FA): |
|||||||||||
| 100°F (100) | 1.60 | 57.4 | -7.5 | 12.9 | 0.5 | 58.7 | 1.5 | 31.2 | 27.6 | 25.8 | 4.4 |
| 145°F (145) | 1.88 | 58.5 | -1.3 | 12.4 | 0.1 | 56.7 | 0.7 | 30.6 | 26.1 | 24.1 | 4.1 |
| 190°F (190) | 1.90 | 59.8 | -4.0 | 12.0 | 1.4 | 56.8 | 0.4 | 29.2 | 27.6 | 24.7 | 3.9 |
|
Significance (P): |
|||||||||||
| Drying method: | <0.01 | <0.01 | 0.02 | 0.37 | 0.29 | <0.01 | 0.32 | 0.01 | 0.15 | <0.01 | 0.07 |
| FC vs. FA | <0.01 | <0.01 | 0.08 | 0.12 | 0.10 | <0.01 | 0.12 | <0.01 | 0.46 | <0.01 | 0.02 |
| 100 vs. (145+190)/2 | 0.01 | 0.15 | 0.01 | 0.56 | 0.84 | <0.01 | 0.36 | 0.20 | 0.25 | 0.01 | 0.20 |
| 145 vs. 190 | 0.85 | 0.33 | 0.10 | 0.76 | 0.35 | 0.89 | 0.81 | 0.19 | 0.06 | 0.20 | 0.52 |
1 IVDMD = in vitro dry matter disappearance; CP = crude protein; NDF = neutral detergent fiber; ADF = acid detergent fiber; HEMI = hemicellulose; CELL = cellulose. ↲
2 DV = difference value (weighback concentration minus AF concentration). ↲
3 Expressed on a body weight basis. ↲
4 Each value is the mean of four steers or four hay samples (as appropriate). ↲
| Drying Method | Digestibility | IVDMD | CP | NDF | ADF |
HEMI (%) |
CELL (%) |
Lignin (%) |
||||||||
|---|---|---|---|---|---|---|---|---|---|---|---|---|---|---|---|---|
|
DM (%) |
NDF (%) |
ADF (%) |
HEMI (%) |
CELL (%) |
AF (%) |
DV (%) |
AF (%) |
DV (%) |
AF (%) |
DV (%) |
AF (%) |
N (%) |
||||
| Freeze dried (FD) | 61.72 | 54.5 | 51.1 | 58.6 | 62.0 | 58.0 | -10.8 | 12.0 | -0.7 | 55.8 | 8.3 | 29.2 | 1.9 | 26.5 | 24.0 | 4.2 |
| Field cured (FC) | 64.9 | 59.5 | 54.8 | 64.2 | 63.9 | 60.4 | -2.2 | 14.6 | -1.6 | 54.8 | 3.9 | 27.4 | 2.3 | 27.3 | 22.8 | 3.8 |
| Forced air-dried (FA): | ||||||||||||||||
| 100°F (100) | 57.7 | 54.1 | 47.6 | 60.5 | 59.1 | 55.3 | -9.9 | 13.4 | -0.2 | 59.6 | 5.1 | 30.9 | 2.1 | 28.7 | 24.5 | 4.9 |
| 145°F (145) | 58.5 | 51.9 | 47.4 | 56.9 | 57.0 | 60.6 | -10.5 | 13.1 | -0.6 | 56.0 | 5.5 | 29.9 | 2.1 | 26.1 | 23.6 | 4.3 |
| 190°F (190) | 61.3 | 55.4 | 48.8 | 61.5 | 59.5 | 60.8 | -12.3 | 13.5 | 0.7 | 56.1 | 4.3 | 28.3 | 2.1 | 27.7 | 22.2 | 4.1 |
| Significance (P): | ||||||||||||||||
| Drying method: | 0.26 | 0.49 | 0.38 | 0.51 | 0.45 | 0.01 | 0.01 | 0.04 | <0.01 | 0.18 | 0.51 | 0.03 | 0.04 | 0.47 | 0.03 | 0.01 |
| FD vs. (FC+FA)/2 | 0.74 | 0.87 | 0.73 | 0.60 | 0.58 | 0.37 | 0.41 | 0.02 | 0.48 | 0.66 | 0.12 | 0.97 | 0.02 | 0.53 | 0.31 | 0.82 |
| FC vs. FA | 0.05 | 0.11 | 0.06 | 0.20 | 0.11 | 0.25 | <0.01 | 0.03 | <0.01 | 0.15 | 0.57 | 0.01 | 0.03 | 0.90 | 0.26 | 0.01 |
| 100 vs. (145+190)/2 | 0.45 | 0.92 | 0.89 | 0.73 | 0.79 | <0.01 | 0.47 | 0.82 | 0.51 | 0.05 | 0.90 | 0.06 | 0.82 | 0.17 | 0.01 | 0.01 |
| 145 vs. 190 | 0.42 | 0.41 | 0.73 | 0.29 | 0.52 | 0.86 | 0.48 | 0.58 | 0.01 | 0.96 | 0.57 | 0.14 | 0.58 | 0.28 | 0.06 | 0.37 |
1 IVDMD = in vitro dry matter disappearance; CP = crude protein; NDF = neutral detergent fiber; ADF = acid detergent fiber; N = nitrogen; HEMI = hemicellulose; CELL = cellulose. ↲
2 Each value is the mean of five (three for the FD treatment) wether sheep or five (three for the FD treatment) hay samples (as appropriate). ↲
The sheep trial revealed that field-cured hay was greater in whole-tract dry matter digestibility, averaging 64.9%, compared with the other treatments (mean = 59.8%), which were all similar (Table 5.2). The neutral detergent fiber fraction and its constituent fiber fractions were also generally similar in digestibility. The freeze-dried forage had less crude protein and less nitrogen in the acid detergent fiber fraction than did the field-cured and forced air-dried treatments. Also, field-cured forage had greater crude protein and less acid detergent fiber and lignin compared with the forced air-dried treatments, but greater nitrogen in the acid detergent fiber fraction. Likewise, the 100°F treatment had less in vitro dry matter disappearance and greater neutral detergent fiber and constituent cellulose and lignin compared with treatments dried at 145°F and 190°F, which were generally similar. Some degree of selective consumption was noted, with the difference value (weighback concentration minus as-fed concentration) for in vitro dry matter disappearance being less for the field-cured vs. forced-air-dried treatments, and with crude protein being greater. This indicates more selective feeding of leafy tissue in the forced air-dried treatments.
Fecal samples from the digestion study revealed greater lignin concentrations in the freeze-dried treatment compared with the other treatments, as well as greater concentrations of lignin in the 190°F treatment compared with the 145°F treatment (Table 5.3). This is frequently associated with external heat and raises a question regarding shelf temperature in the freeze-dried treatment. This may, in part, explain the unexpected low dry matter digestion and digestion of the neutral detergent fiber and its constituent fractions (Table 5.2). Further, field-cured hays had less neutral detergent fiber and acid detergent fiber compared with the forced-air-dried treatments. The greater fiber concentrations represent a plant response to elevated drying temperatures.
Summary and Conclusions
- Field curing of hay resulted in forage of the greatest nutritive value and quality.
- When drying hay with forced air, the use of higher temperatures to remove moisture more rapidly produced superior results compared with the use of lower temperatures.
- Treatments dried at 145°F and 190°F displayed little difference in nutritive value and quality.
| Drying Method |
CP (%) |
NDF (%) |
ADF (%) |
ADF-N (%) |
HEMI (%) |
CELL (%) |
Lignin (%) |
|---|---|---|---|---|---|---|---|
| Freeze dried (FD) | 13.22 | 64.9 | 36.9 | 2.1 | 27.8 | 23.7 | 10.1 |
| Field cured (FC) | 13.3 | 62.1 | 34.6 | 2.1 | 27.5 | 23.2 | 8.9 |
| Forced air-dried (FA): | |||||||
| 100°F (100) | 13.0 | 63.8 | 37.0 | 2.1 | 26.8 | 23.7 | 9.7 |
| 145°F (145) | 12.7 | 63.8 | 36.7 | 2.0 | 27.2 | 24.5 | 8.7 |
| 190°F (190) | 13.5 | 63.4 | 36.1 | 2.2 | 27.3 | 23.6 | 9.6 |
| Significance (P): | |||||||
| Drying method: | 0.77 | 0.09 | 0.03 | 0.77 | 0.40 | 0.64 | 0.03 |
| FD vs. (FC+FA)/2 | 0.87 | 0.06 | 0.30 | 0.87 | 0.24 | 0.94 | 0.04 |
| FC vs. FA | 0.63 | 0.03 | <0.01 | 0.63 | 0.23 | 0.28 | 0.25 |
| 100 vs. (145+190)/2 | 0.82 | 0.82 | 0.35 | 0.82 | 0.29 | 0.65 | 0.13 |
| 145 vs. 190 | 0.25 | 0.61 | 0.50 | 0.25 | 0.87 | 0.30 | 0.05 |
1 CP = crude protein; NDF = neutral detergent fiber; ADF = acid detergent fiber; ADF-N = nitrogen of the ADF fraction; HEMI = hemicellulose; CELL = cellulose. ↲
2 Each value is the mean of five (three for the FD treatment) wether sheep or five (three for the FD treatment) hay samples (as appropriate). ↲
Experiment 6. The Influence of Drying Method on Dry Matter Intake and Dry Matter Digestion of Fall- Accumulated Kentucky 31 Tall Fescue
This experiment is a partial repeat of Experiment 5 with the addition of an ambient-air treatment in which forced air was used but with limited heat. The objective of the experiment was to further evaluate the drying methods evaluated in Experiment 5 and determine whether drying with minimal heat input would alter forage nutritive value and quality.
Materials and Methods
A well-established stand of Kentucky 31 tall fescue served as the source of the experimental forage. The field was flail chopped in late August to a 2-inch stubble, the forage was removed, and the field was topdressed with 70 pounds of nitrogen per acre to stimulate fall growth. The subsequent forage growth was harvested to produce the experimental hays. Harvest for the treatments was initiated November 26 using either a flail chopper or a conventional mover conditioner, depending on treatment, with both set to leave a 2.5-inch stubble. The forage to be frozen was cut and immediately baled with a conventional square baler. The bales were transported to a field laboratory and opened, and subsamples of 4 to 6 pounds were placed in either plastic or cloth bags (depending on treatment) and placed in a freezer (5° F). Forage in plastic bags remained frozen and was thawed prior to feeding (treatment 1). Forage placed in cloth bags was freeze dried prior to feeding (treatment 2). Forage to be forced-air dried was flail chopped into a self-unloading wagon and placed into a bulk drying barn at the NC State University Forage-Animal Metabolism Unit in Raleigh and processed (Appendix GP-1). The six treatments compared in this experiment are described below:
- Fresh frozen (FF) — Forage cut, immediately baled green at 36% dry matter, placed in plastic bags to prevent moisture loss, and placed in a freezer at -20°F.
- Freeze dried (FD) — Forage cut and immediately baled green at 37% dry matter. Baled segments of about 4 inches placed in cloth bags for freeze drying and then placed in a freezer at -20°F until freeze dried.
- Ambient (AB) — Forage flail chopped, placed into a bulk drying barn at 35% dry matter, and forced-air dried at 55°F to 65°F.
- Dried at 100°F (100F) — Forage flail chopped, placed into a bulk drying barn at 41% dry matter, and forced-air dried at 100°F.
-
Dried at 145°F (145F) — Forage flail chopped, placed into a bulk drying barn at 31% dry matter, and force-air dried at 145°F.
-
Dried at 190°F (190F) — Forage flail chopped, placed into a bulk drying barn at 40% dry matter, and forced-air dried at 190°F.
Two experiments were conducted. The first experiment used steers (Experiment 6A) to test for the influence of applying increasing temperatures to dry fresh-cut forage on dry matter intake. A second experiment (Experiment 6B) used sheep to test for the influence of freezing, freeze drying, and applying increasing temperatures to a batch of forage on whole-tract dry matter digestibility and digestion of the constituent fiber fractions.
In Experiment 6A, dry matter intake among treatments was estimated with steers (Appendix GP-2). Because of limited freezer capacity, only treatments 3 through 6 were available in sufficient quantities to be evaluated by steers. A 4 × 4 Latin square experimental design was used. Four Angus steers of similar weight (mean = 467 ± 4.7 pounds) were assigned at random to a treatment series making up the four periods. Steers were fed at 14.5% excess for the experiment (mean of four periods).
Whole-tract dry matter digestibility and digestibility of neutral detergent fiber and fiber constituents were determined for all six treatments using wether sheep (Experiment 6B). A 6 × 6 Latin square design was used. Six Katahdin sheep of similar weight (mean = 147 ± 8 pounds) were assigned at random to a treatment series for the six periods. These two experiments measured intake with steers and digestion with sheep (Appendix GP-2).
Prior to harvesting, the stockpiled forage was sampled for endophyte infection and was found to be 86.5% infected. This level of infection was uniform among treatments. The as-fed forage, and weighback from both experiments, and the fecal samples from the digestion experiment, were analyzed for crude protein, neutral detergent fiber, acid detergent fiber, hemicellulose, cellulose, lignin, and nitrogen of the acid detergent fraction (Appendix GP-7). Total daily urine and fecal output were determined, as were total daily nitrogen excreted in urine and feces (Appendices GP-2, GP-7). All data were analyzed statistically according to the experimental design (Appendix GP-8).
|
Preservation Method |
DM | CP | NDF | Fiber Fraction | |||||||
|---|---|---|---|---|---|---|---|---|---|---|---|
|
Intake (lbs/100 lbs3) |
Excess (%) |
AF (%) |
DV2 (%) |
AF (%) |
DV (%) |
ADF (%) |
HEMI (%) |
CELL (%) |
Lignin (%) |
||
| Ambient (AB) | 2.324 | 14.3 | 16.3 | -0.6 | 53.8 | 3.1 | 27.8 | 26.0 | 23.8 | 3.2 | |
| 100°F (100F) | 2.11 | 16.4 | 15.0 | -0.6 | 56.1 | 2.9 | 30.0 | 26.1 | 25.2 | 3.8 | |
| 145°F (145F) | 2.04 | 14.0 | 15.6 | -0.3 | 55.8 | 2.7 | 29.7 | 26.2 | 24.5 | 3.7 | |
| 190°F (190F) | 2.43 | 13.1 | 15.3 | -0.2 | 56.6 | 3.5 | 31.0 | 25.6 | 25.2 | 4.7 | |
| Significance (P): | |||||||||||
| Preservation method: | 0.44 | 0.39 | 0.02 | 0.67 | 0.38 | 0.95 | 0.05 | 0.89 | 0.19 | <0.01 | |
| AB vs. others | 0.55 | 0.89 | 0.01 | 0.55 | 0.11 | 0.91 | 0.01 | 0.96 | 0.06 | <0.01 | |
| 100F vs. (145F+190F)/2 | 0.58 | 0.12 | 0.13 | 0.41 | 0.94 | 0.90 | 0.69 | 0.76 | 0.59 | 0.03 | |
| 145F vs. 190F | 0.17 | 0.63 | 0.37 | 0.53 | 0.67 | 0.59 | 0.19 | 0.50 | 0.36 | <0.01 | |
1 CP = crude protein; NDF = neutral detergent fiber; ADF = acid detergent fiber; HEMI = hemicellulose; CELL = cellulose. ↲
2 DV = difference value (weighback concentration minus AF concentration). ↲
3 Body weight basis. ↲
4 Each value is the mean of three steers. ↲
|
Preservation Method |
Excess Fed (%) |
Digestibilities1 | ||||
|---|---|---|---|---|---|---|
|
DM (%) |
NDF (%) |
ADF (%) |
HEMI (%) |
CELL (%) |
||
| Fresh frozen (FF) | 16.52 | 65.9 | 44.0 | 38.6 | 50.1 | 53.8 |
| Freeze dried (FD) | 13.6 | 70.7 | 61.5 | 57.4 | 65.7 | 66.6 |
| Ambient (AB) | 10.7 | 68.7 | 60.5 | 55.6 | 65.8 | 66.5 |
| 100°F (100F) | 16.4 | 60.0 | 52.0 | 46.4 | 58.3 | 59.4 |
| 145°F (145F) | 15.9 | 62.7 | 53.9 | 44.9 | 63.9 | 63.0 |
| 190°F (190F) | 19.2 | 59.3 | 51.4 | 45.7 | 58.0 | 60.1 |
| Significance (P): | ||||||
| Preservation method: | 0.21 | <0.01 | <0.01 | <0.01 | <0.01 | <0.01 |
| (FF+FD+AB)/3 vs. others | 0.07 | <0.01 | 0.16 | 0.04 | 0.79 | 0.35 |
| FF vs. (FD+AB)/2 | 0.13 | 0.01 | <0.01 | <0.01 | <0.01 | <0.01 |
| FD vs. AB | 0.39 | 0.24 | 0.79 | 0.65 | 0.99 | 0.97 |
| 100F vs. (145F+190F)/2 | 0.67 | 0.49 | 0.82 | 0.74 | 0.34 | 0.35 |
| 145F vs. 190F | 0.31 | 0.04 | 0.46 | 0.83 | 0.08 | 0.29 |
1 NDF = neutral detergent fiber; ADF = acid detergent fiber; HEMI = hemicellulose; CELL = cellulose. ↲
2 Each value is the mean of six sheep. ↲
|
Preservation Method |
CP | NDF | Fiber Fractions | ||||||
|---|---|---|---|---|---|---|---|---|---|
| AF (%) |
DV2 (%) |
AF (%) |
DV (%) |
ADF (%) |
HEMI (%) |
CELL (%) |
Lignin (%) |
ADF-N (%) |
|
| Fresh frozen (FF) | 15.93 | -1.3 | 42.3 | 22.9 | 22.3 | 20.0 | 19.1 | 3.4 | 0.30 |
| Freeze dried (FD) | 14.5 | -0.5 | 49.3 | 8.5 | 25.7 | 23.5 | 21.7 | 3.4 | 0.37 |
| Ambient (AB) | 15.1 | -0.2 | 49.9 | 8.1 | 26.4 | 23.5 | 22.0 | 2.7 | 0.40 |
| 100°F (100F) | 133 | -0.3 | 54.6 | 7.3 | 29.2 | 25.4 | 24.1 | 4.0 | 0.45 |
| 145°F (145F) | 14.0 | -0.9 | 52.7 | 8.5 | 29.2 | 23.5 | 22.5 | 4.2 | 0.48 |
| 190°F (190F) | 15.0 | -1.5 | 55.2 | 6.0 | 29.9 | 25.3 | 24.3 | 4.5 | 0.53 |
| Significance (P): | |||||||||
| Preservation method: | <0.01 | 0.21 | <0.01 | <0.01 | <0.01 | <0.01 | <0.01 | <0.01 | <0.01 |
| (FF+FD+AB)/3 vs. others | <0.01 | 0.53 | <0.01 | <0.01 | <0.01 | <0.01 | <0.01 | <0.01 | <0.01 |
| FF vs. (FD+AB)/2 | 0.03 | 0.07 | <0.01 | <0.01 | <0.01 | <0.01 | <0.01 | 0.01 | 0.01 |
| FD vs. AB | 0.33 | 0.69 | 0.51 | 0.81 | 0.36 | 0.95 | 0.54 | 0.96 | 0.34 |
| 100F vs. (145F+190F)/2 | 0.03 | 0.10 | 0.53 | 0.99 | 0.58 | 0.04 | 0.07 | 0.14 | 0.04 |
| 145F vs. 190F | 0.08 | 0.39 | 0.01 | 0.09 | 0.34 | <0.01 | <0.01 | 0.34 | 0.12 |
1 CP = crude protein; NDF = neutral detergent fiber; ADF = acid detergent fiber; HEMI = hemicellulose; CELL = cellulose; ADF-N = nitrogen of the ADF fraction. ↲
2 DV = difference value (weighback concentration minus AF concentration). ↲
3 Each value is the mean of six sheep. ↲
|
Preservation Method |
Urine | Feces | |||||||||
|---|---|---|---|---|---|---|---|---|---|---|---|
| Excreted | Composition1 | ||||||||||
|
Total (lbs/day) |
N (lbs/day) |
Total (lbs/day) |
N (lbs/day) |
CP (%) |
NDF (%) |
ADF (%) |
HEMI (%) |
CELL (%) |
Lignin (%) |
ADF-N (%) |
|
| Fresh frozen (FF) | 4.52 | 0.015 | 0.55 | 0.014 | 15.9 | 60.7 | 35.4 | 25.3 | 23.1 | 10.0 | 1.45 |
| Freeze dried (FD) | 3.6 | 0.022 | 0.52 | 0.012 | 15.0 | 62.7 | 35.9 | 26.8 | 24.0 | 9.6 | 1.25 |
| Ambient (AB) | 3.3 | 0.012 | 0.54 | 0.013 | 15.6 | 61.7 | 36.2 | 25.5 | 23.2 | 9.7 | 1.29 |
| 100°F (100F) | 3.0 | 0.012 | 0.58 | 0.013 | 13.7 | 63.8 | 37.7 | 26.1 | 24.1 | 10.4 | 1.18 |
| 145°F (145F) | 3.2 | 0.013 | 0.64 | 0.015 | 14.9 | 62.3 | 39.5 | 22.8 | 22.4 | 10.3 | 1.33 |
| 190°F (190F) | 2.7 | 0.013 | 0.58 | 0.013 | 14.4 | 63.8 | 38.3 | 25.6 | 23.5 | 11.3 | 1.17 |
| Significance (P): | |||||||||||
| Preservation method: | 0.33 | 0.45 | 0.10 | 0.07 | <0.01 | <0.01 | <0.01 | <0.01 | 0.01 | 0.08 | <0.01 |
| (FF+FD+AB)/3 vs. others | 0.09 | 0.26 | 0.01 | 0.29 | <0.01 | <0.01 | <0.01 | 0.01 | 0.60 | 0.01 | 0.24 |
| FF vs. (FD+AB)/2 | 0.16 | 0.59 | 0.63 | 0.23 | 0.07 | 0.03 | 0.30 | 0.08 | 0.27 | 0.43 | <0.01 |
| FD vs. AM | 0.72 | 0.10 | 0.57 | 0.07 | 0.17 | 0.23 | 0.67 | 0.03 | 0.14 | 0.89 | 0.46 |
| 100F vs. (145+190F)/2 | 0.97 | 0.89 | 0.40 | 0.07 | 0.01 | 0.30 | 0.06 | <0.01 | 0.01 | 0.42 | <0.01 |
| 145F vs. 190F | 0.55 | 0.91 | 0.18 | 0.06 | 0.19 | 0.06 | 0.08 | <0.01 | 0.03 | 0.12 | 0.51 |
1CP = crude protein; NDF = neutral detergent fiber; ADF = acid detergent fiber; HEMI = hemicellulose; CELL = cellulose; ADF-N = nitrogen concentration of the ADF fraction. ↲
2 Each value is the mean of six sheep. ↲
Results and Discussion
Dry matter intake by steers fed the four forced-air treatments was not altered by increasing temperature. The average intake was 2.23 pound per 100 pounds of body weight (Table 6.1). In that experiment, all steers were fed at similar rates above ad libitum and averaged 14.5% excess. In terms of nutritive value, crude protein concentrations were greater for the AB treatment than for the others; however, crude protein was generally in excess. The neutral detergent fiber was not altered by preservation treatment, but the acid detergent fiber and lignin were increased by supplemental heat (Table 6.1). When heat was added to the AB treatment, concentrations of acid detergent fiber and lignin increased from 27.8% and 3.2% to 30.2% and 4.1%, respectively. Of all fiber fractions that increased from the 145F treatment to the 190F treatment, lignin increased the most. The difference values (weighback concentration minus as-fed concentration) reveal that some selective consumption occurred, but the difference values within each variable were not altered by drying treatment.
Dry matter digestibility by sheep was altered by method of preservation or drying (Table 6.2). The preservation methods that did not use heat had greater dry matter digestion (68.4% vs. 60.7%) and acid detergent fiber digestion (50.5% vs. 45.7%) than those that used heat. The FF treatment resulted in the least dry matter digestion (65.9% vs. 69.7%) and the least digestible neutral detergent fiber (44.0% vs. 61.0%), acid detergent fiber (38.6% vs. 56.5%), hemicellulose (50.1% vs. 65.7%), and cellulose (53.8% vs. 66.5%). The quantity of diet on offer to the sheep during the trial was similar among the treatments, averaging 15.4% in excess (Table 6.2). This was similar to the 14.5% excess fed to steers (Table 6.1); however, the amount of excess fed was more variable than noted for the similar treatments fed to steers. The drying methods without added heat provided more crude protein and less neutral detergent fiber along with the constituent fiber fractions (Table 6.3). Among the non-heat preservation methods, the FF was greater in crude protein and less in neutral detergent fiber and all constituent fiber fractions, including nitrogen of the acid detergent fraction, compared with the FD and AB preservation methods. The reason for the reduced fiber concentrations in the FF treatment is not clear. Increasing the temperature above 100°F, in general, increased crude protein, neutral detergent fiber, hemicellulose, and cellulose concentrations.
As noted for steers, the difference value (weighback concentration minus as-fed concentration) indicates that selective consumption occurred, with difference values being positive for neutral detergent fiber and negative for crude protein (Table 6.2). The difference values for neutral detergent fiber were altered by preservation method and were mainly associated with the greater values for the FF treatment (22.9%).
Total urine excreted was not significantly altered by preservation method, although the lack of statistical significance may have been the result of variability in the observations. The FF treatment (4.5 pounds per day) was expected to be high because of its low dry matter concentration. The quantity of excreted urinary nitrogen was similar among treatments (Table 6.4). Total fecal excretion of dry matter was less for the treatments preserved without heat, but the difference was small, averaging 0.54 pounds per day compared with 0.60 for the heated treatments. The composition of the feces was altered by preservation method, with the biggest distinction between no-heat and heated preservation methods.
Summary and Conclusions
- Both steers and wethers consumed all the preserved forages well. The exception was the FF treatment, which was only fed to sheep; when thawed prior to feeding, the FF treatment was more variable as a feed because it could not be mixed as well as the dry feeds.
- Dry matter intake of steers was not altered by increasing drying temperature from ambient to 190°F.
- The application of heat reduced crude protein and increased acid detergent fiber and lignin for the as-fed hay.
- Dry matter digestion of forage estimated by sheep was reduced by heat treatment, with non-heat preservation producing the most digestible feed and heat preservation producing the least digestible feed.
- Of the treatments preserved without heat, the FD forage was greatest in dry matter digestion, at 70.7%, compared with FF and AB (mean = 67.3%).
- The digestibilities of dry matter and neutral detergent fiber, along with the constituent fiber fractions, were least for the FF; the other treatments were generally similar to each other. Digestibility of dry matter decreased from 62.7% to 59.3% as drying temperature increased from 145°F to 190°F.
IV. Evaluation of Diurnal Changes in the Nutritive Value of Cool-Season Forages
In the dark, plants translocate and respire soluble carbohydrates. This results in reduced concentrations of carbohydrate in the photosynthetic portions of the plants in the morning. With sunlight, plants begin to fix carbon more rapidly than they translocate and respire carbon, resulting in the accumulation of total nonstructural carbohydrates (TNC) during the day. Maximum concentrations occur in late afternoon. The extent to which TNC concentrations accumulate depends on environmental conditions such as cloud cover, moisture status of the soil, and daytime temperature, as well as specific plant physiological characteristics. In previous studies, the literature has shown that ruminants will preferentially select forage with greater TNC concentrations, resulting in greater energy intake per unit of dry matter consumed. One management strategy to take advantage of this process in an attempt to improve nutritive value and subsequent animal performance is to cut forage for hay in the late afternoon on a bright, clear day. Studies were conducted to assess the potential for increasing TNC concentrations at harvest, the stability of elevated TNC concentrations during storage, and the relationship of elevated TNC to forage quality and ruminant preference.
Experiment 7. Influence of Five Diurnal Cuts on the Nutritive Value and Quality of MaxQ Tall Fescue Hay
The objective of this experiment was to assess the change in forage TNC concentration during the day and determine the influence of changes in TNC on subsequent dry matter intake and whole-tract dry matter digestion.
Materials and Methods
A well-established stand of MaxQ tall fescue with 92% novel endophyte infection served as the source of the experimental hays. The field was flail harvested February 22 to remove all winter carryover growth and was topdressed March 3 with 70 pounds of nitrogen per acre. Just prior to cutting, the field was sectioned into five subplots, and each subplot was randomly assigned to one of five diurnal cutting times. On May 9, a bright, sunny day with low humidity, five cuts of MaxQ in the late-vegetative stage were made during the day, resulting in the following five treatments for evaluation:
- 7:00 a.m.
- 10:00 a.m.
- 1:00 p.m.
- 4:00 p.m.
- 7:00 p.m.
The forages were tedded several times after cutting to aid drying and were baled with a conventional square baler in the afternoon of the second day after cutting. The bales were transported and stored on wooden pallets in an experimental hay-storage barn at the NC State University Forage-Animal Metabolism Unit in Raleigh.
Two intake and digestion experiments were conducted the following fall and winter (Appendices GP-1, GP-2). One experiment (Experiment 7A) was conducted with sheep (initiated eight months after harvest), and the other experiment (Experiment 7B) was conducted with goats (initiated five months after harvest). Both experiments used the same hay source and employed a randomized complete block design with six animals (replicates) per treatment with blocking in the design by body weight. Thirty-two Katahdin wether lambs in the sheep experiment were standardized, and the thirty most uniform lambs (mean weight = 95 ± 11.8 pounds) were grouped by five and assigned at random within group to the five treatments (Experiment 7A). Likewise, in the goat experiment, 32 Boer-Spanish cross wethers were standardized, and the 30 goats with the most uniform weights (mean weight = 73 ± 13.1 pounds) were sorted by weight into groups (blocks) of five and assigned at random within group to the five treatments (Experiment 7B). Sheep were fed at 8.5% excess, and goats were fed at 9.3% excess.
All as-fed and weighback samples were analyzed for in vitro true dry matter disappearance, crude protein, neutral detergent fiber, acid detergent fiber, lignin, and TNC and its constituent starch, di- and polysaccharides, and monosaccharides (Appendix GP-7). All variables were analyzed statistically according to the experimental design (Appendix GP-8).
Results and Discussion
Experiment 7A.
Dry matter intake and whole-tract dry matter digestion, and consequently digestible dry matter intake by sheep, were not altered by delaying the time of cut (top half of Table 7.1). Although TNC concentrations increased linearly during the day, the change from 7:00 a.m. to 7:00 p.m. was relatively small (1.7 percentage units). This change was generally reflected in the increase in monosaccharides. The difference value (weighback concentration minus as-fed concentration) for in vitro true dry matter disappearance indicates that some selective consumption occurred but that it was not altered by time of cut.
| Time of Cut | Dry Matter | Carbohydrates | IVDMD | CP | NDF |
ADF (%) |
Lignin (%) |
||||||||
|---|---|---|---|---|---|---|---|---|---|---|---|---|---|---|---|
|
Intake (lbs/ 100 lbs) |
Dig (%) |
DI (lbs/100 lbs) |
TNC (%) |
Starch (%) |
Di/Poly (%) |
Mono (%) |
AF (%) |
DV3 (%) |
AF (%) |
DV (%) |
AF (%) |
DV (%) |
|||
|
Experiment 7A (sheep): |
|||||||||||||||
| 7:00 a.m. | 2.924 | 64.9 | 1.91 | 12.9 | 1.7 | 4.1 | 7.1 | 74.2 | -7.5 | 12.1 | 0.0 | 61.5 | 1.3 | 31.1 | 3.5 |
| 10:00 a.m. | 2.91 | 59.6 | 1.73 | 13.0 | 1.8 | 3.7 | 7.5 | 74.3 | -5.7 | 12.3 | -0.3 | 62.4 | 0.8 | 31.5 | 3.6 |
| 1:00 p.m. | 2.85 | 64.5 | 1.83 | 13.3 | 1.7 | 3.7 | 7.8 | 74.8 | -6.5 | 12.5 | 0.2 | 61.4 | 1.5 | 30.9 | 3.4 |
| 4:00 p.m. | 2.89 | 63.7 | 1.85 | 13.4 | 1.8 | 3.4 | 8.2 | 76.0 | -4.3 | 12.0 | 0.1 | 61.6 | 2.1 | 31.1 | 3.2 |
| 7:00 p.m. | 2.96 | 63.8 | 1.89 | 14.6 | 1.7 | 3.6 | 9.3 | 76.2 | -7.5 | 11.8 | -1.4 | 61.4 | 2.0 | 31.6 | 3.6 |
|
Significance (P): |
|||||||||||||||
| Time of cut: | 0.88 | 0.23 | 0.42 | <0.01 | 0.04 | 0.45 | <0.01 | 0.09 | 0.27 | 0.56 | 0.42 | 0.05 | 0.66 | 0.02 | <0.01 |
| Linear | 0.80 | 0.75 | 0.68 | <0.01 | 0.66 | 0.10 | <0.01 | 0.01 | 0.70 | 0.32 | 0.23 | 0.20 | 0.23 | 0.29 | 0.56 |
| Quadratic | 0.35 | 0.44 | 0.19 | 0.07 | 0.04 | 0.48 | 0.16 | 0.68 | 0.11 | 0.22 | 0.26 | 0.36 | 0.71 | 0.15 | 0.04 |
| Cubic | 0.81 | 0.10 | 0.24 | 0.27 | 0.13 | 0.99 | 0.31 | 0.47 | 0.45 | 0.81 | 0.29 | 0.07 | 0.39 | 0.01 | <0.01 |
| Lack of fit | 0.73 | 0.13 | 0.43 | 0.48 | 0.03 | 0.52 | 0.75 | 0.69 | 0.16 | 0.57 | 0.89 | 0.04 | 0.84 | 0.09 | 0.59 |
|
Experiment 7B (goats): |
|||||||||||||||
| 7:00 a.m. | 2.50 | 59.9 | 1.50 | 13.6 | 1.7 | 4.5 | 7.4 | 74.8 | -7.7 | 12.3 | 1.0 | 61.1 | 1.5 | 30.9 | 3.5 |
| 10:00 a.m. | 2.68 | 62.5 | 1.67 | 13.6 | 1.8 | 4.5 | 7.3 | 75.4 | -7.6 | 11.9 | 1.2 | 62.0 | 0.1 | 31.2 | 3.5 |
| 1:00 p.m. | 2.56 | 63.3 | 1.62 | 12.8 | 1.8 | 3.7 | 7.3 | 74.9 | -6.1 | 12.5 | 2.2 | 62.8 | -0.6 | 31.6 | 3.3 |
| 4:00 p.m. | 2.42 | 64.3 | 1.55 | 13.5 | 1.8 | 3.6 | 8.1 | 75.4 | -4.5 | 12.1 | 0.4 | 62.1 | 0.3 | 31.6 | 3.3 |
| 7:00 p.m. | 2.43 | 63.7 | 1.55 | 14.1 | 1.8 | 3.8 | 8.5 | 75.3 | -9.0 | 11.6 | 1.0 | 62.0 | 0.9 | 32.1 | 3.5 |
|
Significance (P): |
|||||||||||||||
| Time of cut: | 0.67 | 0.02 | 0.68 | 0.22 | 0.29 | 0.04 | <0.01 | 0.69 | 0.04 | 0.23 | 0.09 | 0.02 | <0.01 | <0.01 | 0.14 |
| Linear | 0.37 | <0.01 | 0.91 | 0.49 | 0.07 | 0.01 | <0.01 | 0.39 | 0.88 | 0.21 | 0.57 | 0.06 | 0.28 | <0.01 | 0.87 |
| Quadratic | 0.48 | 0.08 | 0.28 | 0.06 | 0.49 | 0.24 | 0.08 | 0.71 | 0.02 | 0.30 | 0.25 | 0.01 | <0.01 | 0.91 | 0.05 |
| Cubic | 0.33 | 0.93 | 0.32 | 0.58 | 0.96 | 0.18 | 0.54 | 0.71 | 0.02 | 0.20 | 0.26 | 0.46 | 0.36 | 0.48 | 0.08 |
| Lack of fit | 0.93 | 0.65 | 0.83 | 0.24 | 0.27 | 0.24 | 0.48 | 0.29 | 0.54 | 0.21 | 0.02 | 0.21 | 0.23 | 0.33 | 0.99 |
1 TNC = total nonstructural carbohydrates; Di/Poly = disaccharides and polysaccharides; Mono = monosaccharides. ↲
2 IVDMD = in vitro dry matter disappearance; CP = crude protein; NDF = neutral detergent fiber; ADF = acid detergent fiber. ↲
3 DV = difference value (weighback concentration minus AF concentration). ↲
4 Each value is the mean of six animals or six samples (as appropriate). ↲
Experiment 7B.
Goats generally responded similarly to sheep, with no differences among treatments in either dry matter intake or digestible dry matter intake (bottom half of Table 7.1). However, dry matter digestion increased linearly with cutting delay during the day, although changes were generally small. Also, some selective consumption was evident as indicated by the difference value for in vitro true dry matter disappearance. The response to diurnal cuts appeared to decrease during the day but increased at the 7:00 p.m. cut. These results were unexpected based on previous findings of increases in both dry matter intake and dry matter digestion in evening-cut hays, raising the question of TNC stability during storage.
Summary and Conclusions
- At the time of feeding the conserved forage, TNC concentrations differed little between the 7:00 a.m. and 7:00 p.m. cuttings. Consequently neither dry matter intake nor dry matter digestion were altered much for either sheep or goats.
Experiment 8. Influence of Six Diurnal Cuts on the Nutritive Value, Preference, and Quality of MaxQ Tall Fescue Hay
Experiment 7 was repeated with some modifications to further examine the influence of diurnal changes in the total nonstructural carbohydrate (TNC) concentration of tall fescue hay. In addition to the objective of assessing the influences of delayed cutting during the day on changes in TNC, attention was devoted to determine potential changes in TNC concentration following harvest with delayed utilization.
Materials and Methods
The same well-established stand of MaxQ tall fescue (92% novel endophyte infection) used in Experiment 7 was the source of the experimental hays. The field was flail chopped to a 3-inch stubble in late February to remove late fall and winter growth and was topdressed with 70 pounds of nitrogen per acre. Prior to harvest, the field was subdivided into six blocks, with time of cut during the day randomly assigned to each block. The hays were cut April 28 following the passage of a front that resulted in a bright, cloudless day. Morning temperatures were in the upper 30s, and the high for the day reached 65°F. The cuts (treatment) were made using a mower conditioner set to leave a 3- to 4-inch stubble. The first cut occurred at 6:55 a.m. and was completed by 7:30 a.m. Each harvest took a similar amount of time to cut, and the treatments are designated as: 7:00 a.m., 11:30 a.m., 1:30 p.m., 3:30 p.m., 5:30 p.m., and 7:30 p.m.
At harvest the forage was in the late-boot stage (30%) with heads emerging (50%), and growth was somewhat variable due to water stress (about 5 inches below normal). The following day began with a temperature in the upper 40s and an afternoon high of 78°F. The second day after cutting, the hays were tedded about 11:30 a.m. and baling was initiated at about 2:30 p.m. (daytime high of 80°F), with the last treatment (7:30 cut) completed by 6:00 p.m. All treatments had some moist tissue present at baling, which could be the source of some mold. The hays were transported and stored on wooden pallets at the NC State University Forage-Animal Metabolism Unit in Raleigh (Appendix GP-1).
Two experiments, one examining preference (Experiment 8A) and the other examining intake and digestion (Experiment 8B), were conducted using Boer- Spanish crossbred goats. The preference experiment was conducted first and was initiated the following winter (283 d after cutting). Hay for the intake and digestion experiments was held over and the experiment conducted the next winter (initiated 855 d after cutting). The data from both experiments were analyzed statistically according to the experimental design (GP-8).
Experiment 8A. Preference Evaluation
Eight Boer-Spanish doe goat crosses were standardized, and the six most uniform goats (mean weight = 78.7 pounds) were selected and used in a preference evaluation that could be analyzed using the statistical methodology of multiple dimensional scaling (Appendix GP-6). The goats were offered two hays at a time in a random sequence, and the intake of each hay was recorded at the end of 30 minutes (Appendix GP-4). This permitted the calculation of an intake rate (g/min) and an estimate of relative preference. If they ate equal quantities of each hay, then they had no relative preference, and this was expressed numerically as 0. If they only ate one of the pair of hays, then their relative preference was very strong, and it was expressed numerically as 1.
Samples of the as-fed and weighback forages were obtained and analyzed for in vitro true dry matter disappearance and nutritive value, including TNC and its constituent fractions of starch, di- and polysaccharides, and monosaccharides (Appendix GP-7).
| Time of Cut |
DMI (g/min) |
Carbohydrates | IVTD | CP | NDF |
ADF (%) |
Lignin (%) |
||||||
|---|---|---|---|---|---|---|---|---|---|---|---|---|---|
|
TNC (%) |
Starch (%) |
Di/Poly (%) |
Mono (%) |
AF (%) |
DV3 (%) |
AF (%) |
DV (%) |
AF (%) |
DV (%) |
||||
| 7:00 a.m. | 1.204 | 7.6 | 1.7 | 0.6 | 5.3 | 74.8 | -0.1 | 14.3 | -0.1 | 66.6 | 0.1 | 33.3 | 3.4 |
| 11:30 a.m. | 2.45 | 10.5 | 1.6 | 0.8 | 8.1 | 75.5 | -0.5 | 14.5 | -0.2 | 62.9 | 0.6 | 31.5 | 3.1 |
| 1:30 p.m. | 3.12 | 10.7 | 1.7 | 0.5 | 8.5 | 75.4 | -0.0 | 14.8 | -0.1 | 62.9 | 0.6 | 31.5 | 3.1 |
| 3:30 p.m. | 3.57 | 11.0 | 1.7 | 0.4 | 8.9 | 75.6 | 0.6 | 15.2 | 0.0 | 62.2 | 0.5 | 31.2 | 3.0 |
| 5:30 p.m. | 1.33 | 9.1 | 1.6 | 0.8 | 6.7 | 75.0 | 0.4 | 13.3 | -0.1 | 64.9 | 0.5 | 32.9 | 3.2 |
| 7:30 p.m. | 3.81 | 10.0 | 1.6 | 0.7 | 7.7 | 77.0 | -0.7 | 14.5 | -0.6 | 63.5 | 0.9 | 31.8 | 3.0 |
|
Significance (P): |
|||||||||||||
| Time of cut: | <0.01 | <0.01 | 0.01 | <0.01 | <0.01 | 0.01 | 0.62 | <0.01 | 0.31 | <0.01 | 0.59 | <0.01 | <0.01 |
| Linear | <0.01 | <0.01 | 0.78 | 0.56 | <0.01 | 0.01 | 0.93 | 0.33 | 0.28 | <0.01 | 0.12 | <0.01 | <0.01 |
| Quadratic | 0.08 | <0.01 | 0.06 | 0.03 | <0.01 | 0.24 | 0.46 | <0.01 | 0.20 | <0.01 | 0.97 | <0.01 | <0.01 |
| Cubic | 0.01 | <0.01 | 0.69 | 0.09 | <0.01 | 0.02 | 0.10 | 0.03 | 0.08 | <0.01 | 0.31 | <0.01 | 0.01 |
| Quartic | <0.01 | <0.01 | <0.01 | <0.01 | <0.01 | 0.16 | 0.97 | <0.01 | 0.88 | <0.01 | 0.74 | <0.01 | 0.01 |
| Pentic | 0.01 | <0.01 | 0.69 | 0.15 | <0.01 | 0.27 | 0.82 | <0.01 | 0.82 | <0.01 | 0.96 | <0.01 | 0.10 |
| MSD5 | 0.87 | 0.5 | 0.1 | 0.2 | 0.5 | 1.2 | 2.6 | 0.4 | 0.8 | 0.6 | 1.3 | 0.4 | 0.1 |
1 TNC = total nonstructural carbohydrates; Mono = monosaccharides; Di/Poly = disaccharides and polysaccharides. ↲
2 IVTD = in vitro true matter disappearance; CP = crude protein; NDF = neutral detergent fiber; ADF = acid detergent fiber. ↲
3 DV = difference value (weighback concentration minus AF concentration). ↲
4 Each value is the mean of five goats or five samples (as appropriate). ↲
5 MSD = minimum significant difference from the Waller-Duncan k-ratio (k = 100) t test; can be used to compare any two treatments. ↲
Experiment 8B. Intake and Digestibility Evaluation
Seven Boer-Spanish wether goats were standardized, and the six most uniform (mean weight = 81 pounds) were used in a 6 × 6 Latin square design. Intake and digestibility estimates were obtained (Appendix GP-2), and animals were fed at an average of 9.1% excess for the experiment. All as-fed and weighback samples were analyzed as noted above for Experiment 8A (Appendix GP-7).
| Time of Cut | Dry Matter |
TNC (%) |
IVTD | CP | NDF |
ADF (%) |
Lignin (%) |
|||||
|---|---|---|---|---|---|---|---|---|---|---|---|---|
|
Intake (lbs/100 lbs4) |
Dig (%) |
DI (lbs/100 lbs4) |
AF (%) |
DV3 (%) |
AF (%) |
DV (%) |
AF (%) |
DV (%) |
||||
| 7:00 a.m. | 2.095 | 61.0 | 1.27 | 7.4 | 76.2 | -2.7 | 13.5 | 0.3 | 68.3 | -0.4 | 33.2 | 3.7 |
| 11:30 a.m. | 2.29 | 64.7 | 1.48 | 7.6 | 76.3 | -2.1 | 12.7 | 0.9 | 68.6 | -1.1 | 33.5 | 3.7 |
| 1:30 p.m. | 2.29 | 63.1 | 1.44 | 8.0 | 75.3 | -1.0 | 14.4 | 0.8 | 66.5 | -1.5 | 32.4 | 3.9 |
| 3:30 p.m. | 2.23 | 64.6 | 1.44 | 7.6 | 74.9 | -1.9 | 14.0 | 0.8 | 67.7 | -2.6 | 33.1 | 3.9 |
| 5:30 p.m. | 2.23 | 64.6 | 1.44 | 7.4 | 75.3 | -1.5 | 14.1 | -0.2 | 67.8 | -2.1 | 33.1 | 4.0 |
| 7:30 p.m. | 2.00 | 63.2 | 1.27 | 8.1 | 76.7 | -2.5 | 13.1 | 0.6 | 67.0 | -0.8 | 33.3 | 3.7 |
|
Significance (P): |
||||||||||||
| Time of cut: | 0.19 | 0.08 | 0.04 | 0.96 | 0.11 | 0.68 | 0.19 | 0.26 | 0.45 | 0.27 | 0.41 | 0.02 |
| Linear | 0.65 | 0.06 | 0.75 | 0.64 | 0.77 | 0.63 | 0.67 | 0.75 | 0.26 | 0.25 | 0.94 | 0.04 |
| Quadratic | 0.01 | 0.04 | <0.01 | 0.96 | 0.05 | 0.19 | 0.36 | 0.27 | 0.87 | 0.11 | 0.39 | 0.09 |
| Cubic | 0.74 | 0.93 | 0.83 | 0.58 | 0.03 | 0.71 | 0.04 | 0.13 | 0.99 | 0.14 | 0.44 | 0.01 |
| Quartic | 0.55 | 0.15 | 0.25 | 0.54 | 0.72 | 0.89 | 0.30 | 0.15 | 0.13 | 0.81 | 0.18 | 0.95 |
| Pentic | 0.68 | 0.36 | 0.90 | 0.91 | 0.92 | 0.35 | 0.25 | 0.31 | 0.32 | 0.56 | 0.17 | 0.50 |
| MSD6 | 0.3 | 3.3 | 0.2 | 3.4 | 1.8 | 3.4 | 1.9 | 1.4 | 3.3 | 2.8 | 1.4 | 0.3 |
1 TNC = total nonstructural carbohydrates; Mono = monosaccharides; Di/Poly = disaccharides and polysaccharides. ↲
2 IVTD = in vitro true dry matter disappearance; CP = crude protein; NDF = neutral detergent fiber; ADF = acid detergent fiber. ↲
3 DV = difference value (weighback concentration minus AF concentration). ↲
4 Body weight basis. ↲
5 Each value is the mean of five goats or five samples (as appropriate). ↲
6 MSD = minimum significant difference from the Waller-Duncan k-ratio (k = 100) t test; can be used to compare any two treatments. ↲
Results and Discussion
The focus of this study was on increasing the TNC in the forage at harvest to improve the nutritive value, and hence the quality, of the resulting hays. The concentration of TNC on the day of harvest (day 0, Figure 8.1) reveals an increase in TNC from 14.3% at 7:00 a.m. to 17.6% by 7:30 p.m. At baling (day 2, Figure 8.1) declines in TNC are evident, although the relative rank still occurred with 3:30 p.m. to 7:30 p.m. greatest and 7:00 a.m. least, averaging 14.6% for the day. By the time the preference trial was conducted, 281 days after cutting, further reductions in TNC are noted, but the relative rank of p.m. greatest and a.m. least is still evident (Figure 8.1). Finally, by the start of Experiment B, 855 days after cutting, TNC concentrations had decreased to an average of 7.8%. At completion of Experiment 8B, some 142 days after initiation, little change was evident, as the TNC mean was 7.4%.
Experiment 8A.
Preference conducted on day 283 indicated increasing dry matter intake rate through the 3:30 treatment, a large decline for the 5:30 treatment, and recovery with the greatest intake rate occurring for the 7:30 p.m. treatment (Table 8.1). These shifts, based on short-term preference, resulted in significant polynomial trends and clearly reflect the TNC concentrations. However, the least dry matter intake was noted for the 5:30 p.m. treatment. This is difficult to explain but is consistent with the observed reduction in TNC, with the monosaccharides contributing most to the decline. The results of the multidimensional scaling indicate that the animals were basing their selection on two criteria (Figure 8.2). *Note. The x axis is the primary factor for selection and is associated with digestibility and carbohydrate concentration. The y axis is the secondary factor and may have been associated with a post-harvest effect. The most influential dimension (x axis) was, as might be expected, associated with carbohydrate. The less influential dimension (y axis) may have been associated with some post-harvest effect that altered preference among the treatments. We may not have measured any component associated with that type of effect. The nutritive value variables at the 5:30 p.m. treatment generally resemble those of the 7:00 a.m. treatment. It is speculated that sufficient moisture at baling may have favored excessive heating and perhaps made the hay less palatable to the animals. In vitro true dry matter disappearance and crude protein generally increased, and neutral detergent fiber, acid detergent fiber, and lignin generally decreased, from the 7:30 a.m. harvest through the 1:30 p.m. harvest. Some selective consumption occurred, as noted by the difference value, but this variable was not affected by time of cut (Table 8.1).
In general, dry matter intake rate was positively correlated with in vitro true dry matter disappearance (r = 0.80; P = 0.06) and crude protein (r = 0.76; P = 0.08) concentrations and was negatively associated with neutral detergent fiber concentrations (r = 0.83; P = 0.04). Further, dry matter intake rate was positively correlated with TNC concentrations (r = 0.82; P = 0.05) and with monosaccharides (r = 0.83; P = 0.04) within the TNC fraction. These latter relationships reflect dry matter intake rate with delay of harvest during the day.
Experiment 8B.
The intake and digestion experiment, in which goats were not offered a choice, indicates an increase in dry matter intake rate from 7:30 to 11:30 a.m., a leveling off from 11:30 a.m. through 5:30 p.m., and a decline for the 7:30 p.m. hay, giving a quadratic trend (Table 8.2). This pattern was also evident for dry matter digestibility and digestible dry matter intake. However, by the time this experiment was conducted (> 2 years after harvest), the TNC concentrations had decreased appreciably in all hays, resulting in no observable change related to time of cutting during the day. The reduction in TNC concentrations indicates either a loss or conversion to other constituents. The latter hypothesis is supported by the greater dry matter intake and dry matter digestibility for hays cut between 11:30 a.m. and 5:30 p.m.
Summary and Conclusions
- Delaying the cutting of tall fescue during the day increased total nonstructural carbohydrates from 14.3% at 7:00 a.m. to 17.6% by 7:30 p.m.
- During storage, TNC concentrations declined from a mean of about 16.0% at cutting to 14.6% at baling, to 9.8% after 281 days of storage, and to 7.8% after 855 days of storage, with differences in diurnal cuts essentially lost.
- No preference among diurnal cuts was noted when hay was fed to goats. This is attributed to TNC losses during storage and prior to feeding.
- The nutritive value and quality of tall fescue hay can be improved by delaying cutting until late afternoon, but advantageous use of that management strategy requires that hays not be stored for prolonged periods prior to feeding (preferably less than a year).
- In the intake and digestion experiments, in which goats were not offered a choice, both dry matter intake and dry matter digestion were increased for hays cut between 11:30 a.m. and 5:30 p.m.
Experiment 9. The Influence of Five Diurnal Cuts of Alfalfa on Nutritive Value and Preference by Sheep and Goats
Legumes generally supply greater concentrations of crude protein than needed for animal responses associated with the digestibility and dry matter intake of the forage. Increasing the total nonstructural carbohydrate (TNC) concentrations of the forage should improve nitrogen utilization and ruminant performance. The objective of this experiment was to determine the diurnal increase in TNC in alfalfa and test for an influence of the nutritive value of the forage on preference as expressed by sheep and goats.
Materials and Methods
A well-established stand of alfalfa served as the source of the experimental hays. On a clear, bright day the third-regrowth alfalfa in the early-bud stage was cut with a mower conditioner at five times during the day, resulting in the following five diurnal treatments for evaluation: 7:00 a.m., 10:00 a.m., 1:00 p.m., 4:00 p.m., and 7:00 p.m.
The hays were field cured, square baled, and transported to the NC State University Forage-Animal Metabolism Unit in Raleigh and stored on wooden pallets in an experimental hay-storage barn until fed. At feeding the hays were processed (Appendix GP-1).
Two preference experiments were conducted, one with sheep (Experiment 9A; Appendix GP-4) and one with goats (Experiment 9B; Appendix GP-4). Both experiments were conducted as randomized complete block designs with six animals (replicates) per treatment. In Experiment 9A, six Katahdin ewes (mean weight = 108 pounds) were used, and in Experiment 9B six Boer- Spanish cross wether goats (mean weight = 68 pounds) were used. Animals were offered two hays at a time in a random sequence, and the intake of each hay was recorded at the end of 30 minutes. This permitted the calculation of an intake rate (g/min) as well as an indication of relative preference using multidimensional scaling (Appendix GP-6). If equal quantities were consumed, there was no relative preference, and this was expressed numerically as 0. If they only consumed one of the two forages, then relative preference was very high, and this was expressed numerically as 1.
Normal procedures were used to analyze as-fed and weighback samples from both experiments for in vitro true dry matter disappearance, crude protein, neutral detergent fiber, acid detergent fiber, lignin, TNC, starch, di- and polysaccharides, and monosaccharides (Appendix GP-7). The data were analyzed statistically using both multiple dimensional scaling (Appendix GP-6) and the appropriate analysis of variance for a randomized complete block design (Appendix GP-8). The minimum significant difference was included for specific comparisons.
Results and Discussion
Experiment 9A.
The dry matter intake rate in the preference trial with sheep increased linearly as time of cutting was delayed until later in the day. However, dry matter intake rate declined by 7:00 p.m., resulting in an overall significant cubic response (top half of Table 9.1). The TNC concentration and its constituent starch and monosaccharide concentrations increased linearly during the day. The in vitro true dry matter disappearance of the as-fed hays increased linearly, and neutral detergent fiber and its constituent acid detergent fiber and lignin concentrations decreased (either linearly or quadratically) during the day, which was attributed to the changes in TNC.
Results expressed by the two primary selection criteria show that the relatively more influential first criterion (x axis) was associated with carbohydrate concentration, and the second criterion was associated with digestibility, explaining the relative preference for the 4 p.m. sample over the 7 p.m. sample (top half of Figure 9.1) *Note. The x axis is the primary factor for selection and is associated with carbohydrate concentration. The y axis is the secondary factor and may have been associated with digestibility.
The dry matter intake rate was positively correlated with TNC (r = 0.93; P = 0.02) and its constituent monosaccharide (r = 0.93; P = 0.02). Some selective consumption was evident during the experiment, with difference values being positive for neutral detergent fiber and negative for in vitro true dry matter disappearance and crude protein. As time of cut was delayed during the cut and then decreased, resulting in a quadratic trend (top half of Table 9.1). Intake rate, however, was not correlated with any difference value (data not shown).
| Time of Cut |
DMI (g/min) |
Carbohydrates | IVTD | CP | NDF |
ADF (%) |
Lignin (%) |
||||||
|---|---|---|---|---|---|---|---|---|---|---|---|---|---|
|
TNC (%) |
Starch (%) |
Di/Poly (%) |
Mono (%) |
AF (%) |
DV3 (%) |
AF (%) |
DV (%) |
AF (%) |
DV (%) |
||||
|
Experiment 9A (sheep): |
|||||||||||||
| 7:00 a.m. | 3.24 | 8.7 | 1.9 | 5.0 | 1.8 | 73.2 | -1.9 | 18.3 | -1.7 | 44.5 | 3.2 | 33.6 | 7.0 |
| 10:00 a.m. | 3.7 | 8.8 | 1.9 | 5.1 | 1.8 | 75.7 | -5.4 | 19.4 | -3.4 | 42.4 | 6.7 | 31.9 | 6.6 |
| 1:00 p.m. | 5.3 | 9.5 | 2.2 | 5.4 | 1.9 | 75.4 | -5.9 | 19.2 | -3.8 | 40.8 | 8.8 | 30.8 | 6.4 |
| 4:00 p.m. | 6.6 | 9.6 | 2.2 | 5.3 | 2.1 | 75.9 | -4.8 | 19.2 | -3.1 | 41.5 | 6.4 | 31.6 | 6.6 |
| 7:00 p.m. | 5.5 | 9.7 | 2.4 | 5.2 | 2.1 | 75.7 | -4.5 | 19.4 | -2.7 | 41.5 | 5.6 | 31.3 | 6.5 |
|
Significance (P): |
|||||||||||||
| Time of cut: | <0.01 | 0.02 | 0.01 | 0.18 | <0.01 | 0.04 | 0.16 | 0.19 | 0.23 | 0.01 | 0.13 | 0.03 | 0.03 |
| Linear | <0.01 | <0.01 | <0.01 | 0.08 | <0.01 | 0.02 | 0.22 | 0.09 | 0.47 | <0.01 | 0.31 | 0.01 | 0.01 |
| Quadratic | 0.07 | 0.47 | 0.94 | 0.13 | 0.89 | 0.07 | 0.04 | 0.25 | 0.04 | 0.02 | 0.02 | 0.04 | 0.07 |
| Cubic | 0.04 | 0.44 | 0.69 | 0.77 | 0.05 | 0.30 | 0.31 | 0.19 | 0.46 | 0.52 | 0.53 | 0.37 | 0.33 |
| LOF | 0.93 | 0.31 | 0.11 | 0.34 | 0.63 | 0.41 | 0.95 | 0.63 | 0.79 | 0.41 | 0.45 | 0.39 | 0.44 |
| MSD5 | 1.4 | 0.9 | 0.3 | 0.5 | 0.2 | 2.1 | 4.2 | 1.3 | 2.4 | 2.1 | 4.9 | 1.9 | 0.4 |
|
Experiment 9B (goat): |
|||||||||||||
| 7:00 a.m. | 3.1 | 8.7 | 2.1 | 4.8 | 1.8 | 75.2 | -5.4 | 19.4 | -3.6 | 43.1 | 6.4 | 33.5 | 6.5 |
| 10:00 a.m. | 2.3 | 8.8 | 2.1 | 5.0 | 1.7 | 75.2 | -4.6 | 19.5 | -3.5 | 42.4 | 6.5 | 31.6 | 6.6 |
| 1:00 p.m. | 4.6 | 9.4 | 2.2 | 5.4 | 1.8 | 75.7 | -6.7 | 19.1 | -4.3 | 40.9 | 9.1 | 30.8 | 6.4 |
| 4:00 p.m. | 6.3 | 10.4 | 2.6 | 5.7 | 2.1 | 76.7 | -9.5 | 19.8 | -5.9 | 40.6 | 12.8 | 30.2 | 6.3 |
| 7:00 p.m. | 5.8 | 9.9 | 2.5 | 5.3 | 2.1 | 76.7 | -8.5 | 20.1 | -5.3 | 39.8 | 11.0 | 30.3 | 6.3 |
|
Significance (P): |
|||||||||||||
| Time of cut: | <0.01 | <0.01 | <0.01 | <0.01 | <0.01 | 0.20 | <0.01 | 0.34 | 0.01 | 0.05 | <0.01 | 0.41 | 0.53 |
| Linear | <0.01 | <0.01 | <0.01 | <0.01 | <0.01 | 0.03 | <0.01 | 0.15 | <0.01 | <0.01 | <0.01 | 0.07 | 0.11 |
| Quadratic | 0.96 | 0.25 | 0.54 | <0.01 | 0.35 | 0.74 | 0.93 | 0.24 | 0.82 | 0.72 | 0.54 | 0.95 | 0.99 |
| Cubic | <0.01 | 0.01 | 0.03 | 0.01 | 0.02 | 0.45 | 0.01 | 0.83 | 0.05 | 0.91 | 0.03 | 0.46 | 0.50 |
| LOF | 0.33 | 0.34 | 0.20 | 0.98 | 0.12 | 0.77 | 0.73 | 0.32 | 0.53 | 0.61 | 0.59 | 0.89 | 0.86 |
| MSD5 | 0.8 | 0.6 | 0.3 | 0.3 | 0.1 | 2.2 | 2.3 | 1.4 | 1.4 | 2.7 | 3.3 | 2.6 | 0.7 |
1 TNC = total nonstructural carbohydrates; Mono = monosaccharide; Di/Poly = disaccharides and polysaccharides. ↲
2 IVTD = in vitro true dry matter disappearance; CP = crude protein; NDF = neutral detergent fiber; ADF = acid detergent fiber. ↲
3 DV = difference value (weighback concentration minus AF concentration). ↲
4 Each value is the mean of five goats or five samples (as appropriate). ↲
5 MSD = minimum significant difference from the Waller-Duncan k-ratio (k = 100) t test; can be used to compare any two treatments. ↲
Experiment 9B.
Dry matter intake rate, as preferenced by goats, gave similar responses to those noted for sheep in Experiment 9A, increasing up until the 4:00 p.m. cut and then declining, resulting in an overall significant cubic trend (bottom half of Table 9.1). As with the sheep experiment, results expressed by the two primary selection criteria show that the relatively more influential first criterion (x axis) was associated with carbohydrate concentration, and the second criterion was associated with digestibility, explaining the relative preference for the 4:00 p.m. sample over the 7:00 p.m. sample (bottom half of Figure 9.1)* Note. The x axis is the primary factor for selection and is associated with carbohydrate concentration. The y axis is the secondary factor and may have been associated with digestibility. The 10:00 a.m. preference was low, and this was reflected by its position on the first axis. This may simply be measurement error in either preference or nutritive value. The observations of nutritive value showed little variation between the 7:00 a.m. and 10:00 a.m. hays, and the response in relative preference could be associated with a variable we did not measure. Concentrations of TNC and its constituent fractions generally showed similar trends with delayed cutting during the day. In vitro true dry matter disappearance increased linearly and neutral detergent fiber decreased linearly as time of cut was delayed, consistent with the preference demonstrated by goats. Again, these shifts are consistent with changes in TNC concentrations.
Dry matter intake rate by goats was positively correlated with TNC (r = 0.96; P = 0.01) and with its constituent starch (r = 0.94; P = 0.02), di- and polysaccharides (r = 0.85; P = 0.07), and monosaccharides (r = 0.93; P = 0.02) concentrations. Examination of difference values indicates that some selective consumption occurred, and this generally increased with hays cut later in the day (bottom half of Table 9.1). In this experiment, dry matter intake rate was negatively correlated with difference values of both in vitro true dry matter disappearance (r = -0.99; P < 0.01) and crude protein (r = -0.97; P = 0.01), which was attributed to greater time devoted to selective consumption.
Summary and Conclusions
- Both sheep and goats demonstrated increasing preference for alfalfa hay cut later in the day.
- Animals demonstrated the least preference for hay cut at 7:00 a.m.
- In both sheep and goat experiments, dry matter intake rate was highly correlated with TNC concentrations.
- The nutritive value of and preference for alfalfa was increased when hay was cut later in the day but before 7:00 p.m.
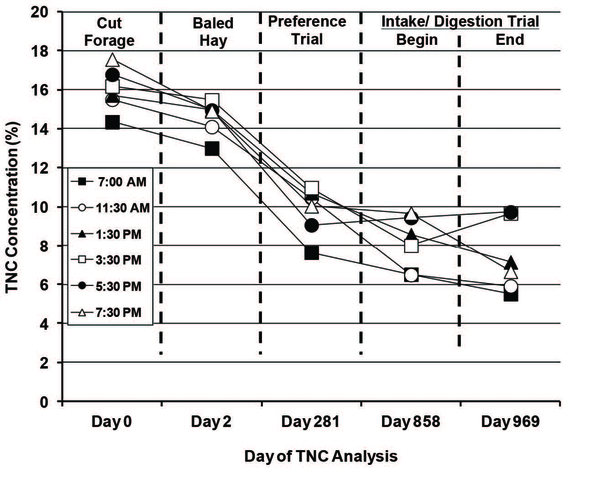
Figure 8.1. Diurnal (7:00 a.m. to 7:30 p.m.) changes in total nonstructural carbohydrate (TNC) concentrations of tall fescue at cutting, when baled, and when fed in Experiment 8A for preference, and fed in Experiment 8B for intake and digestion (dry matter basis).
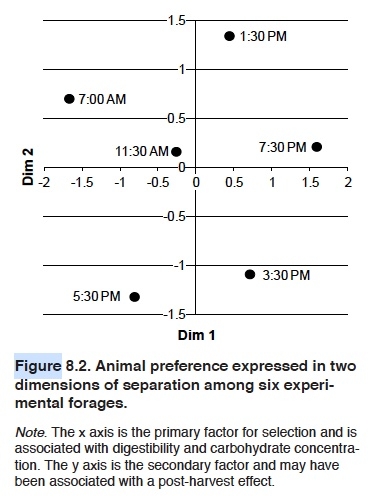
Figure 8.2. Animal preference expressed in two dimensions of separation among six experimental forages.
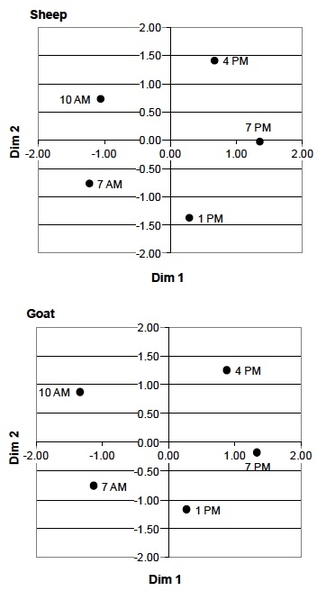
Figure 9.1. Animal preference expressed in two dimensions of separation among the five experimental forages.
V. Evaluation of an Improved Cool-Season Grass for the Mid-Atlantic Region
Experiment 10. Intake and Digestibility of Palaton Reed Canarygrass Hay
Reed canarygrass (Phalaris arundinacea L.), a perennial cool-season grass, has not been grown to any extent in the mid-Atlantic region of the United States. It has shown potential when grown in the upper Midwest, but the presence of alkaloids as antiquality factors limited animal performance and the utility of the grass in grazing systems. An improved selection without this antiquality factor was released in 1985 as Palaton reed canarygrass, warranting evaluation in the mid-Atlantic region. The objective of this study was to determine the dry matter intake and digestibility of the improved Palaton cultivar when harvested at several maturities and when produced under early- and late-summer temperatures of the South.
Materials and Methods
A well-established stand of Palaton reed canarygrass was the source of the experimental hays. The experimental hays were cut during a two-year period. Each year initial growth was cut by early May to remove residue from the previous year. The field was topdressed with 80 pounds of nitrogen per acre prior to each regrowth. The following experimental hays were evaluated:
- Palaton reed canarygrass second regrowth (RG), cut August 21 (year 1) in the vegetative (V) stage and ranging from 16 to 20 inches in height (2RGV).
- Palaton reed canarygrass first regrowth, cut July 8 (year 2) in the early-boot (B: <10% heads showing) stage and ranging from 25 to 27 inches in height (1RGB).
- Palaton reed canarygrass second regrowth, cut August 20 (year 2) in the early-boot (<10 % heads showing) stage and ranging from 25 to 28 inches in height (2RGB).
All forages were flail chopped to leave a 4- to 5-inch stubble and blown into a self-unloading wagon. The forage was transported to a bulk drying barn at the NC State University Forage-Animal Metabolism Unit in Raleigh and dried overnight at 165°F. After drying the forage was baled directly from the drier with a conventional square baler and stored on wooden pallets by treatment in an experimental hay-storage barn until fed (Appendix GP-1).
Two experiments were conducted. The first experiment (Experiment 10A) evaluated intake and digestion, and the second experiment (Experiment 10B) evaluated the characteristics of the masticated forage. In Experiment 10A, three steers (mean weight = 556 ± 57.8 pounds) were used in a 3 × 3 Latin square design. Steers were fed at 12.6% excess according to normal procedures (Appendix GP-2). Fecal samples collected during the digestion phase were also sieved for particle size determination (Appendix GP-5).
Experiment 10B used six mature esophageally fistulated steers. The masticate experiment was conducted as a 3 × 3 Latin square design with two squares. The six steers were grouped by weight into two groups of three steers each and assigned at random within group to one of the three treatment series in square I and square II (Appendix GP-3, GP-4).
All as-fed, weighback, and masticate samples were analyzed for in vitro true dry matter disappearance, crude protein, neutral detergent fiber, acid detergent fiber, hemicellulose, cellulose, and lignin (Appendix GP-7). The data from both experiments were analyzed statistically according to the experimental design (Appendix GP-8).
Results and Discussion
Experiment 10A.
No significant difference in intake among the hays was detected (Table 10.1). Dry matter digestibility was greatest for the vegetative hay compared with both hays in the early boot. The 1RGB was less digestible than the 2RGB. The former was produced under more favorable growing conditions, while the latter was produced during hotter temperatures and some water stress. This same relationship was noted for the digestibility of neutral detergent fiber, whereas the two early-boot regrowth hays were similar for acid detergent fiber, hemicellulose, and cellulose. No differences were noted among hays for digestible intake of any of the variables measured (Table 10.1).
The in vitro true dry matter disappearance of the as-fed hay reflected the whole-tract dry matter digestibility being greatest for 2RGV hay and least for the 1RGB hay. This was also reflected in crude protein and neutral detergent fiber concentration. The concentrations of crude protein were adequate for all hays to support desirable steer performance. Selective consumption, as noted by difference values, was minimal and did not vary among the experimental hays (Table 10.2).
| Maturity2 | Year |
DMI (lbs/ 100 lbs4) |
Apparent Digestibilities3 | Digestible Intakes | ||||||||
|---|---|---|---|---|---|---|---|---|---|---|---|---|
| DM (%) | NDF (%) | ADF (%) | HEMI (%) | CELL (%) |
DM (lbs/100 lbs4) |
NDF (lbs/100 lbs4) |
ADF (lbs/100 lbs4) |
HEMI (lbs/100 lbs4) |
CELL (lbs/100 lbs4) |
|||
| Vegetative (2RGV) | 1 | 2.29a | 64.0a | 66.2a | 63.7a | 68.9a | 70.7a | 1.47a | 0.99a | 0.49a | 0.50a | 0.43a |
| Early boot (1RGB) | 2 | 2.13a | 56.6b | 56.1b | 54.1b | 58.4b | 60.5b | 1.20a | 0.79a | 0.39a | 0.40a | 0.34a |
| Early boot (2RGB) | 2 | 1.92a | 58.7c | 58.5c | 56.9b | 60.5b | 64.2b | 1.13a | 0.74a | 0.39a | 0.35a | 0.36a |
|
Significance (P): |
||||||||||||
| Maturity | 0.74 | <0.01 | <0.01 | 0.01 | 0.01 | 0.01 | 0.51 | 0.50 | 0.64 | 0.34 | 0.60 | |
| MSD5 | 1.3 | 1.7 | 1.0 | 3.7 | 3.7 | 3.8 | 0.84 | 0.58 | 0.32 | 0.26 | 0.25 | |
1 All values are the mean of three steers. ↲
2 2RGV = second regrowth vegetative stage; 1RGB = first regrowth early-boot stage; 2RGB = second regrowth early-boot stage. ↲
3 NDF = neutral detergent fiber; ADF = acid detergent fiber; HEMI = hemicellulose; CELL = cellulose. ↲
4 Body weight basis. ↲
5 MSD = minimum significant difference from the Waller-Duncan k-ratio (k = 100) t test; can be used to compare any two treatments. Treatments with different superscripts are different. ↲
| Maturity3 | Year | IVDMD | CP | NDF | Fiber Fractions | ||||||
|---|---|---|---|---|---|---|---|---|---|---|---|
|
AF (%) |
DV4 (%) |
AF (%) |
DV (%) |
AF (%) |
DV (%) |
ADF (%) |
HEMI (%) |
CELL (%) |
Lignin (%) |
||
| Vegetative (2RGV) | 1 | 75.3a | -0.8 | 16.3a | -0.1 | 64.7a | -1.0 | 33.0a | 31.7a | 26.4a | 5.6a |
| Early boot (1RGB) | 2 | 66.4b | -1.5 | 14.9b | -0.1 | 66.7b | -0.5 | 34.2ab | 32.6a | 26.8a | 6.3b |
| Early boot (2RGB) | 2 | 70.5c | -1.7 | 13.0b | -0.2 | 65.8ab | -0.7 | 36.0b | 29.9b | 29.0b | 5.6a |
|
Significance (P): |
|||||||||||
| Maturity | <0.01 | 0.93 | 0.06 | 0.99 | 0.06 | 0.93 | 0.06 | 0.01 | 0.03 | 0.03 | |
| MSD5 | 2.0 | 7.3 | 2.5 | 2.3 | 1.4 | 3.8 | 2.1 | 0.9 | 1.6 | 0.4 | |
1 CP = crude protein; NDF = neutral detergent fiber; ADF = acid detergent fiber; HEMI = hemicellulose; CELL = cellulose. ↲
2 Each value is the mean of three samples. ↲
3 2RGV = second regrowth vegetative stage; 1RGB = first regrowth early-boot stage; 2RGB = second regrowth early-boot stage. ↲
4 DV = difference value (weighback concentration minus AF concentration). ↲
5 MSD = minimum significant difference from the Waller-Duncan k-ratio (k = 100) t test; can be used to compare any two treatments. Treatments with different superscripts are different. ↲
Experiment 10B.
Masticate dry matter was greatest for the 2RGV hay and similar to the 1RGB hay. This is attributed to less chewing (less incorporation of saliva) compared with the RG2 early-boot hay (Table 10.3). The median particle size of masticate differed (P = 0.03) among hays, but the differences were small and probably of little biological importance. The masticate in vitro true dry matter disappearance reflects steer dry matter digestibility, which was greatest for the 2RGV hay and least for the 1RGB hay, with no differences noted in neutral detergent fiber among hays. The hays averaged 36.9% large particles, 50.4% medium particles, and 12.7% small particles. In general, in vitro true dry matter disappearance within each particle-size class was greatest, and neutral detergent fiber was least, for the 2RGV hay. Further, 2RGB hay had greater in vitro true dry matter disappearance than did 1RGB hay. Neutral detergent fiber differences were not significant (Table 10.3). Particle size distributions for both whole masticate and feces are presented in Figure 10.1.
| Maturity3 | Year | Whole Masticate | Particle-size classes4 | ||||||||||||
|---|---|---|---|---|---|---|---|---|---|---|---|---|---|---|---|
| Large | Medium | Small | |||||||||||||
|
DM (%) |
PS (mm) |
IVTD (%) |
NDF (%) |
CP (%) |
Prop (%) |
IVTD (%) |
NDF (%) |
Prop (%) |
IVTD (%) |
NDF (%) |
Prop (%) |
IVTD (%) |
NDF (%) |
||
| Vegetative (2RGV) | 1 | 21.1a | 1.4a | 77.1a | 59.6a | 16.0a | 38.6a | 77.0a | 62.5a | 49.5a | 77.2a | 60.7a | 11.9a | 78.4a | 58.7a |
| Early boot (1RGB) | 2 | 19.0ab | 1.3b | 70.3b | 61.5a | 14.3b | 33.0b | 70.2b | 63.7ba | 53.5b | 70.2b | 62.8b | 13.5a | 73.1b | 61.1b |
| Early boot (2RGB) | 2 | 18.1b | 1.4a | 76.0a | 61.9a | 12.5c | 39.2a | 75.4a | 64.7b | 48.1a | 75.5c | 62.7b | 12.7a | 77.1c | 59.9b |
|
Significance (P): |
|||||||||||||||
| Maturity | 0.04 | 0.03 | <0.01 | 0.14 | <0.01 | 0.02 | <0.01 | 0.09 | 0.01 | <0.01 | 0.05 | 0.46 | <0.01 | 0.06 | |
| MSD5 | 2.2 | 0.1 | 2.9 | 2.5 | 0.83 | 4.1 | 2.1 | 2.2 | 2.8 | 1.3 | 1.9 | 3.4 | 1.3 | 2.1 | |
1 IVTD = in vitro true dry matter disappearance; NDF = neutral detergent fiber; CP = crude protein. ↲
2 Each value is the mean of six steers. ↲
3 2RGV = second regrowth vegetative stage; 1RGB = first regrowth early-boot stage; 2RGB = second regrowth early-boot stage. ↲
4 Large = ≥ 1.7 mm; medium = < 1.7 and ≥ 0.5 mm; small = < 0.5 mm; Prop = proportion. ↲
5 MSD = minimum significant difference from the Waller-Duncan k-ratio (k = 100) t test; can be used to compare any two treatments. Treatments with different superscripts are different. ↲
Summary and Conclusions
- Reed canarygrass cut in the vegetative stage was consumed the most and had the greatest dry matter digestion.
- Reed canarygrass cut in the boot stage had adequate crude protein concentrations but lower digestion coefficients than forage cut in the vegetative stage.
- The first regrowth reed canarygrass was generally taller and more prone to lodging at the early-boot stage compared with second regrowth, which resulted in reduced nutritive value.
- Reed canarygrass can contribute to animal production systems in the mid-Atlantic region, but further consideration needs to be given to agronomic characteristics such as regrowth rates, total seasonal yield, and stand persistence.
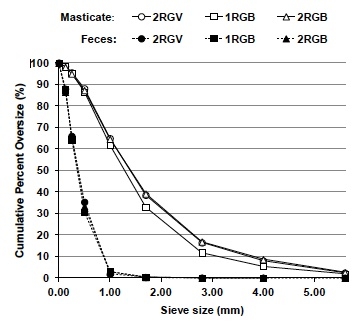
Figure 10.1. Particle cumulative percent oversize for masticate and feces from steers feed second regrowth vegetative (V) hay (2RGV), first regrowth early-boot (1RGB) hay, and second regrowth early-boot (2RGB) hay of reed canarygrass.
Appendix
General Procedures of Experimentation
The general procedures (GP) followed in conducting the various experiments presented in this bulletin are noted below and are not repeated elsewhere. Departures from procedure or specific details related to any one experiment are noted under the Materials and Methods section of each experiment, with reference to the appropriate general procedures outlined below. Animal experiments were conducted primarily in the months of October through April, but occasionally an experiment was extended into May. This practice avoided the potential negative influences of elevated temperatures on animal behavior during the hot summer months.
GP-1. Hay Handling
All hays evaluated in the various experiments were harvested from well-established stands. When hay was field cured, the forage was cut with a mower-conditioner and baled with a conventional square baler. When hay was artificially dried, the forage was cut with a flail-chopper, blown into a self-unloading wagon, and transported to a bulk drying barn at the NC State University Forage-Animal Metabolism Unit in Raleigh. After drying, the hay was baled with a conventional square baler. Prior to feeding, field cured hay bales were passed through a hydraulic bale press (Van Dale 5000, J. Starr Industries, Fort Atkins, WI) with stationary knives spaced at 4 inches. This process reduced hay into 3- to 5-inch lengths with little to no leaf loss, which both aided feeding and minimized the potential for the hay to be tossed out of the manger by the animal. Forage that was flail-chopped was reduced into 3- to 6-inch lengths when cut and required no further processing prior to feeding.
GP-2. Dry Matter Intake and Whole-Tract Digestibility
Evaluation by steers: Forages were evaluated at the NC State University Forage-Animal Metabolism Unit in Raleigh in an animal facility consisting of a metal structure partitioned into three areas. On one end was a feed preparation area. The middle was an enclosed but well-ventilated central area equipped with digestion crates and temperature control designed to keep the ambient air temperature between 50°F and 85°F. The third section, on the opposite end from the feed preparation area, was equipped with a raised basket-weave metal platform fitted with electronic gates (American Calan Inc., Northwood, NH) to control animal access to mangers for individual intake measurements. The intake area was beneath an extension of the roof with three open sides. In the intake phase each animal was electronically keyed to allow access to only one manger, but the animal had free access to trace mineralized salt and water and could lounge with other animals. Prior to each experiment, animals were conditioned to the electronic gates before random assignment to the appropriate forage treatment.
The intake phase of each experiment consisted of a 21-day period, with the first seven days used for adjustment and the last 14 days to estimate daily dry matter intake (Burns et al., 1994). A recorded weight of hay was fed twice daily, allowing about 13% to 15% excess. A daily sample of the fed hay was obtained for each animal, and composites were made on a weekly basis. The unconsumed hay (weighback) was weighed twice daily, saved separately for each animal-treatment combination, and composited each week.
The digestion phase consisted of 12 days either immediately following an intake period or during a separate digestion evaluation. In either case, animals were moved into digestion crates. The digestion phase consisted of a seven-day adjustment period followed by a five-day total fecal and urine (if applicable) collection (Cochran and Galyean, 1994). A recorded weight of forage was fed twice daily at about 15% excess. A daily sample of the fed hays was obtained, and weighback was saved separately for each animal-treatment combination and composited for the five-day collection period.
Urine was collected in containers acidified with 6N HCl to maintain acidic conditions. The volume was determined daily, and a 5% daily aliquot was retained. The daily aliquots were pooled by steer and stored frozen for subsequent analysis. Feces were collected on a plastic sheet placed on the floor immediately in back of each digestion crate. Feces were removed periodically throughout the day, and the daily total weight of feces was recorded for each of five consecutive days. Feces were thoroughly mixed daily, and 5% of the fresh weight was placed in a freezer (5°F). When part of the experimental objectives, a second sample was obtained and placed in a freezer for freeze drying and particle size determination.
The weekly hay samples from the 14-day intake phase, the five-day composite hay and fecal samples from the digestion phase, and the associated weighback samples from the intake and digestion phases were generally oven dried (131°F) and weighed for dry matter determination. Samples were then thoroughly mixed, a 300g to 500g subsample was ground in a Wiley mill to pass a 1 mm screen, and the ground subsample was stored at room temperature until analyzed. The samples for fecal particle size determination remained in the freezer (5°F) until freeze dried and were dry sieved as noted below for masticates.
In experiments using a randomized complete block design, the digestion phase followed the intake phase and completed the experiment for each animal. However, in Latin square designs, once animals completed one period they returned to the intake facility following the digestion phase to begin the next period.
Evaluation by sheep and goats: Forages were evaluated by sheep and goats in an animal facility that included a building constructed for small-ruminant research with temperature control designed to maintain ambient air temperature between 50°F and 85°F. The animals were held in digestion crates with free access to salt and water. When animals were initially placed in crates, they were fitted with a collection harness for future fecal collections. After an initial standardization period (14 d) allowing conditioning to the crates and harness, each animal was randomly assigned to a treatment. At the initiation of the digestion phase, a canvas collection bag was positioned on the harness and was fitted with a plastic insert for total fecal collection. During collection, the fecal bags were emptied daily, and the feces were processed as described above for steers.
GP-3. Masticate Collection and Processing
Mature, esophageally fistulated, grade British-bred steers (800 to 1400 pounds) were generally used and were fed a standard hay about five days before initiation of an experiment. After adjustment to treatments (offered the previous afternoon), collections generally occurred at about 9:00 a.m. and 3:00 p.m. on two consecutive days. Animals were offered about 3 pounds of hay at each collection. The esophageal cannulas were removed and boluses collected by hand to ensure complete collection. The first five to six boluses were discarded, and the following 10 to 15 were collected. If chewing behavior was determined, the chews per bolus were recorded, each bolus was handled separately, and we obtained a fresh-and freeze-dried weight of each bolus prior to mixing. Otherwise the boluses were placed on a large plastic tray, gently mixed, placed into two plastic bags, and immediately quick frozen in liquid nitrogen (-319°F). The boluses were stored in a freezer (5°F) until freeze dried and then returned to the freezer until analyzed. The dried boluses were sampled for chemical analyses and for particle size determination.
GP-4. Preference Experiments
Preference experiments using steers, sheep, or goats were conducted in pens using individual animals. Prior to an experiment, animals were offered a meal of each of the experimental hays to allow an association of each hay with any postingestive feedback produced by the forage. The order in which the hays were fed was randomized for each animal. In experiments with sheep and goats (conducted in pens 4.9 × 6.5 feet), pairs of forages of 1.7 pounds each were generally offered in plastic containers, and animals were allowed about 2.0 to 2.5 hours to feed. At approximately 30 minutes after offering the feed, an intermediate weight was obtained and used to calculate an intake rate by dividing hay disappearance during 30 minutes by the time in minutes. Hays for evaluation were randomized in both order of presentation and in left-right position when paired.
Steers were typically fed in pens (8 × 13 feet) and were offered about 4.5 pounds of each of two feeds for about 30 minutes. In some experiments, four mangers were within a larger pen (16 × 26 feet), allowing a maximum of four hays to be evaluated at a time. The hays were randomized at presentation. The left-right position was also randomized when fed in pairs, and all positions were randomized when fed in groups of four. A video recorder was used to estimate total time spent at each feeder in order to calculate intake rate by dividing hay disappearance by minutes at a feeder.
In all preference experiments, care was taken to collect representative samples of the as-fed forage and weighback and also to prevent consumption of all of the more preferred hays from the manger.
GP-5. Particle Size Determination
Particle size estimates of the boluses and feces were obtained by passing two subsamples of 15 g each through a Fritsch vibrator system (Fritsch Analysette, Tekmor Co., Cincinnati, OH). Nine particle sizes were weighed, consisting of dry matter retained on sieves sized at 5.60 mm, 4.00 mm, 2.80 mm, 1.70 mm, 1.00 mm, 0.50 mm, 0.25 mm, and 0.125 mm, and of dry matter that passed through the 0.125 mm sieve (<0.125 mm). The dry weight was recorded for the material retained on each sieve and for the material that passed through the 0.125 mm sieve, and the percentage of cumulative particle weight oversize was determined and used to calculate median particle size (Fisher et al., 1988). Samples were composited across days and feeding times for each sieve size. Particle size estimates of fecal samples were also determined as noted above for masticates, but only one sample was passed through the sieves. Sieved samples of both masticate and feces were either stored separately by individual sieve size, or composites were made to form three particle-size classes of large (≥1.7 mm), medium (<1.7 and ≥0.50 mm), and small (<0.50 mm) prior to chemical analyses. The composite samples were ground in a cyclone mill (Udy Corp., Fort Collins, CO) to pass a 1 mm screen and stored in a freezer until analyzed.
GP-6. Multidimensional Scaling
Multidimensional scaling is a method of determining how many criteria are being used to determine preference among a collection of feeds. The feeds were presented in pairs, and the relative intake of each feed in the pair then expresses a preference within that pair. If equal quantities were consumed, then there is no (0) preference expressed. If only one of the pair is consumed, then the preference is large for one of the pair over the other feed in the pair. All pairs were tested by each animal; then statistical tests indicated how many criteria must be present in order to create the differences expressed by the test animals. At that point we mapped the differences graphically and determined which of the feeds were thought by the steers to be close to the same and which were thought to be different. Then real-world variables were compared with the dimensions expressed by the steers to develop an understanding of what was creating the preferences among the group of feeds. On occasion, the steers used a criterion that was not associated with any variable we measured, but often the various estimates of nutritive value would be associated with the dimensions of preference expressed by the steers.
GP-7. Laboratory Analysis
Nutritive value for all as-fed, weighback, fecal, and masticate samples, as appropriate for the various experiments, were either analyzed by wet chemistry and reported, or were used to develop calibration equations in association with the prediction of nutritive value using near-infrared reflectance spectroscopy.
In vitro dry matter disappearance was determined using a modification of the method by Tilley and Terry (1963), and in vitro true dry matter disappearance was determined by 48-hour fermentation in a batch fermentation vessel (Ankom Technology Corp., Fairport, NY) with artificial saliva and rumen inoculum according to Burns and Cope (1974). In vitro fermentation was terminated with neutral detergent solution in an Ankom 200 fiber analyzer (Ankom Technology Corp., Fairport, NY) to remove the residual microbial dry matter. Ruminal inoculum was obtained from a mature rumen-fistulated steer generally fed a mixed alfalfa (Medicago sativa L.) and orchardgrass (Dactylis glomerata L.) hay. Total nitrogen was determined colorimetrically (AOAC, 1990) with a Technicon Autoanalyzer (Bran and Luebbe, Buffalo, IL), and crude protein was estimated as 6.25 times the nitrogen concentration. Total nonstructural carbohydrates and constituent starch, monosaccharides, disaccharides, and polysaccharides were determined according to Burns et al. (2006). Fiber fractions, consisting of neutral detergent fiber (NDF), acid detergent fiber (ADF), lignin, and ash, were estimated using reagents according to Van Soest and Robertson (1980). Hemicellulose was determined by difference between (NDF – ADF), as was cellulose, depending on procedures used.
GP-8. Statistical Analysis
The data from the intake, digestion, and masticate phases for each experiment were analyzed and presented as least square means from the application of mixed model methodology as appropriate based on the design for the particular experiment. Particle sizes, when determined, were expressed as percentage of cumulative particle weight oversize (sum of dry matter weight on each sieve vs. weight from all larger sieves) and were used to determine mean and median particle size (Fisher et al., 1988). Means for all variables found significant in each experiment were compared by either trend analysis with a set of polynomial orthogonal contrasts or by a set of meaningful comparisons using orthogonal contrasts, as appropriate, within the mixed model analysis of variance. A minimum significant difference was also included at times to assist the reader in determining differences between individual treatments.
References and Related Publications
AOAC. 1990. Official Methods of Analysis. 15th ed. Association of Official Analytical Chemists, Arlington, VA. ↲
Burns, J.C., and W.A. Cope. 1974. Nutritive value of crownvetch forage as influenced by structural constituents and phenolic and tannin compounds. Agron. J. 66:195-200. ↲
Burns, J.C., D.S. Fisher and G.E. Rottinghaus. 2006. Grazing influences on mass, nutritive value and persistence of stockpiled Jesup tall fescue without and with novel and wild type fungal endophytes. Crop Sci. 46:1898-1912. ↲
Burns, J.C., K.R. Pond, and D.S. Fisher. 1994. Measurements of intake. p. 494-532. In G.C. Fahey, Jr. et al. (ed.) Forage quality, evaluation, and utilization. ASA, CSSA, and SSSA, Madison, WI. ↲
Cochran, R.C., and M.L. Galyean. 1994. Measurements of in vivo forage digestion by ruminants. p. 613- 643. In G.C. Fahey, Jr. et al. (ed.) Forage quality, evaluation, and utilization. ASA, CSSA, and SSSA, Madison, WI. ↲
Fisher, D.S., J.C. Burns, and K.R. Pond. 1988. Estimation of mean and median particle size of ruminant diets. J. Dairy Sci. 71:518-524. ↲
Tilley, J., and R.A. Terry. 1963. A two-stage technique for in vitro digestion of forage crops. J. Br. Grassl. Soc. 18:104-111. ↲
Van Soest, P.J., and J.B. Robertson. 1980. Systems of analysis for evaluating fibrous feeds. p. 49-60. In W.J. Pigden et al. (ed.) Standardization of analytical methodology for feeds. International Development Res. Center, Ottowa, Canada. ↲
Related Publications
Burns, J.C. 2009. Chapter 11. Nutritive value. pp. 159- 201. In H.A. Fribourg et al. (ed.) Tall fescue for the twenty first century. Agron. Mono No. 53. ASA, CSSA, and SSSA, Madison WI.
Burns, J.C., and D.S. Chamblee. 2000. Summer accumulation of tall fescue at low elevations in the humid southeast. I. Fall yield and nutritive value. Agron. J. 92:211-216.
Burns, J.C., and D.S. Chamblee. 2000. Summer accumulation of tall fescue at low elevations in the humid southeast. II. Fall and winter changes in nutritive value. Agron. J. 92:217-224.
Burns, J.C., D.S. Chamblee, and F.G. Giesbrecht. 2002. Defoliation intensity effects on season-long dry matter distribution and nutritive value of tall fescue. Crop Sci. 42:1274- 1284.
Burns, J.C., and D.S. Fisher. 2006. Intake and digestion of ‘Jesup’ tall fescue hays with a novel fungal endophyte, without an endophyte, or with a wild-type endophtye. Crop Sci. 46:216-223.
Burns, J.C., and D.S. Fisher. 2010. Intake and digestibility of improved selections of tall fescue and orchardgrass hays. Crop Sci. 50:419-426.
Burns, J.C., and D.S. Fisher. 2011. Stocking strategies as related to animal and pasture productivity of endophyte-free tall fescue. Crop Sci. 51:2868-2877.
Burns, J.C., D.S. Fisher, and H.F. Mayland. 2001. Preference by sheep and goats among hay of eight tall fescue cultivars. J. Anim. Sci. 79:213-224.
Burns, J.C., D.S. Fisher, and K.R. Pond. 2011. Tall fescue forage mass and canopy characteristics on steer ingestive behavior and performance. Crop Sci. 51:1850-1864.
Fisher, D.S., and J.C. Burns. 2008. Testing for variation in animal preference for Jesup tall fescue hays with wild type, novel, or no fungal endophyte. Crop Sci. 48:2026-2032.
Fisher, D.S., H.F. Mayland, and J.C. Burns. 1999. Variation in ruminants’ preference for tall fescue hays cut either at sundown or at sunup. J. Anim. Sci. 77:762-768.
Tall Fescue: No-till establishment, defoliation, growth distribution, yield, stockpiling management and nutritive value. 2002. North Carolina ARS Technical Bull. 317. NC State University
Publication date: July 1, 2013
Reviewed/Revised: June 21, 2024
TB-331
N.C. Cooperative Extension prohibits discrimination and harassment regardless of age, color, disability, family and marital status, gender identity, national origin, political beliefs, race, religion, sex (including pregnancy), sexual orientation and veteran status.