
Introduction
Since the passing of the NC Renewable Energy Portfolio Standard (REPS), participating biomass facilities have generated the most renewable energy certificates (RECs)-73%, of all forms of renewables, while providing 660 jobs and nearly $200 million in economic output. The facilities that are generating these biomass REC’s are classified as Independent Power Producers (IPP’s) and combined heat and power [1] (CHP) facilities. CHP refers to a suite of technologies that can use a variety of fuels to generate electricity or power at the point of use, allowing the heat that would normally be lost in the power generation process to be recovered to provide needed heating and/or cooling.
Logging residues are the main biomass feedstock procured with a gate value of $44.4 million. The biomass facilities generating REC’s have offset approximately 222 MW of fossil-based electrical generating capacity.
[1] These facilities utilize the simultaneous production of heat and electrical energy, thus increasing fuel efficiency.
NC REPS Background
NC REPS Background
In an effort to promote more renewable energy generation, the North Carolina General Assembly adopted Session Law 2007-397 (Senate Bill 3 [2]), and adopted the Renewable Energy and Energy Efficiency Portfolio Standard (REPS). The REPS requires that 12.5% of North Carolina electric retail sales from investor owned utilities by 2021 and beyond be acquired from renewable energy sources or energy efficiency measures. Rural electric cooperatives and municipal suppliers are subject to a 10% REPS requirement.
The North Carolina Utilities Commission tracks renewable energy generation by issuing a REC [3]. Each tradable REC created is equal to one megawatt-hour (MWh) of renewable energy produced. Also, 3.412 million BTUs of thermal energy equals one REC. The number of RECs purchased by the utilities in 2014 was approximately 6.5 million. Of this number, approximately 73% were derived from biomass (woody biomass at 48% and other biomass [4] at 25%), hydroelectric 13%, solar 13%, and other [5] at 1% (Figure 1) (NCUC-RETS, 2014).
[2] NC General Assembly: http://www.ncga.state.nc.us/gascripts/billlookup/billlookup.pl?Session=2007&BillID=S3
[3] The North Carolina Utilities Commission Renewable Energy Certificate (REC) Tracking System, http://www.ncuc.commerce.state.nc.us/reps/REC_Tracking_System.htm
[4] Includes animal waste, landfill waste, poultry waste, and other biogenic sources.
[5] Includes wind and tire derived fuel.
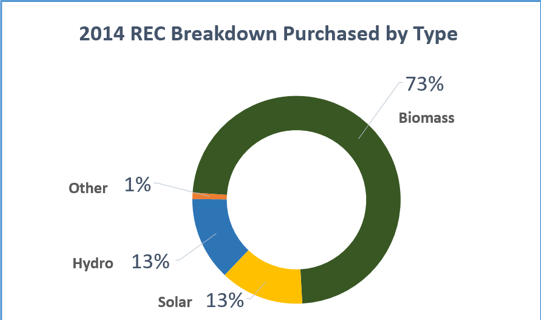
Figure 1. 2014 Renewable Energy Credits (REC) purchased by renewable category.
Historic Energy Consumption in the United States and North Carolina
Before coal surpassed wood as the primary energy source in the United States, wood was used to power factories, riverboats, ships, and railroads. Wood energy use declined slightly after coal surpassed it in 1885, but has surprisingly stayed consistent as an energy source for the industrial, power, commercial, and residential sectors. In 2014, renewable energy represented approximately 9.8% of the energy consumed in the United States (Figure 2) (EIA, Table 10.1). The specific percentages by renewable energy source are: hydroelectric (2.5%), woody biomass (2.3%), wind (1.8%), biofuels (2.1%), solar (0.43%) and other [6] (0.67%) (EIA, Table 1.3). Renewable energy from woody biomass is the second largest sector following close behind hydroelectric.
In 2014, approximately 7.9% or 200.7 trillion Btu’s of the primary energy [7] consumed in North Carolina was from renewable energy resources (Table C3). Breaking this down by source: woody biomass 4.4%, hydroelectric 1.8%, fuel ethanol 1.3%, solar 0.36%, and geothermal <1%. (EIA, Table C3). The sector that consumed the most energy was residential at 28.3%, followed by, transportation at 28%, commercial at 22.6%, and industrial at 21.2% (EIA, Table C9). According EIA primary energy consumption estimates, renewable energy in North Carolina increased 2.9% from the benchmark of 5% in 2005 (Cherry & Saha, 12 & EIA, Table C3).
North Carolina has an abundance of biomass resources that are utilized today for electricity and heat and biofuels. Using biomass resources for energy provides base load power to the existing infrastructure which means that the power plants operate continuously and only stop for maintenance or when severe weather or unexpected outages occur. Solar and wind are intermittent as power is only produced when the sun is shining or the wind is blowing.
In 2014, the electric power industry generated 128 + million MWhs in North Carolina (EIA, Table 5). The majority of the power generated was from the electric utilities (93.2%) versus the independent power producers (IPP [8]’s) and combined heat and power (CHP) facilities (EIA, Table 5). Fossil fuels provided 61.7% of the energy generated with nuclear at 34.3%, and renewable energy at approximately 4% (Figure 3) (EIA, Table 5). The (IPP)’s and (CHP) facilities have a larger share of their fuel coming from renewable resources (Figure 3). This sector contributed the rest of energy generated in North Carolina (6.8%) with a larger share of their fuel (38.4%) coming from renewable resources (EIA, Table 5). Woody Biomass was the top renewable energy resource generated by IPP’s / CHP’s, contributing over a fifth (23.27%) of the power generated with other biomass [9] contributing an additional 6% (EIA Table, 5). Solar contributed 8.3%, hydro 0.83%, and other [10] at 7.20% (EIA, Table 5).
[6]A corporation, person, agency, authority, or other legal entity or instrumentality that owns or operates facilities for the generation of electricity for use primarily by the public, and that is not an electric utility.
[7] Other biomass includes agricultural byproducts, landfill gas, biogenic municipal solid waste, other biomass (solid, liquid and gas).
[8] Other includes non-biogenic municipal solid waste, batteries, chemicals, hydrogen, pitch, purchased steam, sulfur, tire-derived fuel.
[9] Other includes waste (municipal solid waste from biogenic sources, landfill gas, sludge waste, agricultural byproducts, and other biomass) and geothermal.
[10] Energy in the form that it is first accounted for in a statistical energy balance, before any transformation to secondary or tertiary forms of energy. (EIA Glossary)
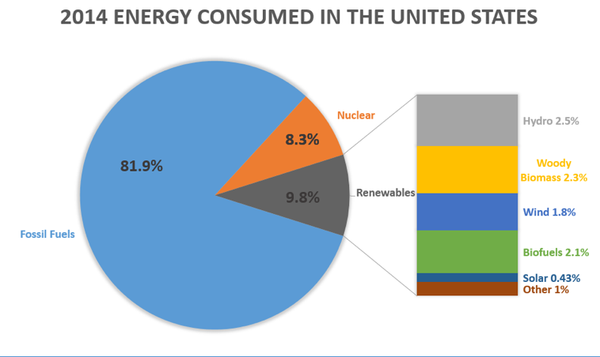
Figure 2. The primary type of energy consumed in the United States in 2014.
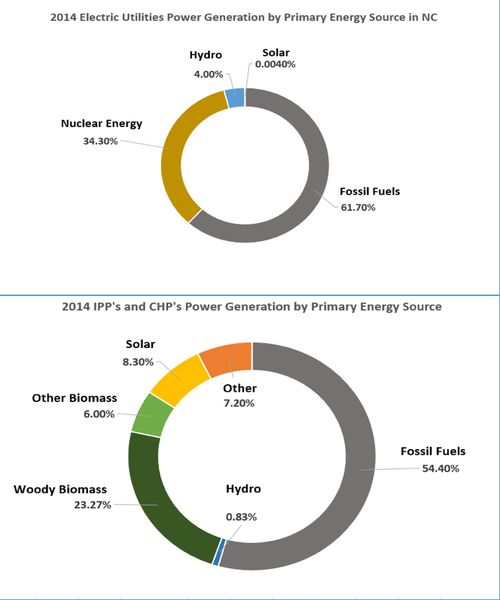
Figure 3. A comparison of the power generated from primary energy sources in NC genertated by the Utilities and Independent Power Producers (IPP) and Combined Heat Power (CHP) plants.
Logging Residues – A Sustainable Source of Biomass Energy
North Carolina has 18.6 million acres of forest land with 17.9 million acres available for commercial timber production. The state has a robust forest products manufacturing sector producing $18.5 billion in output with a workforce totaling 70,300 and a payroll of $3.8 billion in 2013 (McConnell, Jeuck). North Carolina’s timberlands are growing more wood than harvested with the annual growth exceeding annual removals at 1.5 for softwoods and 2.2 for hardwoods; both exceed the sustainable forest management criteria of being greater than 1.2 (McConnell, Jeuck).
Logging residues are obtained from thinning young stands, from final forest harvests, or from salvage operations from stands that have been damaged by pests, storms, disease, or fires. Logging residues or un-merchantable trees of a forest harvest are usually chipped on site and loaded into a tractor trailer for transport to a power facility after timber and pulpwood have been sorted. Chipped logging residues that have not been debarked are commonly referred to as hog fuel or “dirty” chips, whereas chipped residuals that contain no bark or leaves are commonly referred to as “clean chips.” Most biomass power facilities accept dirty or clean chips and sometimes pulpwood if facilities such as a pulp or paper mill are not within approximately 50 miles of the timber harvest site.
Independent Power Producers and Combined Heat and Power
North Carolina’s forest products facilities such as pulp & paper mills, sawmills, and wood product manufacturers have been using wood waste in their operations to offset energy costs as it is a byproduct from producing other forest products such as lumber, ties, poles, paper, furniture, etc. Harvesting timber for this robust sector provides a variety of byproducts from logging residues to mill wastes ensuring an adequate sustainable supply of woody biomass where forest manufacturing operations are prevalent. Standalone power plants and industrial facilities with wood fired boilers have been able to receive a consistent supply locally at more stable fuel prices than traditional fossil fuel resources. Not all facilities that utilize woody biomass energy generate REC’s for Utility REPS compliance. In 2014, the facilities in Table 1 generated REC’s within North Carolina.
| Facility | Owner | City | Electrical Capacity, kW |
|---|---|---|---|
| Capital Power | CPI USA North Carolina LLC | Roxboro | 47,000 |
| Capital Power | CPI USA North Carolina LLC | Southport | 86,000 |
| Coastal Carolina Clean Power | ReEnergy | Kenansville | 32,000 |
| Craven County Wood Energy | CMS Energy | New Bern | 55,000 |
| House of Raeford | W.E. Partners, IV | Rosehill | 575 |
| Perdue Agribusiness | W.E. Partners I, LLC | Cofield | 375 |
| Perdue Agrirecycle | W.E. Partners II, LLC | Lewiston | 475 |
| Prestage Farms | Prestage Farms, Inc. | Clinton | 150 |
| Total | 221,575 |
Economic Contributions of Electricity Generation from Biomass
Biomass price estimates for 2014 were obtained from RISI. An annual average price was calculated for the year and multiplied by the biomass input for the Electricity Generation-Biomass sector obtained from NC State Extension Forestry to arrive at a total biomass gate value of $44.4 million.
A 2014 economic analysis using the commercial tool IMPLAN model [11] constructed for North Carolina that was closed to households. Commercial Logging output data were customized per Jeuck’s and Bardon’s (2016) estimate for delivered timber in the state. Employment for Forestry and Logging (NAICS 113) sectors were forced to consistency with U.S. Bureau of Economic Analysis estimates for North Carolina.
A single-sector contributions analysis for the Electricity Generation-Biomass sector was performed. A contributions analysis describes the economic the effects of a sector within a modeled economy, or the extent to which the economy is influenced by the industry of interest. Direct contributions essentially provide a “head count” of the Electricity Generation-Biomass sector in North Carolina. They describe the employment, value added and output required to meet final demand for the energy source (Table 2). Employment is both full- and part-time jobs. Value added is the income returned to the state economy as a contribution to Gross Domestic Product. Output is a measure of gross sales.
Indirect contributions are the backward linked effects generated through the Electricity Generation-Biomass supply chain to produce outputs that will ultimately be used as inputs to generate electricity via biomass. Together, the direct and indirect contributions explain the inter-industry effects contributed to North Carolina’s economy. Household contributions introduce another round of spending in North Carolina where portions of the income paid to workers is fed back into the state’s economy. These induced effects result from the purchasing goods and services by employees in the Electricity Generation-Biomass sector and its supply chain.
The Electricity Generation-Biomass sector and its supplying industries together contribute 460 jobs and $173 million in economic activities to North Carolina; $91 million are contributed to state GDP across the market chain. Including the additional effects of household spending push the Electricity Generation-Biomass contributions even higher. In total, approximately 660 jobs and $199 million in output were contributed to North Carolina in 2014 from producing electricity from biomass. Value added contributions to state GDP were nearly $106 million.
| Contributions | Employment | Total Value Added | Output |
|---|---|---|---|
| Direct | 85 | $63,133,000 | $123,060,000 |
| Indirect | 375 | $27,942,000 | $49,997,000 |
| Inter-industry | 460 | $91,075,000 | $173,057,000 |
| Household | 199 | $14,796,000 | $25,848,000 |
| Total | 659 | $105,871,000 | $198,905,000 |
[11] IMPLAN (Impact analysis for PLANning). Data and software developed by MIG, Inc. that uses classic input-output analysis in combination with regional specific social accounting and multiplier models.
Conclusion
Biomass energy is a sustainable source of energy that provides jobs and contributes to the economy of the North Carolina. The majority of renewable energy certificates are created from woody biomass by a baseload generating capacity of 222 MW’s. In areas where the forest industry is more prevalent, logging residues have been generating electricity at local forest product facilities for decades. It is not uncommon to have industrial combined heat and power facilities or other facilities that require baseload power to utilize woody biomass as it is an abundant resource with more stable prices than fossil based fuels. It is uncertain if this sector will continue to provide the majority of REC’s given the recent increase in new solar facilities. While solar energy provides benefits for the state it could cause overcapacity problems which may result in renewable energy going to waste. It is important for North Carolina moving forward to continue providing more baseload power from biomass as the sector in 2014 provided 660 jobs with an economic output of approximately $200 million.
References
Brown, M.J. 2015. Forests of North Carolina, 2013. Resources Update FS-47. Asheville, NC: U.S. Department of Agriculture Forest Service, Southern Research Station. 4 p.
Jeuck and Bardon. 2015. 2014 Income of North Carolina Timber Harvested and Delivered to Mills. NC State Extension Forestry, Raleigh, NC. 2 p.
McConnell, T.E., et al. North Carolina's Forest and Forest Products Industry by the Numbers. North Carolina Cooperative Extension Service AG-817. North Carolina State University, 2016.
NCUC. (2016, August 01). North Carolina Renewable Energy Tracking System (NC-RETS), Calendar year 2014.
Cherry, Diane, and Shubhayu Saha. "Renewable Energy in North Carolina." Popular Government 73, no. 3 (Spring 2008): 12-23.
U.S. Energy Information Administration. (2016, August). North Carolina State Profile and Energy Estimates. Table 5. Electric power industry generation by primary energy source, 1990 through 2014 North Carolina.
U.S. Energy Information Administration. (2016, July). Total Energy, Monthly Energy Review. Table 1.3, Energy Overview: Primary Energy Consumption by Source (Quadrillion Btu).
U.S. Energy Information Administration. (2016, July). Total Energy, Monthly Energy Review. Table 10.1, Renewable Energy: Renewable Energy Production and Consumption by Source (Trillion Btu).
U.S. Energy Information Administration. (2016, June). State Energy Data System (SEDS): 1960-2014 (complete). Table C9, Electric Power Sector Consumption Estimates, 2014 (Trillion Btu).
U.S. Energy Information Administration. (2016, June). State Energy Data System (SEDS): 1960-2014 (complete). Table C3, Primary Energy Consumption Estimates, 2014 (Trillion Btu).
Publication date: July 5, 2018
Reviewed/Revised: April 19, 2023
N.C. Cooperative Extension prohibits discrimination and harassment regardless of age, color, disability, family and marital status, gender identity, national origin, political beliefs, race, religion, sex (including pregnancy), sexual orientation and veteran status.
N.C. Cooperative Extension prohibits discrimination and harassment regardless of age, color, disability, family and marital status, gender identity, national origin, political beliefs, race, religion, sex (including pregnancy), sexual orientation and veteran status.