
The forest economy supports communities in every county of North Carolina. Industrial demand incentivizes forest stewardship, which improves environmental diversity, forest health, wildlife habitat, recreational opportunities, and the potential for landowners to receive future timber incomes. Consequently, soils are stabilized, both water and air are filtered, while carbon is sequestered. Landowner and public satisfaction together ultimately lead to the forest enterprise being deemed socially acceptable.
North Carolina’s Forests in 2013
Hardwoods vs Softwoods
- The state’s forests and forest products industry was dominated by hardwoods in terms of number of species, acres of timberland, and live standing tree inventory (Figure 1).
- In 2013, hardwoods produced 397 million cubic feet and softwoods produced 251 million cubic feet.
- Over 2.5 million acres (14%) of North Carolina’s timberland—and 4.3 billion cubic feet of the softwood inventory—are Loblolly pine plantations.
- The standing tree inventory in 2013 increased by 1.7%, which is analogous to over 59 million 8-foot 2×4s!
North Carolina’s timberland grows more wood than is harvested.
- North Carolina’s timberlands are growing 50% more softwood and 100% more hardwood than they are harvesting.
- North Carolina’s timber inventory has increased by 45% since 1974.
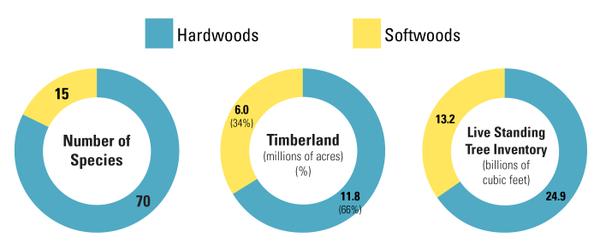
Figure 1. In North Carolina, hardwoods dominate softwoods in number of species, timberland acreage, and live standing tree inventory (Brown and Vogt 2015).
North Carolina’s Forest Products Industry in 2013
North Carolina timber
- has increased in price since 1992, for both delivered softwood and hardwood timber, despite the recent economic downturn;
- produced approximately $391.5 million in revenue for the state’s private forest landowners; and
- delivered to wood-using mills was valued at $774.9 million.
Forest products manufacturing
- produced $18.5 billion in output and employed 70,300 people, with a payroll of $3.8 billion;
- directly generated $912 million in state, local, and federal tax revenues;
- led in total output, value added, labor income, and state tax generation with paper manufacturing;
- led in employment with wood furniture manufacturing;
- led the South in logs and wood products exports, continuing a decade-long trend;
- along with timber income, contributed $29.4 billion in output and 144,800 jobs with a payroll of $7.36 billion to North Carolina’s economy;
- contributed $10.9 billion to gross state product;
- generated 1,060 jobs throughout the state for every 1,000 forestry and forest products jobs; and
- contributed an additional $587,000 to the overall North Carolina economy for every $1.0 million generated in forestry and forest products output
Looking for county-level information on North Carolina’s forests and forest economy? You can find it at NC State University Extension Forestry’s website.
North Carolina’s Forests and Economic Contributions
This publication discusses the contributions that North Carolina’s forests and forest products industry provide to the state’s economy and presents key figures and statistics. Much of the forest data was supplied from Brown and Vogt (2015). Please refer to their work for more detailed information on North Carolina forests and for regional information. Economic contributions were estimated using IMPLAN’s 2013 database. The IMPLAN model and details of forest industry sector analysis are provided in the Forestry Impacts: Methodology for Determining Forest Sector Contributions to North Carolina's Economy factsheet (McConnell et al. 2016). NC State University Extension Forestry’s website provides county-level highlights.
North Carolina’s Timberland Characteristics
North Carolina has approximately 17.91 million acres of timberland2. The coastal plain (north and south) has the largest area of timberland followed by the piedmont and mountains (Figure 2). On a per acre basis, however, most standing inventory is found in the mountains. This difference results from greater growth rates, timber production activity, and market access in the piedmont and coastal plain than in the mountains. The mountains also contain more publically reserved lands.
Most timberland in North Carolina is privately owned. Over 469,000 family forest owners and private associations control 10.9 million acres (61%), while 4.4 million acres (24%) are in corporate or industry ownerships. Public lands (National Forests, other federal, state, and local ownerships) include 2.4 million acres (14%) of timberland. Non-governmental organizations own more than 116 thousand acres of timberlands, and Native Americans own more than 24 thousand acres. Together these make up ~1% of North Carolina timberlands (Figure 3).
Diverse hardwood forests across the state dominate North Carolina’s landscape (66% of all timberland). Softwood forest types, found mostly in the piedmont and coastal plain, cover 33%3 of the timberland area. North Carolina’s timberlands grow more than 14.7 billion trees, including at least 70 species of hardwoods and more than 15 species of softwoods. Loblolly pine is the most abundant species across diameter classes, followed by soft hardwoods (red maple, sweetgum, and yellow-poplar). Live standing timber inventory is approximately 38.4 billion cubic feet (72% in sawtimber, 28% pulpwood), of which 65% is hardwoods and 35% softwoods.
Approximately 3.2 million acres (18%) of all timberland is artificially planted (plantations). These are located in the coastal plain and piedmont, and Loblolly pine covers close to 80% of all plantation acreage.
Figure 4 illustrates two trends shaping North Carolina’s timber inventory over the past 40 years. Since 1974, North Carolina softwood plantation acreage has grown 170% to 2.7 million acres, and pine plantation inventory has increased 1,200% to 4.3 billion cu ft. Currently, 33% of the softwood live stem inventory is in pine plantations. In addition, total timber inventory has grown by 45% since 1974. Un-harvested natural hardwood stands shifting into older age classes as they mature account for most of this increase.
Sustainability
Comparing annual growth to annual removals (G:R ratio) reveals that North Carolina is stockpiling timber at considerable rates. Figure 5 shows the G:R ratios of softwoods and hardwoods for each of the four physiographic regions in the state. A G:R ratio of 1.2 indicates annual growth exceeds annual removals by 20%, and ratios less than 1.0 indicate removals are exceeding growth (James et al. 2012). Ratios more than 1.2 are considered sustainable forest management. The statewide average for softwoods is 1.5 (growth exceeds removals by 50%). The statewide average for hardwoods is 2.2 (growth exceeds removals by 120%). Figure 6 depicts the volume of hardwood and softwood added to the current inventory by region. In 2013, the state’s current inventory increased by nearly 635 million cubic feet. This increase corresponds to more than 59 million 8-foot 2-by-4s, which would circle the earth 3.1 times! Nearly 60% of the additional volume was from hardwoods and 40% from softwood.
Timber Prices, 1992 to 2013
Real prices (adjusted to 1992 base prices for all wood commodities) of North Carolina timber products delivered to primary mills continue to grow overall despite the recent 20-year trend (Figure 7)4. Even pine sawtimber in eastern North Carolina still maintained higher prices than the southeast average, despite suffering the greatest price decrease due to the housing market collapse and the 2007 to 2009 recession. Delivered prices of North Carolina timber products over the same time period are consistently lower relative to costs of all other commodities used as factors of production. North Carolina timber’s comparative advantage suggests the state’s forest products manufacturers invest more in processing higher value products that capture the highest returns within our state.
1 2013 Forest Inventory and Analysis estimate obtained 2/27/2015.
2 Timberland, by definition, is at least 10% stocked with trees, capable of growing at least 20 cubic feet of timber per year, and is not reserved by federal law for non-timber purposes.
3 Nonstocked timberland accounts for the remaining 1% for 2013.
4 Prices from 1992–2014 Timber Mart South for North Carolina and the Southeast. Historic data of timber prices are available at Extension's Forestry site. Softwood sawtimber is based on $/MBF Scribner log rule and hardwood sawtimber prices based on $/MBF Doyle log rule.
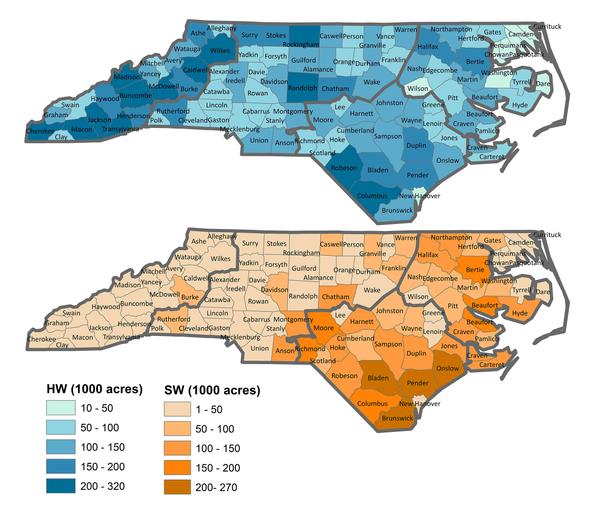
Figure 2. Acres of hardwood and softwood timberland by North Carolina county and FIA Unit (mountains, piedmont, northern coastal plain, southern coastal plain).
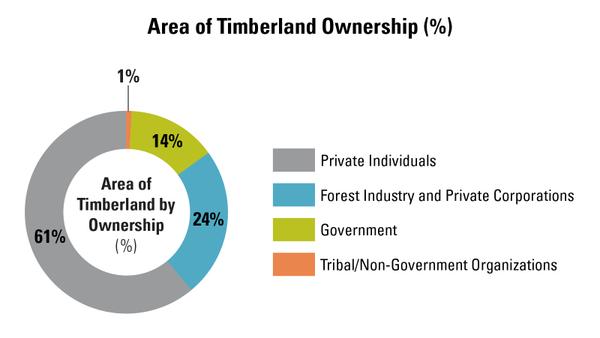
Figure 3. Approximately 17.9 million acres (60%) of North Carolina is capable of producing timber.
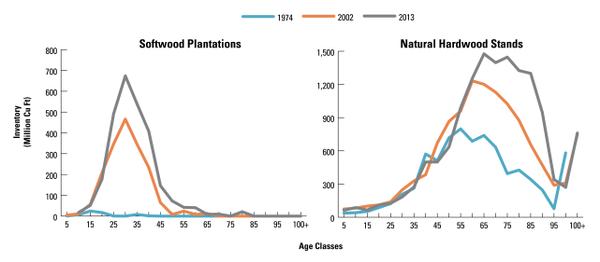
Figure 4. Forty-year shifts in growing stock sawlog inventory by species group, age, and stand origin.
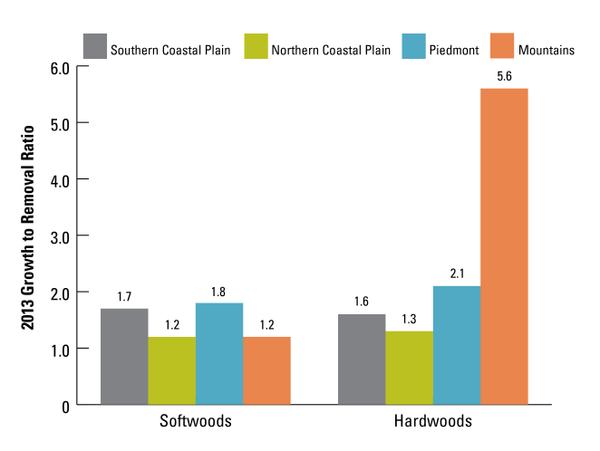
Figure 5. 2013 FIA growth to removal (G:R) ratios for North Carolina's hardwoods and softwoods by physiographic region.
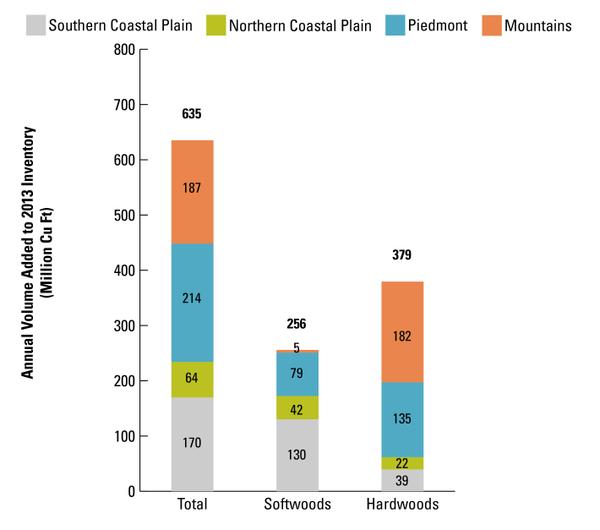
Figure 6. 2013 FIA timber volume (million cu ft) added to the current inventory (growth – removals) for softwoods and hardwoods by physiographic regions; state total at top.
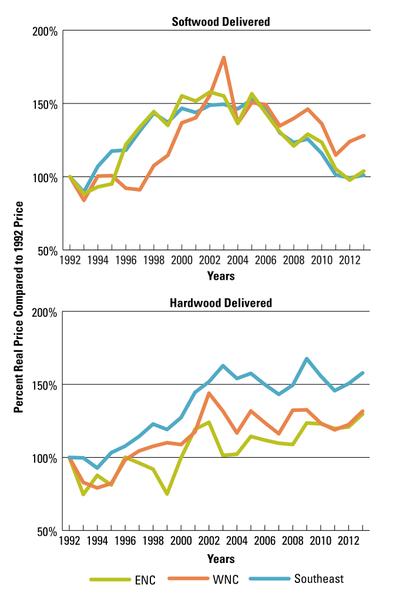
Figure 7. 1992-2013 delivered sawtimber prices, indexed to base year 1992, for eastern NC (ENC), western NC (WNC), and Southeast. Prices provided by Timber Mart South and adjusted using the Producer Price Index for timber products commodities (WPU0085).
North Carolina's Forest Products Industry
In 2013, the state’s forestry and forest products industry consisted of 29 industrial sectors aggregated into two broad areas: land-based production and manufacturing (Table 1). The North American Industry Classification System (NAICS) describes land-based forest sectors as Forestry and Logging and Support Activities for Forestry. Manufacturing is further divided into Wood Products Manufacturing, Paper Manufacturing, and Wood Furniture Manufacturing.
| Industry | IMPLAN Sectors (IMPLAN sector code) |
| Forestry and Logging (NAICS 113) and Support Activities for Forestry (NAICS 115) |
Forestry, forest products, and timber tract production (15); Commercial logging (16); Support activities for forestry (19) |
| Wood Products Manufacturing (NAICS 321) | Sawmills (134); Wood preservation (135); Veneer and plywood manufacturing (136); Engineered wood member and truss manufacturing (137); Reconstituted wood product manufacturing (138); Wood windows and door manufacturing (139); Cut stock, resawing lumber, and planning (140); Other millwork, including flooring (141); Wood container and pallet manufacturing (142); Manufactured home manufacturing (143); Prefabricated wood building manufacturing (144); All other miscellaneous wood product manufacturing (145) |
| Paper Manufacturing (NAICS 322) | Pulp mills (146); Paper mills (147); Paperboard mills (148); Paperboard container manufacturing (149); Paper bag and coated and treated paper manufacturing (150); Stationery product manufacturing (151); Sanitary paper product manufacturing (152); All other converted paper product manufacturing (153) |
| Wood Furniture Manufacturing (NAICS 337) | Wood kitchen cabinet and countertop manufacturing (368); Upholstered household furniture manufacturing (369); Nonupholstered wood household furniture manufacturing (370); Institutional furniture manufacturing (372); Wood office furniture manufacturing (373); Custom architectural woodwork and millwork manufacturing (374) |
Determining Forestry and Forest Products' Economic Contributions
North Carolina’s economic contributions from forestry and forest products manufacturing were estimated using input-output (I-O) analysis. This methodology follows inter-industry transactions, tracking how products manufactured by one sector are used as inputs in another. We used IMpact Analysis for PLANning (IMPLAN) (IMPLAN LLC 2015), which divides the U.S. economy into 536 industrial sectors, to model forest-based contributions. We used 2013 data and reported results in 2013 dollars. Detailed information on the I-O methodology can be found in the Forestry Impacts: Methodology for Determining Forest Sector Contributions to North Carolina's Economy fact sheet (McConnell et al. 2016).
Four measures are used to evaluate economic contributions: Employment is the number of full and part-time jobs. Labor income is the sum of employee compensation (wages and benefits) plus proprietor income. Value added is the sum of labor income, other property type income (corporate profits, capital consumption allowance, payments for rent, dividends, royalties, and interest income), and taxes on production and imports, less subsidies (sales and excise taxes, customs duties, property taxes, motor vehicle licenses, and severance taxes). An industry’s value added is its contribution to Gross State Product. Output is the total value of production described as total gross sales. It is the sum of value added plus the cost of the intermediate inputs purchased to produce the product.
Forestry and forest products economic contributions are reported three ways: Direct effects are forest-based industries’ employment, labor income, value added, and output. Indirect effects result when the industry purchases goods and services to meet its demands. This activity results in employment, income, value added, and output for supporting businesses in the forest economy’s supply chain. Induced effects are the changes produced from the purchasing of goods and services by households as a result of changes in employment or production levels. Summing these provides the total effects. Indirect and induced contributions describe the multiplier effects that ripple throughout North Carolina’s economy from forest-based industries.
Taxes include those paid to state and local governments and the federal government. These taxes are generated from labor income, indirect business taxes, employee households, and corporations within the forest products industry. State, local, and federal taxes include dividends, social benefits, indirect business, corporate profits, and personal taxes.
Forestry and Forest Products in North Carolina
More than 1,000 businesses directly contribute to North Carolina’s forest economy. Forest-based industries directly employed 70,300 people who earned $3.8 billion in wages, benefits, and proprietor income. Forest-based activities created $4.96 billion in value added, which contributed 1.06% to gross state product. Industrial output amounted to nearly $18.5 billion in gross sales. Businesses and employees paid a total of $912 million in state, local, and federal taxes (Figure 8).
Multiplier effects from indirect and induced contributions greatly increased the total contributions of North Carolina’s forest-based production and manufacturing (Figure 9). Forestry and forest products activities employed nearly 145,000 people and paid $7.36 billion in labor income. In total, forest-based industries contributed $29.4 billion to the economy, including $10.9 billion in value added. These industries’ value-added contributions were 2.33% of gross state product. Total tax impacts were $2.41 billion, which included $838 million in state and local taxes and $1.57 billion in federal taxes.
- In 2013, every one million dollars of forest industry output produced generated $587,000 in additional economic activity throughout the state.
- Forest industry contributions supported 1,060 jobs in other sectors of North Carolina’s economy for every 1,000 forest-based jobs.
Forestry, Logging, and Supporting Activities5
Because timber takes decades to mature, meeting manufacturers’ continued demand for wood and fiber requires responsible and sustainable forestry practices. Forest management is dictated by landowner goals, the land’s environmental and productive capacities, and the makeup of the region’s forest industrial base. Forest management varies markedly across North Carolina. Pine sites found in eastern North Carolina are more intensively managed while slower grown hardwoods predominate in the western part of the state.
When individual goals and market conditions dictate, commercial logging firms are contracted to harvest timber and chip trees in the field and then deliver the resulting products to mills. Seedlings are purchased from commercial nurseries to regenerate the site. Pest control, fire management, and other stewardship services are contracted during a timber rotation. Non-timber forest products, such as pine straw, also contribute to forest-based income (Figure 10).
Wood Products Manufacturing
North Carolina businesses produce a wide variety of wood products. Larger sawtimber-sized trees are harvested and delivered to sawmills to be converted into lumber. Higher quality logs are sliced or rotary peeled into thin sheets of veneer for producing plywood. Lower quality sawlogs may be minimally processed into ties, pallet cants, and timbers. Smaller logs may also be sold to wood composite mills, where they are first processed into smaller wood pieces and then used to form wood composite panels, such as oriented strand board (OSB).
Softwood products, such as lumber, ties, and utility poles, may then be sold to a treating facility to be pressure-treated with wood preservatives. Hardwood lumber is often the primary raw material for many other secondary manufacturing industries in the state, including furniture, flooring, millwork, and pallets (Figure 11).
The lumber drying process is key to adding value to North Carolina’s wood products. Softwood lumber is dried in large, track-style kilns at the sawmill. Southern hardwood sawmills, however, are generally smaller than softwood mills and often forego the large capital investment that kiln drying requires. Also, specifications for kiln-dried lumber vary based on the secondary products manufactured from hardwood lumber. Therefore, sawmills often sell rough green or air-dried hardwood lumber to concentration yards dedicated to kiln-drying and distribution to secondary sectors. More recently, dry kiln purchases by hardwood sawmills have increased. In some cases, secondary manufacturers dry hardwood lumber themselves to meet their specific needs.
Paper Manufacturing
Pulp and paper facilities purchase large volumes of smaller, pulpwood-sized logs. Primary paper manufacturers harvest cellulose from wood fibers. The cellulose pulp is formed and dried into sheets, which are then further processed into hundreds of secondary paper products. Many facilities conduct multiple manufacturing processes to produce various products. Often, the lignin byproduct is burned to recover energy on-site or sold for use in other industries (Figure 12). Primary pulp and paper manufacturing in the southern United States has recently trended toward a “fluff” pulp used for absorbent products and away from a pulp used for news and other print products.
Wood Furniture Manufacturing
Consumers have long sought high-quality furniture made in North Carolina. Historically, wood furniture manufacturing was a major driver of North Carolina’s economy as a whole. While global market forces have changed the makeup of this sector, it remains the largest direct employer within the state’s forest economy (Figure 13).
Wood furniture manufacturing businesses are considered secondary forest products manufacturers. Although they use metal fasteners and other non-wood products during assembly, wood furniture businesses specialize in making pieces primarily from wood. While wood furniture in North Carolina is primarily manufactured for households and offices, it is also produced for a variety of institutions. Larger corporations often use standard designs. Many companies, however, also customize their products. Nonupholstered wood furniture is fabricated from solid wood pieces that are sometimes overlaid with wood veneer. Upholstered wood furniture may be constructed from either solid wood or wood composite products. Casegoods include products such as cabinets and dressers. Consumer preferences drive design and function as well as species and finish selections.
Exports
North Carolina exports forest products in every sector of the value chain. Exports include both domestic shipments to other states and foreign sales to other countries. North Carolina’s exported forest products, as recorded to the producer, were valued at $13.7 billion in 2013. Exports to other states totaled $12.2 billion while foreign sales summed to $1.47 billion across industries (Figure 14). North Carolina’s paper manufacturing sector is the largest contributor to total forest-based exports.
World demand for the state’s forest products has long positioned North Carolina as a national leader in global exports. In 2013, the port value of North Carolina logs and wood products exports was approximately 15.5% of the total 13-state U.S. southern forest region (Figure 15). North Carolina has led the South in port value of logs and wood products exports since at least 2004.
5 Note the economic contributions of the individual forest-based industries are not additive to obtain forestry and forest products totals. Doing so incorrectly estimates the total contributions due to any interactions occurring between individual industrial sectors.
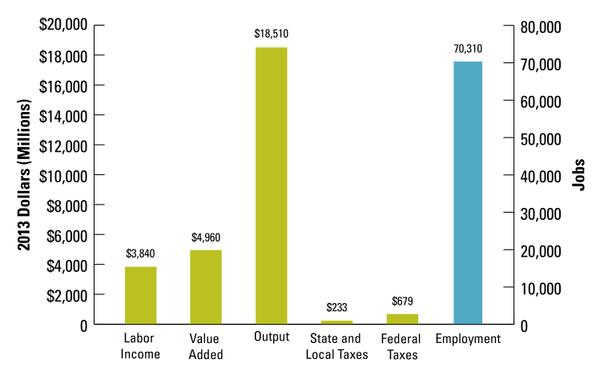
Figure 8. Direct economic contributions of forestry and forest products in North Carolina.
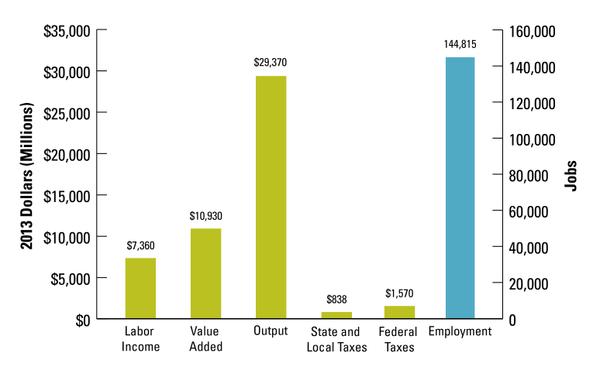
Figure 9. Total economic contributions of forestry and forest products in North Carolina.
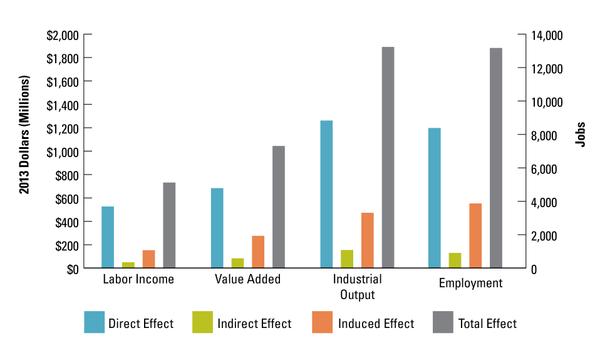
Figure 10. Contributions of forestry, logging, and supporting activities to North Carolina’s economy.
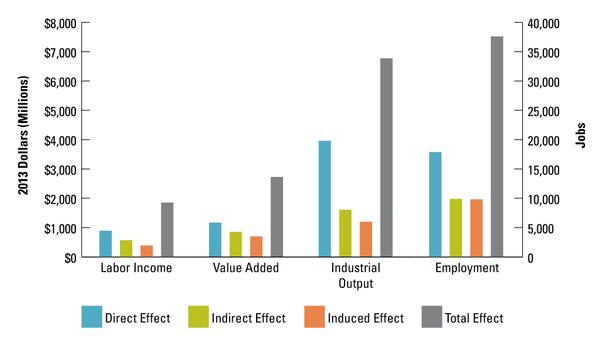
Figure 11. Contributions of wood products manufacturing to North Carolina’s economy.
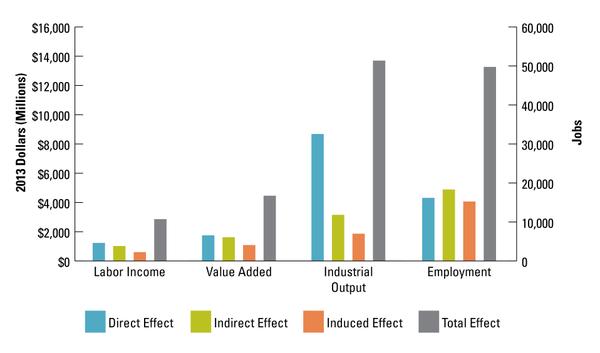
Figure 12. Contributions of paper manufacturing to North Carolina’s economy.
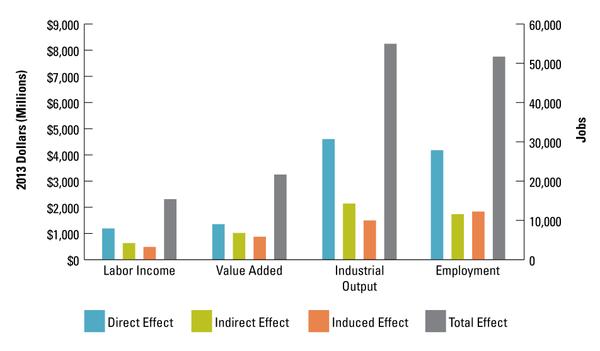
Figure 13. Contributions of wood furniture manufacturing to North Carolina's economy.
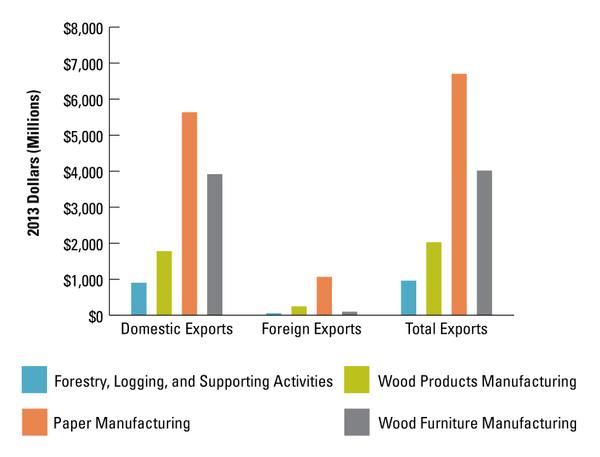
Figure 14. Export-based sales (producer value) of North Carolina’s forest products, 2013.
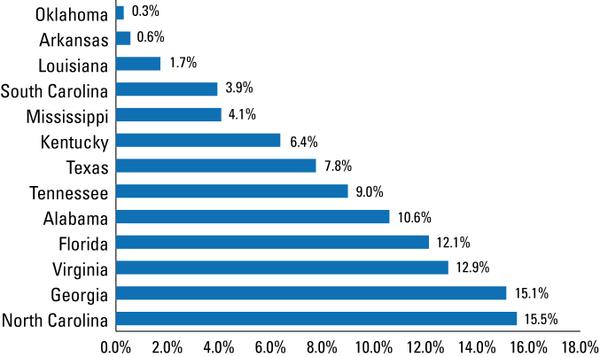
Figure 15. Distribution of logs and wood products foreign exports in the South (port value), 2013. Source: USDA Foreign Agricultural Service.
Expected Market Trends
Along with local factors, such as mill capacity, national and global factors now influence local timber markets. Strength of foreign economies, the value of the US dollar relative to other currencies, and the much-publicized history of US housing starts account for much of the change in stumpage values during the last 10 years. What can we expect in the near-term and beyond?
Sawtimber
US housing starts, although variable month-to-month, have overall been increasing since reaching a low in 2008 to 2009 after the “housing bubble” burst (Figure 16).
Housing starts create demand for framing lumber (southern yellow pine) as well as hardwood flooring and cabinets. U.S. housing starts are expected to slowly increase through 2020 and then level off. In the near-term, China is experiencing its own building “bubble” resulting in reduced import demand. These factors and a strengthening dollar will mean that sawtimber stumpage prices may see only moderate, if any, increases in value the next several years. Hardwood sawtimber markets may experience more fluctuations than softwood.
Pulpwood
A weak dollar and a shift to manufacturing pine-based “fluff” pulp have shaped North Carolina’s pulpwood markets in recent years. A weaker dollar has maintained strong export paper markets. While hardwoods are less used for paper, new large wood pellet plants in northeastern North Carolina are being built to supply fuel to meet European renewable energy policy goals. These plants have begun using low-value hardwood stems. These factors together have improved pine pulpwood stumpage prices over the last five years in the easternhalf of the state, with hardwood pulpwood price gains ocurring in the northeastern part of the state. Although a strengthening US dollar may reduce export demand for paper, heavy use of pine thinnings in recent years—driven by the switch to “fluff” pulp—has reduced softwood pulpwood supply. With several more pellet mills planned for eastern North Carolina, pulpwood prices should continue to increase in that region. Hardwood pulpwood in the east and the pulpwood market in general in the west will be more variable.
Bioenergy
Since 2007, state-based energy policies have generated local markets for use of logging residues for electricity and manufacturing energy production. This has allowed landowners to experience cleaner logging jobs and, in some cases, receive additional revenue. Furthermore, federal policies to promote “advanced” biofuels from cellulose, including wood, are still in place. Reduced natural gas and crude oil prices, however, are making advanced biofuels production less attractive, and cheaper solar technologies are providing an alternative to wood “biomass” for electricity production. Together, these factors suggest that the use of forest-based materials for energy production will not increase in the next two to three years.
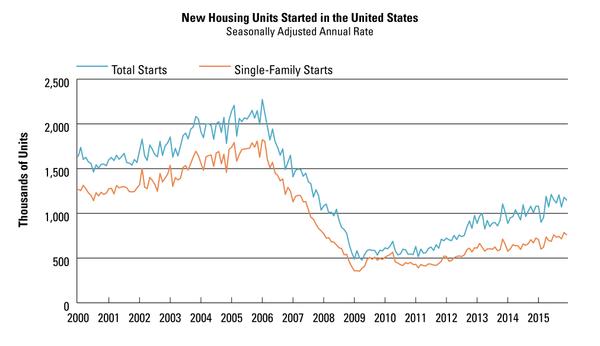
Figure 16. 2000–2015 new housing starts in the United States. Source: USDC Census Bureau (2015).
References
Brown, M.J. and J.T. Vogt. 2015. North Carolina’s Forests, 2013. Resource Bulletin SRS–205. Asheville, NC: US Department of Agriculture Forest Service, Southern Research Station. 91 p. Accessed March 7, 2015.
IMPLAN, LLC. 2015. 2013 IMPLAN Database. Huntersville, NC.
James, N.A., Abt, R.C., Abt, K.L., Sheffield, R.M., Cubbage, F.W. 2012. Forecasting Sustainability: Growth to Removals Ratio Dynamics. In: Morin, R.S., Liknes, G.C., comps. Moving from Status to Trends: Forest Inventory and Analysis (FIA) Symposium 2012; 2012 December 4-6; Baltimore, MD. Gen. Tech. Rep. NRS-P-105. Newtown Square, PA: U.S. Department of Agriculture, Forest Service, Northern Research Station. [CD-ROM]: 54-58.
McConnell, T.E., J. Jeuck, R. Bardon, D. Hazel, C. Altizer, and B. New. 2016. Methodology for Determining Forest Sector Contributions to North Carolina’s Economy. Forestry Impacts Note.
US Department of Agriculture, Foreign Agricultural Service. 2015. Global Agricultural Trade System. Accessed November 9, 2015.
US Department of Commerce, Census Bureau. 2015. New Residential Construction. Accessed November 9, 2015.
See also: Methodology for Determining Forest Sector Contributions to North Carolina's Economy
Publication date: April 19, 2016
AG-817
The use of brand names in this publication does not imply endorsement by NC State University or N.C. A&T State University of the products or services named nor discrimination against similar products or services not mentioned.
N.C. Cooperative Extension prohibits discrimination and harassment regardless of age, color, disability, family and marital status, gender identity, national origin, political beliefs, race, religion, sex (including pregnancy), sexual orientation and veteran status.