Introduction
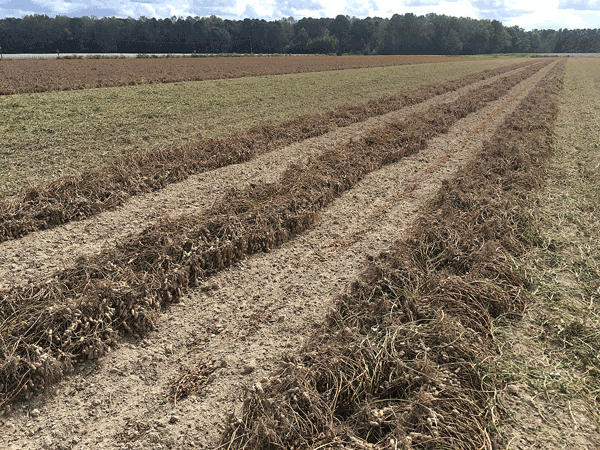
Field equipment size directly impacts the ability of machinery to get a job done in the time available. Poor weather, among other issues, can create conditions that limit field work. This document looks at historical records to estimate how many working days are typically available during peanut planting and harvest windows in North Carolina. The goal is to provide information on available days suitable for field work (DSFW) so that peanut equipment requirements and working acreage can be matched to available time to complete field operations (Figure 1).
DSFW calculations have been used to determine optimal machinery sizing (Griffin et al. 2015; Schrock 1976) and crop allocation (Kastens 1997; Carpenter et al. 2012; Hannah 2001; Rosburg 2017). A list at the end of this document refers to how other states and crops have used DSFW information. DSFW in peanut production has not been specifically analyzed, but efforts have been made to describe and optimize peanut field work. Digging capacity for four- or six-row equipment has been estimated as 30 or 40 acres per day (ac/d), respectively, in ideal conditions. Harvest capacity has been estimated as 15 or 20 ac/d for four- or six-row pull-behind equipment (Jordan et al. 2017). Producers in North Carolina estimated that they spent 15 days digging and 25 days harvesting during the 2017 growing season (Jordan 2018). Updated DSFW values can create a context in which to compare the machine itself to its ability to perform in the larger production system.
Analyzing Historical DSFW
In general, only information for North Carolina is highlighted, but data for all peanut producing states and the analysis used to produce them are available on GitHub.
This analysis used reports to the United States Department of Agriculture (USDA) National Agricultural Statistics Service (NASS) from county extension agents and USDA field staff who report DSFW and crop progress weekly during the growing seasons. Data were collected for 11 peanut producing states between 1995 and 2018, if available. For each year, weekly DSFW were totaled for the weeks when crop progress reports indicated that planting and harvest were most active (between 15% and 85% complete).
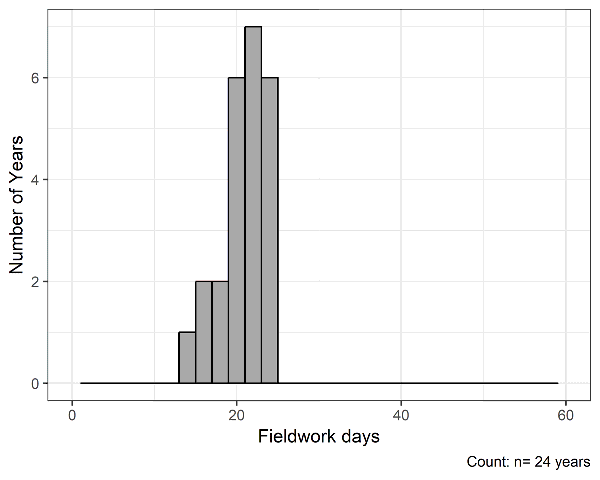
Over 23 years in North Carolina, growers never had more than 25 days to plant (Figure 2). Most frequently, DSFW for planting was 21 to 22 days, which occurred 7 out of the 23 years. The number of years that had similar numbers of working days indicated that the trend over 23 years was generally consistent.
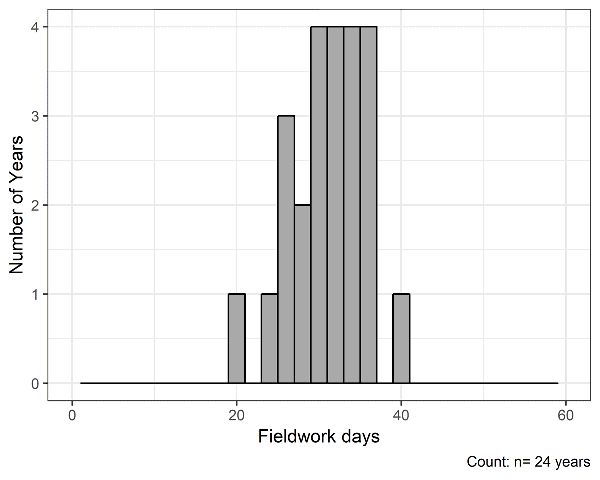
For harvest, North Carolina never had more than 40 working days (Figure 3). Producers typically had 31 to 32 days to conduct field operations. Over the years, the data spread out between 20 and 40 working days, which shows greater variability than planting. The difference is possibly caused by tropical weather, which can impact South Atlantic states during harvest.
Equipment Management
Tables 1 and 2 present minimum, maximum, and specific percentiles of DSFW for planting and harvesting. Using historical records to estimate how many days are available for field work will create some uncertainty, just like the chance of rain in weather reports. Percentiles represent the historic chances of having, at most, the indicated number of working days. The other way to think of the percentiles is as weather risk. If a set of equipment needs the maximum number of available days to complete a field operation, then there is no room for loss of productivity due to poor weather.
The values in Tables 1 and 2 can be compared to calculated equipment capacity or personal experience to determine if the job can be completed in time. See Chapter 7 of NC State Extension’s 2021 Peanut Information for more information on estimating peanut field machinery productivity (Roberson 2021).
| State | Min Planting DSFW | 15th Percentile | 50th Percentile | 85th Percentile | Max Planting DSFW |
|---|---|---|---|---|---|
| Florida | 27.8 | 29.4 | 31.7 | 31.8 | 31.9 |
| Georgia | 22.0 | 24.7 | 28.3 | 30.1 | 32.9 |
| North Carolina | 14.1 | 17.6 | 21.4 | 23.5 | 25.0 |
| South Carolina | 17.6 | 20.5 | 23.5 | 24.4 | 25.3 |
| Virginia | 12.2 | 15.5 | 20.1 | 22.8 | 25.1 |
| State
|
Min Harvest DSFW
|
15th Percentile
|
50th Percentile
|
85th Percentile
|
Max Harvest DSFW
|
|---|---|---|---|---|---|
| Florida
|
30.1
|
30.4
|
30.7
|
31.3
|
32.0
|
| Georgia
|
29.6
|
31.9
|
40.2
|
42.9
|
45.9
|
| North Carolina
|
19.3
|
25.8
|
31.7
|
35.5
|
39.5
|
| South Carolina
|
30.2
|
38.3
|
45.6
|
49.6
|
51.0
|
| Virginia
|
16.2
|
23.4
|
26.0
|
30.4
|
33.6
|
2021 Peanut Information describes the following planting scenario. An eight-row planter at 36-in row spacing moving at 5.0 mph with a 65% field efficiency could plant 9.4 acres per hour or 75.2 acres per eight hours of planting in a day. If 400 acres needed planting, the job would be done in 5.3 days (400 ac divided by 75.2 ac per day). This planter setup for 400 acres is well below the historical minimum number of DSFW—which means that it should always be able to get the job done in time.
Table 3 shows the number of acres per day that would be required from a planter at different field areas. For the minimum DSFW of 14.1 days and a 400-acre field area, a planter would need to cover 28.4 acres per day. The planter in the previous scenario could plant nearly three times as many acres in a day. From a different perspective, a producer who plants 600 acres at typically 28 acres per day has equipment for about the 50th percentile of historical available working days. This assumes completing the planting operations in just over 21 working days.
|
Acres |
Min DSFW |
15th Percentile |
50th Percentile |
85th Percentile |
Max DSFW |
|
100 |
7.1 |
5.7 |
4.7 |
4.3 |
4.0 |
|
200 |
14.2 |
11.4 |
9.3 |
8.5 |
8.0 |
|
300 |
21.3 |
17.0 |
14.0 |
12.8 |
12.0 |
|
400 |
28.4 |
22.7 |
18.7 |
17.0 |
16.0 |
|
500 |
35.5 |
28.4 |
23.4 |
21.3 |
20.0 |
|
600 |
42.6 |
34.1 |
28.0 |
25.5 |
24.0 |
|
700 |
49.6 |
39.8 |
32.7 |
29.8 |
28.0 |
|
800 |
56.7 |
45.5 |
37.4 |
34.0 |
32.0 |
|
900 |
63.8 |
51.1 |
42.1 |
38.3 |
36.0 |
|
1,000 |
70.9 |
56.8 |
46.7 |
42.6 |
40.0 |
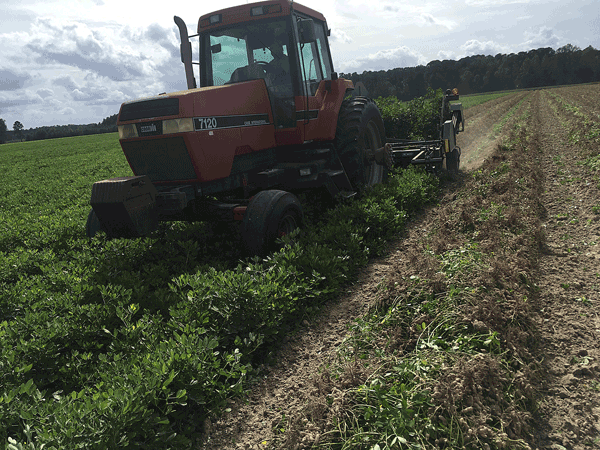
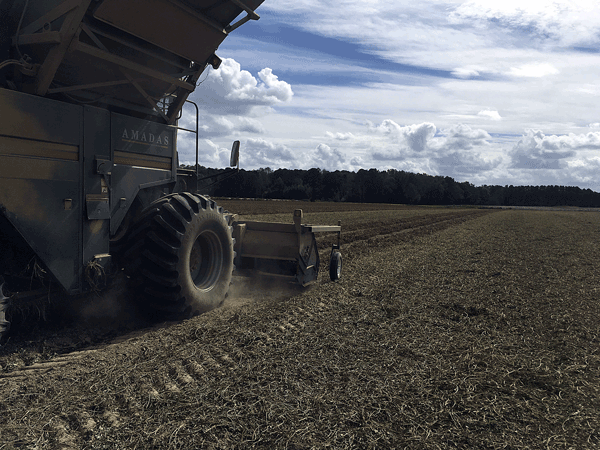
Peanut harvest involves multiple field passes, is less straightforward to estimate than planting, and is the most limiting field activity. Digging (Figure 4) and combining (Figure 5) can occur at the same time as field drying (Figure 6), so estimating the total time spent across all harvest field operations is not as simple as adding the days spent digging and the days spent combining. No matter how each day is spent, a producer who needs a total of 40 days for all harvest field work has used all of the historically available work days, which places harvest returns at risk in many years. Harvest date decisions require producers to decide between expected weight gain in immature pods and yield loss from shedding mature pods (Williams and Drexler 1981). Equipment complements should include capacity to harvest as close to optimum as possible, so increased harvest capacity may often be justified.
Equipment Management Example Scenarios
Consider a harvest scenario, for example, which is a best-case representation. Once fieldwork begins with digging the first field, there is no work stoppage. All fields are windrowed for five days, and once the combine starts it does not stop until harvest is complete. Windrows do not need additional management. This example also ignores any time for travel between fields and assumes fields in different scenarios are worked in the same order. Using previously cited values for typical equipment assumes that a six-row digger can work 40 ac/day, a four-row pull-behind combine can work 15 ac/day, and a six-row pull-behind combine can work 20 ac/day. Keep in mind that these are estimates.
Scenario 1 starts with four fields: 100, 85, 40, and 50 acres (total of 275 acres) using a six-row digger and four-row combine. Using the previously described conditions, this scenario would require 27 days for completion of all harvest fieldwork, placing it at just over the 15th harvest DSFW percentile. In most years, there should be no issues completing harvest with this equipment.
In Scenario 2, two additional fields have been added—65 and 80 acres—for a total of 420 acres using the same equipment. Scenario 2 requires 36 days to complete all harvest fieldwork at the 85th percentile. As expected, when harvested area increased, the time needed to complete that harvest increased. This scenario used 36 of the historically 40 available fieldwork days, meaning that there is a strong risk for poor harvest timeliness.
Finally, Scenario 3 considers all 420 acres from Scenario 2 but uses a six-row digger and a six-row combine. Scenario 3 takes 29 days to complete all harvest field work, back below the 50th percentile for harvest fieldwork days. In most years, Scenario 3 should be adequate to complete harvest. Re-sizing harvest equipment reduced risk.
Conclusions
Weather uncertainty impacts decisions farmers must make regarding crops and equipment. Knowledge of available working days, as represented by DSFW percentiles, creates a basis to compare their equipment and land area decisions. Peanut planting in North Carolina has historically comprised 14 to 25 available working days. Harvest, including digging, in-field drying, and combining, has historically comprised between 19 and 40 working days. Avoid sizing land or equipment such that the maximum DSFW for that field operation is required. Sizing operations or equipment for a moderate number of DSFW allows greater flexibility in field operations and in responding to unexpected weather conditions without putting yield or quality at undue risk.
References
Jordan, D.L. 2018. Preliminary Summary of Grower Meeting Survey Peanut Notes No. 15 2018. Raleigh, NC: NC State Extension.
Jordan, D.L., A.T. Hare, G.T. Roberson, B.B. Shew, R.L. Brandenburg, D. Anco, M. Balota, H. Mehl, and S. Taylor. 2018. “Summary of Variables Associated with Application of Plant Protection Products in Peanuts.” Crop Forage Turfgrass Management 4: 180034.
Jordan, D.L., R. Brandenburg, B. Brown, G. Bullen, G. Roberson, and B. Shew. 2021. 2021 Peanut Information. AG-331. Raleigh, NC: NC State Extension.
Roberson, G.T. “Planting, Harvesting, and Curing Peanuts” In 2021 Peanut Information, pp. 141–159. AG-331. Raleigh, NC: NC State Extension, 2021.
Williams, E. and J. Drexler. 1981. “A Non-Destructive Method for Determining Peanut Pod Maturity.” Peanut Science 8, no. 2: 134–141.
Acknowledgments
This publication was based on the article “Working for Peanuts: Acquiring, Analyzing, and Visualizing Publicly Available Data” written by Jason K. Ward, Terry W. Griffin, David L. Jordan, and Gary T. Roberson for the 2020 issue of the Journal of the American Society of Farm Managers and Rural Appraisers (PDF, 7.2 MB). The full article can be found on pages 156 to 170.
Examples of Other Uses for Days Suitable for Fieldwork Analysis
Equipment Sizing
Griffin, T.W., M.J. Buschermohle, and E.M. Barnes. 2015. Planting and Harvesting Capacity in Cotton Production: Estimated from Days Suitable for Fieldwork.
Schrock, M. 1976. Avoiding Machinery Bottlenecks. Bulletin C-563. Manhattan, KS: Kansas State University Cooperative Extension Service.
Crop Allocation
Carpenter, B., S. Gerit, and R. Massey. 2012. Fieldwork Days and Machinery Capacity. Columbia, MA: University of Missouri Extension.
Kastens, T. 1997. Farm Machinery Operation Cost Calculations. Kansas State University and Agricultural Experiment Station and Cooperative Extension Service MF-2244.
Hanna, M. 2016. Estimating the Field Capacity of Farm Machines. Iowa State University Extension. Retrieved from: http://www.extension.iastate.edu/Publications/PM696.pdf
Corn
Irwin, S. and T. Hubbs. 2018. “How Many Days Does It Take to Plant the U.S. Corn Crop?” Farmdoc Daily 8: 70. Department of Agricultural and Consumer Economics. University of Illinois.
Cotton
Bolton, B., J. Penn, F. Cook, and A. Heagler. 1968. Days Suitable for Field Work, Mississippi River Delta Cotton Area. Louisiana. Agricultural Experiment Station, Department of Agricultural Engineering Research Report 384. Baton Rouge, LA: Louisiana State University.
Griffin, T.W. and E.M. Barnes. 2017. “Available Time to Plant and Harvest Cotton across the Cotton Belt.” Journal of Cotton Science 21, no. 1: 8–17.
Other States
Buller, O. 1992. Days Suitable for Field Work in Kansas. KSU AES 103. Manhattan, KS: Kansas State University.
Hannah, M. and W. Edwards. 2014. Fieldwork Days in Iowa. Ag Decision Maker File A3-25. Ames, IA: Iowa State University.
Massey, R. 2007. Days Suitable for Fieldwork in Missouri. Agricultural Electronic Bulletin Board. University of Missouri.
Schnitkey, G. 2010. Working Field Days in Illinois. Farmdoc FEFO 10-11. Department of Agricultural and Consumer Economics, University of Illinois Extension.
Shockley, J. and T. Mark. 2017. Days Suitable for Fieldwork in Kentucky. University of Kentucky College of Agriculture, Food and Environment Cooperative Extension Service AEC-101.
Spurlock, S.R., N.W. Buehring, and D.F. Caillavet. 1995. Days Suitable for Fieldwork in Mississippi. Mississippi Agricultural Experiment Station Bulletin No. 1026. Mississippi State, MS: Mississippi State University.
Williams, J. and R. Llewelyn. 2013. Days Suitable for Field Work in Kansas by Crop Reporting Regions. Manhattan, KS: Kansas State University Extension Department of Agricultural Economics.
Publication date: April 9, 2021
AG-889
N.C. Cooperative Extension prohibits discrimination and harassment regardless of age, color, disability, family and marital status, gender identity, national origin, political beliefs, race, religion, sex (including pregnancy), sexual orientation and veteran status.


