
Introduction
Declining water quality and landscape disruption in rural communities due to more frequent and intense storms and natural hazards are of growing concern. The “FloodWise” research aims to enhance disaster resilience— defined as “the ability of individuals, communities, organizations, and states to adapt to and recover from hazards, shocks, or stresses [from natural disasters] without compromising long-term prospects of development” (DFID 2011)— by enabling farm and forest landowners to improve their land for water retention and storage, thereby reducing flood-related health and safety concerns. Previous FloodWise research identified 10 best nature-based solutions (NBS) for flood mitigation in Eastern North Carolina (Table 1), along with their breakeven implementation costs using cost-share programs (Hovis et al. 2022), and a set of budget tools to estimate the costs and returns for adopting different NBS (Hovis, Cubbage, and Bardon 2022).
In brief, these discounted cash flow formulas provide a means to estimate how profitable an agricultural or forest investment can be. Net present value (NPV) calculates the discounted value of a series of annual or periodic costs and revenues for a fixed time period at a given discount rate (e.g., crops, hay, or livestock). Land expectation value (LEV) calculates the present value for the same set of costs and returns in perpetuity. Annual equivalent income (AEI) calculates the annual discounted income that a series of cash flows will generate. An internal rate of return (IRR) calculates the annual percentage return for an investment that has initial upfront costs and subsequent returns (e.g., tree planting or wetland creation). The greater the calculated NPV, LEV, or AEV at a given discount rate, the better an investment will be. Similarly, the largest IRR would indicate the best investment if it exceeds the known discount rate. The calculations also show how much added payments (i.e., government financial incentives) may be needed at typical cost-share rates of 50% of establishment costs and added variable annual payments for 10 years to achieve a 6% IRR, which gives an NPV equal to zero.
This step-by-step management roadmap guides the planning, implementation, and monitoring of each NBS. Designed for use across the North Carolina Coastal Plain, this roadmap generalizes its steps to accommodate a wide range of landowner circumstances and regions. It also identifies relevant organizations that can assist at various stages of the NBS implementation process.
Source: Hovis et al. 2021
If you are interested in mitigating the impact of flooding, use the decision tree (Figure 1) to identify the NBS that may be best for your land. Begin with the initial question: Is this land crop or pastureland? (Purple Triangle) and follow the yes/no answers to the subsequent question triangles until you reach a dark blue square indicating the most applicable NBS. Once you've identified a potential NBS, assess its suitability by reviewing the associated management steps and capital budgeting results. Detailed information for each NBS is available for the following:
- Cover crops and no-till (NBS 1)
- Hardpan breakup (NBS 2)
- Forests and tree planting: afforestation (NBS 3 & 4)
- Agroforestry (NBS 5)
- Wetland restoration (NBS 6 & 7)
- Natural stream channel restoration (NBS 8)
- Dry dams and berms (NBS 9)
- Land drainage features (NBS 10)
Remember that many NBS are compatible, and implementing more than one solution may be necessary to best address your specific needs. Additional consideration should be given to the applicability of government financial incentives that may be available to implement the NBS at minimal to no cost to the landowner. Landowners should reach out to the Farm Service Agency (FSA) and the Natural Resources Conservation Service (NRCS) for federal programs; the Division of Soil and Water Conservation (DSWC), the NC Department of Agriculture (NCDA), and the NC Forest Service (NCFS) for state-level programs; and county Soil and Water Conservation Districts (SWCDs) and county tax departments for local opportunities.

Decision tree for determining applicable nature-based solutions.
Savannah Jones Moore
Cover crops and no-till
Cover cropping (NBS 1) is a common agricultural practice where a crop is planted in the off-season to avoid bare cropland. Cover crops can be a variety of crops, including legumes and non-legumes such as grasses, radishes, clover, etc. No-till is an agricultural practice where no tillage, or the upturning of soil, is used between crops. These practices can be used in tandem with one another and many other conventional agricultural practices. These practices reduce erosion, increase soil productivity, increase water infiltration, and have many other beneficial ecosystem services.
Management steps:
- Select the cover crop: Select the cover crop that is best suited for your planned cash crop. Consider your goals and plan accordingly.
- Key organizations: N.C. Cooperative Extension, Farm Service Agency, Natural Resources Conservation Service, and Division of Soil and Water Conservation.
- Prepare resources: Purchase desired cover crop seeds, service equipment, and make fertilizer and pesticide plans as needed (Cover Crop Best Management Practices 2020).
- Key organizations: Local agricultural retail and input industries and agricultural supply companies.
- Soil preparation: Prepare soil if necessary. If using no-till, no tillage or plowing needed.
- Planting: Choose planting window according to planting season of cash crop. Plant soon after harvesting of previous crop and 2-3 weeks before rain. Choose planting technique (drilling, no-drill, broadcast) that is best for your seed and needs (Conservation Tillage Systems 2020).
- Monitor: Monitor for pests and diseases. Respond accordingly.
- Termination: Best termination times depend on the cash crop to follow and management systems in a farm. Typically, terminate at least 2 weeks before the planting date of the following crop. The terminator type will also depend on the type of cover crop. A herbicide, such as glyphosate, application is common (Steps to Success 2021).
Cost-benefit analyses for cover cropping with no-till in the NC coastal plain were conducted by Hovis et al. (2022). A detailed budget with costs and revenues was established for two scenarios: (1) Scenario A, soybeans and winter wheat cover crop and no-till, and (2) Scenario B, corn and cool-season pasture cover crop and no-till. Financial metrics used to evaluate the profitability of the NBS investments at a 6% discount rate were determined for each cropping scenario (Table 2). Due to the yearly revenue from the commodities, projected net present values (NPV) per acre were high, being the highest of any NBS (Hovis et al. 2022). Cover cropping with no-till can be a profitable management practice for mitigating flooding on agricultural land without the need for government financial assistance. However, its potential for the stopping or storing of excess water is considered minimal compared to the more land-altering practices like water farming, wetland and stream restoration, and land drainage features like tiling. The calculations show that cover cropping is quite profitable at the 6% discount rate, so government incentives would not be needed for farmers to implement it economically.
Source: Adapted from Hovis et al. 2022.
Hardpan breakup
Hardpan breakup (NBS 2) is the practice of busting compacted hardpan, or impervious, layers to allow for soil water infiltration (Hovis et al. 2021). Underlying soil can become compacted from repeated driving over soil, tillage, or plowing. Compaction reduces soil aeration, soil infiltration, soil microbes, and root growth. Once hardpan layers are broken, the permeability of the land will increase, which will reduce runoff and the pooling of water. Hardpan layers can be avoided with no-till, and the practice is compatible with several other NBS, especially cover cropping.
Management steps:
- Planning: Rent or prepare heavy equipment. A small tractor is needed to pull a chisel plow (subsoiler) attachment. Backhoes can also be used to break the hardpan layer.
- Key organizations: Local equipment rental companies.
- Execution: Chisel plow the impacted land once. Depending on the severity, consider running the plow again or cultivating the land for its next use. It is best not to leave the land bare after running the plow to avoid erosion. Typically, the land will be prepared for a crop to be planted within a few weeks (Brandolino n.d.).
- Maintenance: Proper nutrients and organic matter are needed for soil health. Consider soil tests to determine deficits and apply supplements as needed. Consider using no-till practices and limiting traffic over this land (“Compacted Zone in Soil” n.d.).
- Key organizations: NCDA&CS Soil Testing Laboratory, local agricultural retail and input industries and agricultural supply companies.
Previous FloodWise cost-benefit analyses for hardpan breakup in the NC coastal plain reveal that this NBS is the least costly practice for mitigating flooding. There are no direct revenues from this practice. Financial metrics used to evaluate the profitability of the NBS investments at a 6% discount rate were determined (Table 3). This is the least expensive practice but would require a small government financial incentive to offset the cost of implementation (Table 4). Depending on the severity of the hardpan layer, the potential for flood reduction can differ. However, when compared to other practices, its potential is minimal (Hovis et al. 2022). This is a practice that can be used in association with many other practices and can be a lower-cost first step for flood mitigation.
Source: Adapted from Hovis et al. 2022.
Source: Adapted from Hovis et al. 2022.
Forests and tree planting: afforestation
Nature-based solutions 3 and 4 include (3) the planting of bottomland hardwood or (4) the planting of pine forest species on land that was previously not occupied by forests, also known as afforestation. This is typically seen in converting croplands to forestlands because forests tend to have higher infiltration rates and less runoff than croplands (Abt 2000). Trees and their canopies of leaves reduce flooding by slowing rainfall and runoff. Tree roots absorb a great deal of water from the soil, decreasing soil saturation and contributing to higher soil water infiltration rates, which benefit soil aeration (Othman 2018).
Management steps: (“Creating a Forest” n.d.)
- Planning: Determine your goals, timeline, and budget.
- Site evaluation: Determining the soils, climate, current vegetation, topography, and other considerations is key to selecting the correct trees and planting plan. This site evaluation can be done by the landowner using management guides or a professional.
- Key organizations: NC Cooperative Extension, NC Forest Service, or private forest or timber contractors. The NC Forest Service has a list of Private Forestry Service Providers for each region to consider contacting.
- Planting design: Determine tree spacing or the number of trees per acre according to the site evaluation and tree species. Work with NC Forest Service Forester or consulting forester to create a written plan and map with the planting design and outline for planting.
- Key organizations: The NC Forest Service has a list of consulting foresters for each region to consider contacting
- Select seedlings: Select and obtain seedlings for planting from private and industrial sources or the NC Forest Service. Depending on the tree planting service provider you select, they may select the seedling stock for you.
- Key organizations: NC State Extension Forestry and the NC Forest Service have resources available to inform landowners related to seedling selections for pine and hardwoods.
- Managing the Right Species on the Right Site: Part 1, Site Selection (WON-64-1) (NC State Extension)
- Managing the Right Species on the Right Site: Part 2, Species Selection (WON-64-2) (NC State Extension)
- Planting Loblolly Pine? Choose Seedling Genetics That Can Weather the Winter (NC State Extension)
- Riparian & Wetland Tree Planting Pocket Guide for North Carolina (NC Forest Service)
- Key organizations: NC State Extension Forestry and the NC Forest Service have resources available to inform landowners related to seedling selections for pine and hardwoods.
- Site preparation: Site preparation is essential to successful tree establishment. Site preparation is performed to reduce competition from undesired vegetation and can include herbicides, mechanical treatments such as discing and/or subsoiling, and/or prescribed burning.
- Key organizations: NC State Extension Forestry provides resources on site preparation methods and contracts. Additionally, the NC Forest Service has a list of consulting foresters for each region to consider contacting.
Local agricultural retail and input industries, agricultural supply companies, equipment rental companies, prescribed burn associations, and other organizations may also be of value.
- Plant trees: Contract with a tree planting service or conduct the planting yourself. Trees can be hand-planted or planted by a machine, depending on the site. For guidance on planting hardwoods and other riparian and wetland species, review the Riparian & Wetland Tree Planting Pocket Guide for North Carolina (NC Forest Service). For steps for successful pine planting, review the reforestation resources from NC State Extension Forestry.
- Maintenance: Within 5-10 years, the forest will be well-established. Controlling competing vegetation and monitoring for insects and disease may be necessary to maintain a healthy forest.
Previous FloodWise cost-benefit analyses established a budget tool with costs and revenues for two scenarios: (1) Scenario A, bottomland hardwood afforestation, and (2) Scenario B, loblolly pine afforestation. Costs were relatively low for both scenarios. Afforestation can also generate revenues from tree harvests for various wood products. However, for hardwood, revenues aren’t possible until at least year 30. For pine species, revenues can be seen in year 12. Pine forest planting can be profitable due to more frequent harvesting and higher timber product market values (Table 5). Hardwood planting is not predicted to be profitable (Table 5), requiring government financial assistance to offset the costs (Table 6). While this NBS requires long-term commitment and patience for additional revenues, its potential for flood reduction is higher than any other agricultural NBS (Hovis et al. 2022). This could be a practical solution for landowners whose cropland is frequently flooded but who still seek financial returns.
Source: Adapted from Hovis et al. 2022.
Source: Adapted from Hovis et al. 2022.
Agroforestry
This NBS 5 is the combination of mixed pine trees and pasture fields. It integrates agriculture and silviculture by growing trees and crops or livestock on the same land. Because this solution incorporates forestry, it achieves better water infiltration rates and lower runoff than traditional croplands or pastures. Croplands and livestock benefit from the trees due to their many ecosystem benefits. These include water quality improvement or increased wildlife and biodiversity. Agroforestry systems can also improve livestock health, with more shade from the sun and shelter in cold weather and can extend the grass growing season for a longer period of time (Hovis et al. 2021, Chizmar et al. 2018a, 2018b).
Management steps:
The management steps for planting trees will be the same as those in the afforestation section above. Below are the steps for establishing and maintaining pastureland.
- Planning: Make a plan according to your goals, budget, and timeline. Following a timeline that aligns with your goals will ensure the best outcomes for your pasture. Rent or prepare equipment for preparation, planting, and maintenance.
- Key organizations: Local equipment rental companies.
- Selecting forage: Select a forage option that is best for your soil, climate, and goals. You can choose to select a seed to broadcast or select a sprig variety to be planted (Mayo, 2020).
- Key organizations: NC Cooperative Extension, NC Soil and Water, local agricultural retail and input industries, agricultural supply companies, and seedling distributors.
- Soil preparation: Spray herbicide or mechanically remove competitive vegetation before planting.
- Planting: Ensure that you plant your forage according to its recommended planting dates for your region and at its recommended rate. Either broadcast the seed with a spreader or use a sprigging machine to plant the sprigs.
- Fertilize: After your forage has been established, take a soil or tissue sample to determine what nutrients are needed for growth and fertilize accordingly.
- Key organizations: NCDA&CS Soil Testing Laboratory, local agricultural retail and input industries and agricultural supply companies.
- Grazing: If not cutting the forage for hay, livestock grazing can happen year-round. Do not allow grazing before the forage is established, which is usually when the forage is 6-12 inches tall. Ensure not to allow overgrazing by rotating livestock throughout the pasture to allow for regeneration. If cutting pasture for hay, stop grazing at the end of winter before ‘green up’ to allow forage to grow (Mayo, 2020).
- Hay: At 12-18 inches tall in spring, cut, tedder dry, rake, and bale (square or round) hay. You can typically cut forage for hay at least three times a year. Fertilize after each cutting.
Previous FloodWise cost-benefit analyses established a budget tool with costs and revenues for six different potential agroforestry scenarios (Hovis et al. 2022). The six scenarios are: (1) Scenario A; loblolly pine forest only, (2) Scenario B; loblolly pine forest with 20% trees, (3) Scenario C; cool-season pasture only, (4) Scenario D; warm-season pasture only, (5) Scenario E; 70% cool-season pasture with 20% trees, and (6) Scenario F; 70% warm-season pasture with 20% trees. The forest scenarios saw slightly lower costs than the pasture scenarios and revenues in years 12, 18, and 25, depending on the timber product. Revenues for pastureland are seen every year, with revenues for warm-season pasture higher than cool-season pasture. Five of the six scenarios were profitable, with Scenario D, warm-season pastureland, being the most profitable (Table 7). Scenario E, cool-season pastureland, is unprofitable at a 6% discount rate and would require a conservation payment to become profitable (Table 8). This NBS is compatible with most other practices and creates many additional ecosystem benefits. It is on the costly side of the agricultural NBS, but can be a profitable FloodWise solution for a landowner with livestock.
Source: Adapted from Hovis et al. 2022.
Source: Adapted from Hovis et al. 2022.
Wetland restoration
Nature-based solutions 6 and 7 are the restoration of (6) natural wetlands in or along waterways with the use of grasses, sedges, and water control or (7) bottomland hardwood wetland banks (Hovis et al. 2021). Restoring a wetland from a currently converted or degraded state to its original condition increases its ability to act as a natural sponge to soak and store flood waters (“Wetlands” 2006). Additionally, restoring vegetation in a wetland can decrease stream velocity and increase water infiltration with their roots (USDA 2011).
Management steps:
These steps will largely depend on the state of the wetland and the type of restoration that is needed.
- Planning: Before determining the type of wetland restoration needed, determine your goals, budget, and tentative timeline.
- Apply for permit: Any disturbance of a wetland (including restoration) requires a permit under federal law. Before any effort is made, it is important to determine which type of permit is needed. You should also familiarize yourself with the standards for wetland management. To determine the permit needed, its requirements, and how to get started, work with one of the key organizations below to create a plan that applies to your unique circumstances (“I Have a Wetland” 2018).
- Key organizations: NC Division of Mitigation Services, United States Army Corps of Engineers, NC DEQ Division of Water Resources, and NC Division of Coastal Management. NC Division of Water Resources NC Wetlands website provides a list of land conservation groups and organizations responsible.
- Site evaluation: Determining the current state of the wetlands’ degradation, soils, current vegetation, topography, and other considerations is required before making management decisions. Note: This may be needed before submitting a permit application.
- Key organizations: NC Division of Mitigation Services, Natural Resources Conservation Service, Carolina Wetlands Association, and the NC DEQ Division of Water Resources. NC Division of Water Resources NC Wetlands website provides a list of land conservation groups and organizations responsible.
- Resources: Depending on the restoration determined, you may need heavy equipment; various establishment instruments such as matting, dams, stone, and pumps; seeding; planting; etc. Contracting a land conservation group or contractor may be best for large restoration projects.
- Key organizations: NC Division of Water Resources NC Wetlands website provides a list of land conservation groups and organizations responsible.
- Earthwork: Various earthwork may be necessary, including the construction of backfill ditches and berms; bank enhancement or smoothing; excavation to restore natural topography; reconnection of stream, channel, and floodplain; placement of new soil; etc. This will require heavy equipment such as a backhoe or excavator (Lev 2009).
- Water control: Structures to restore the wetland's hydrology may include the construction of risers, spillways, or other necessary structures and/or the repair or removal of culverts or drainage tile. This will also require heavy equipment (Lev 2009).
- Vegetation: Control weeds, remove invasive plants, and plant native trees and herbaceous vegetation. This can be done manually with physical labor, mechanically with heavy equipment, or chemically with herbicides (Lev 2009).
- Maintenance: Many contractors will monitor the wetland for a period after restoration is complete. It is important to monitor and maintain the wetland after restoration to ensure the minimization of complications. Maintenance after this may include the removal of invasive vegetation, mowing, replanting, etc (Hogan 2018).
Previous FloodWise researchers conducted a cost-benefit analysis for wetland restoration under two scenarios: (1) Scenario A (NBS 6); a flood control wetland with grasses and sedges, and (2) Scenario B (NBS 7); a forested bank on a prior converted farmland wetland. The budget tool with costs and revenues for both scenarios. The cost-benefit analysis determined costs for Scenario A were the highest of all NBS and nearly eight times higher than Scenario B, which was the second highest costing NBS (Hovis et al. 2022). NBS 6 involves a large amount of earthwork for the development of berms and retention basins to collect and store water. The most likely revenue source from wetlands would be annual hunting leases (Hovis et al. 2022). Both scenarios are unprofitable at a 6% discount rate, requiring conservation payments to become profitable (Tables 9 and 10). While the costs, complexity, and time required are high for wetland restoration, the flood reduction potential is very high (Hovis et al. 2021). This would be a solution for landowners experiencing major flooding due to deteriorated or converted wetlands.
Source: Adapted from Hovis et al. 2022.
Source: Adapted from Hovis et al. 2022.
Natural stream channel restoration
Natural stream channel restoration (NBS 8) is the restoration of previously straightened streams to a natural configuration (Hovis et al. 2021). Streams naturally have a meandering pattern, which slows water velocity. So, straightened streams are a large contributor to rapid flooding downstream (Doll et al. 2003). The stream restoration approach highlighted in NBS 8 is the natural channel design (NCD), where the stream is reshaped, reconnected to its floodplain, and improved with the installation of riffles, pools, vegetative, and various structures (Doll et al. 2003). A damaged stream can be a major factor in the consistent worsening flooding of land areas downstream.
Management steps:
These steps will largely depend on the state of the stream and the type of restoration that is needed.
-
Planning: Before determining the details of your stream restoration, determine your goals, budget, and tentative timeline.
- Apply for permit: Any disturbance of a stream (including restoration) requires a permit or exemption under federal law. Before any effort is made, it is important to determine which type of permit is needed. You should also familiarize yourself with the water management standards. To determine the permit needed, its requirements, and how to get started, work with one of the key organizations below to create a plan that applies to your unique circumstances (“I Have a Wetland” 2018).
- Key organizations: NC Division of Mitigation Services, United States Army Corps of Engineers, NC DEQ Division of Water Resources, and NC Division of Coastal Management. NC Division of Water Resources NC Wetlands website provides a list of land conservation groups and organizations responsible.
- Site evaluation: A survey of current conditions is an important preliminary step. Included in this survey should be a watershed drainage area measurement, land-use survey, backfill identification, pattern measurement, channel dimensions, longitudinal profile, and more. Part of this survey can be done independently, but expert assistance is likely required for more in-depth measurement. This will help classify your stream and restoration types needed (Doll et al. 2003). It can also help you determine potential causes of the stream degradation and potential added steps for restoration (i.e., degradation caused by beaver dams).
- Key organizations: Local land surveyor or environmental service organization. This guide from NC State University is a helpful tool: Stream Restoration: A Natural Channel Design Handbook
- Design: A well-designed stream plan before construction is key. Using data from the site evaluation, the dimensions, patterns, and profiles will be designed (Doll et al. 2003). This involves in-depth calculations and is often designed by an environmental contractor.
- Key organizations: Local environmental service organizations.
- Preparation: Initial construction will include clearing of current vegetation and sediment deposits. Grading is used to create the new meandering pattern, adding slopes, riffles, and pools. This will require heavy equipment such as bulldozers or graders (Hovis et al. 2022). Contractors can be hired to complete this stage of the project.
- Diversion: After the clearing and grading needed to reshape the stream, diversion of the water to follow the new pattern is needed. This will likely include pumping the water to its final destination to allow for the new pattern to be developed.
- Structures: Needed in-stream structures will vary depending on the level and type of restoration at hand. This will often include rocks, logs, and brush to help ensure stable width and depths, channel capacity, fish passage, etc (Doll et al. 2003). Other structures may include culverts and fencing.
- Vegetation: Vegetation is key for healthy streams. Restoration will include invasive species control and the planting and seeding of riparian buffers and in-stream vegetation (Hovis et al. 2022).
- Maintenance: Monitoring and maintenance are needed to ensure the stream is properly responding to the restoration. Reseeding or weed control are common maintenance steps seen in years 0-7 (Hovis et al. 2022).
Stream restoration is a timely and costly solution to flooding. Previous FloodWise cost-benefit analyses established a budget tool with costs of stream restoration per linear foot, which were some of the highest costs of all NBS. There are no revenues associated with stream restoration. Stream restoration NBS is unprofitable at a 6% discount rate (Table 11) and would require government incentives to offset (Table 12) (Hovis et al. 2022). For the high costs of this solution, the potential for flood reduction is moderate (Hovis et al. 2021). However, if a stream is a clear contributor to flooding, it is an obvious solution to consider.
Table 11: Financial metrics used to evaluate the profitability of stream restoration scenario – net present value (NPV), land expectation value (LEV), annual equivalent income (AEI) – at 6% discount rate – adjusted to 2025 USD using U.S. Bureau of Labor Statistics Consumer Price Index (CPI).
|
Scenario |
NPV ($/acre) |
LEV ($/acre) |
AEI ($/acre) |
|
Stream Restoration |
-$1,678 |
-$2,032 |
-$121 |
Source: Adapted from Hovis et al. 2022.
Table 12: Establishment payments and annual payments for ten years required to achieve a 6% yearly rate of return, equal to a zero NPV at a 6% discount rate – adjusted to 2025 USD using U.S. Bureau of Labor Statistics Consumer Price Index (CPI).
|
Scenario |
Establishment Payment at 100% of Initial Costs ($/linear ft) |
Annual Payment for 10 years Required to Achieve a 6% IRR ($/linear ft) |
Total Payments per Practice ($/linear ft) |
|
Stream Restoration |
$149.57 |
$157.54 |
$1,736.22 |
Source: Adapted from Hovis et al. 2022.
Dry dams and berms
Also known as water farming, this NBS (NBS 9) is the construction of dams and berms to retain and store runoff during extreme storm events (Figure 2). Berms are raised barriers of soil to divert and store water. Dry dams hold water during flooding or high rain events and slowly allow the water to drain in a controlled manner. If the dry dams and berms are implemented correctly to catch and store large amounts of runoff and are properly maintained to remove sediments that tend to build up, they can greatly reduce the amount of water and velocity of water that floods downstream areas (Hovis et al. 2021).
Management steps:
- Planning: It is important to align the construction of berms and dry dams to your goals, budget, and timeline. This should be the first step of any flood mitigation practice.
- Site evaluation: Before designing your water farm, consider the topography, soil, vegetation, and other features of your land. Water farms should not be built on steep slopes. In sandy soils, berms may need to be thicker. These site evaluations can be done individually following simple outlines for water farming (Castaldo n.d.).
- Calculating size: Determine the ideal size of the basin and use those dimensions to calculate the water-holding capacity of the feature. It is suggested to make the base of the berm about four times as thick as the height of the berm (measured from the bottom of the basin to top of the berm) (Castaldo n.d.).
- Building: Use heavy machinery such as bulldozers or backhoes to pile up soil to the dimensions decided in the calculation step. You may need to rent or service this machinery before using.
- Key organizations: Local equipment rental companies.
- Compaction: Berms should be compacted to stop water, while the basins should remain porous to allow water to infiltrate and seep through the soil. Rocks can help slow water to avoid channels developing and damaging berms (Castaldo n.d.).
- Spillways: Spillways are low points in the berm to direct extreme excess water in a controlled manner. These should be indented about one-third from the top of the berm and twice as wide as the height of the berm. Point these spillways to locations that can withstand excess water. These can be stabilized with rock and vegetation (Castaldo n.d.).
- Vegetation: Plant native grasses or herbaceous vegetation to reduce erosion of the earthwork. Riparian buffers can also be planted above the water farm.
- Maintenance: Remove sedimentation that tends to build up in heavy precipitation, reinforce spillways, reseed vegetation, rebuild any berms that are damaged, and continue to monitor the water farm after each heavy rain event.
Previous FloodWise cost-benefit analyses established a budget tool with costs and revenues for water farming (Hovis et al. 2022). This is the third most costly NBS analyzed by previous FloodWise researchers. Analysis indicates input costs were high due to the earthwork and structure involved with the installation of dams and berms. No revenues are generated with this NBS, resulting in relatively large deficits and high establishment payments that would require government financial assistance (Tables 13 and 14) (Hovis et al. 2022). While inputs are high for this NBS, the potential for flood reduction is also high (Hovis et al. 2021). This solution is an effective tool for mitigating severe flooding.
Source: Adapted from Hovis et al. 2022.
Table 14: Establishment payments and annual payments for ten years required to achieve a 6% yearly rate of return, equal to a zero NPV at a 6% discount rate – adjusted to 2025 USD using U.S. Bureau of Labor Statistics Consumer Price Index (CPI).
|
Scenario |
Establishment Payment at 100% of Initial Costs ($/acre) |
Annual Payment for 10 years Required to Achieve a 6% IRR ($/acre) |
Total Payments per Practice ($/acre) |
|
Water Farming Scenario A |
$4,056.18 |
$133.23 |
$5,388.46 |
Source: Adapted from Hovis et al. 2022.
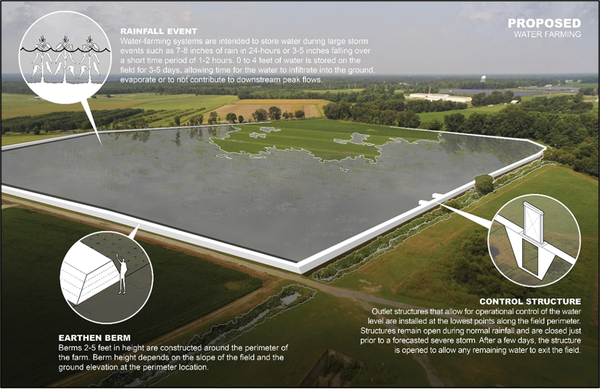
Rendering of water farming.
NCSU Coastal Dynamics Design Lab 2020
Land drainage features
The last NBS, land drainage features (NBS 10), involves the installation of land drainage controls to manage runoff (Figure 3). Surface and subsurface drainage can be used with tiling and terraces for controlled water retention. These installations remove or divert the excess water from the soil’s surface to a waterway or built terrace (Hovis et al. 2021). This drainage moves water to a more suitable location and increases water infiltration rates by reducing the amount of water held currently by the soil. These drainage features are commonly used in agriculture, making them typically more understood by landowners. They are also considered less complicated and expensive (Ghane 2018).
Management steps: These steps are specific to tiling.
- Planning: Not all locations are suitable for tiling systems. It is important to determine the budget, timeline, and goals associated with this management, and if it is suitable for your land.
- Site evaluation: The type of tiling, depth, spacing, outlet, pipe size, and other factors are dependent on the soil type, crop type, and slope of your land. It is important to accurately determine the features of your land to choose the best tools for your installation (Panuska n.d.). This can be done independently or by a contractor.
- Key organizations: Local environmental services organizations, NCDA Agronomic Services, Transforming Drainage
- Design: Determine the suitable depth, spacing, laterals, outlet, pipe size, etc, according to findings in your site evaluation. There are many tools available for farmers to help a landowner determine what’s best for their circumstances (Panuska n.d.).
- Key organizations: Transforming Drainage, Natural Resources Conservation Service
- Equipment: Rent or service necessary equipment, which typically includes a backhoe, tile plow, and trencher.
- Key organizations: Local equipment rental companies.
- Survey: It is typically recommended to hire a contractor to place the drainage systems. If doing this independently, flag or map out on the land the dimensions determined above before doing any earthwork to minimize mistakes.
- Installation: If doing without a contractor, dig trenches to place the tiling in, properly connect tiles, and ready terrace for water storage. If using more advanced pumps or tools, install them as well (Panuska n.d.).
- Maintenance: Tiles can “blow” or get clogged. Monitor for sinkholes, wet spots, or slowed water output. Can unclog manually or with chemicals. If tiles are cracked, it is important to replace them in a timely manner (Panuska n.d.).
Previous FloodWise cost-benefit analyses established a budget tool with costs and revenues for simple drainage features, specifically tiling systems (Hovis et al. 2022). Analysis indicates input costs are less expensive than other types of earthwork but are more costly than the agricultural NBS. There are no revenues associated with this NBS, therefore, government assistance programs would be required to offset the costs (Tables 15 and 16) (Hovis et al. 2022). The costs are the lowest of the restoration or structural practices, but the potential for flood reduction is like that of stream restoration (Hovis et al. 2021). This is an effective solution, especially for farmers, that moves water to a more suitable storage location.
Source: Adapted from Hovis et al. 2022.
Source: Adapted from Hovis et al. 2022.
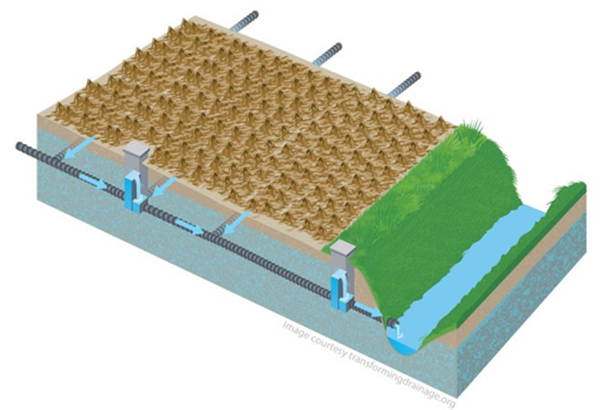
Rendering of tile outlets and terraces for land drainage systems.
Transforming Drainage 2015.
Discussion and Conclusion
Previous FloodWise research revealed that the agricultural nature-based solutions (NBS) were the most profitable practices with revenues from commodities and lower implementation costs (Table 17). However, these practices have a lower potential for flood reduction. The practices with the highest potential for flood reduction were wetland restoration and water farming (dry dams and berms). Yet, these practices were also the costliest. Most of these practices are compatible with the others and offer additional benefits for an ecosystem besides flood mitigation (Hovis et al. 2021). A landowner must examine their goals, budget, timeline, and available opportunities to determine which solution might be best for their circumstances.
Source: Hovis et al. 2021
The economic analyses and methods shown here were adapted from Hovis et al. (2022) at a given 6% real discount rate. This method of discounted cash flow analysis allows landowners to consider the time value of money and compare the returns for their FloodWise or other management practices with other investment returns. We show returns for relevant input costs and prices, discounted to the initial investment year at a 6% discount rate. Farm and forest landowners, government agencies, or consultants can use these methods to calculate other investment returns for the same farm conservation practices at a different discount rate, or to calculate the investment returns for other farm practices and input costs and returns.
They can also use these analyses to calculate the necessary cost share establishment costs and farm payments to break even at different discount rates or for other management practices. If the analyses show that NPV, LEV, or AEV are negative, then either some payments or a reduced discount rate will be required to meet the farmers’ alternative rate of return. If those metrics are positive, landowners are earning their desired rate of return, plus receiving the computed extra annual income above 6% or another selected discount rate. Similarly, if the IRR exceeds 6%, the investments shown here would be considered acceptable, and higher IRRs are better.
A landowner having trouble determining how best to increase their flood resiliency can refer to the FloodWise decision tree (Figure 1) to find the NBS most applicable to them and use this analysis of management steps as a guide for implementation. Landowners can also use these FloodWise Budget Tools to more accurately determine the cost of implementation of each solution according to their circumstances. Additional resources informing each practice’s management steps can be found in the References section below, in order of appearance.
References
Disaster Resilience
DFID. 2011. Defining Disaster Resilience: A DFID Approach Paper. Department for International Development [accessed 2023 Nov 20]. ↲
FloodWise Research
Hovis M, Cubbage F, and Bardon R. 2022. FloodWise Flood Mitigation and Reduction Practices Budget Tools. NC State Extension, Raleigh, NC. ↲
Hovis M, Cubbage F, Hollinger JC, Shear T, Doll B, Kurki-Fox JJ, Line D, Lovejoy M, Evans B, Potter T. 2022. Determining the costs, revenues, and cost-share payments for the “floodwise” program: Nature-based solutions to mitigate flooding in eastern, rural North Carolina. Nature- Based Solutions [accessed 2023 Sep 28]; 2:100016. ↲
Hovis M, Hollinger JC, Cubbage F, Shear T, Doll B, Kukri-Fox JJ, Line D, Fox A, Baldwin M, Klondike T, et al. 2021. Natural infrastructure practices as potential flood storage and reduction for farms and rural communities in the North Carolina Coastal Plain. Sustainability [accessed 2023 Sep 28]; 13:9309. ↲
Cover Crops and No-Till
Cover Crop Best Management Practices. Modesto, CA: Almond Board of California. [accessed 2024 Aug 9]. ↲
Conservation Tillage Systems in the Southeast. Sustainable Agriculture Research & Education. [accessed 2024 Aug 10]. ↲
Steps to success with cover crops. 2021 Aug 26. Iowa Soybean Association; [accessed 2024 Apr 10]. ↲
Hardpan Breakup
Brandolino M. n.d. Get rid of hard pan soil for better row crop yields. The North American Farmer; [accessed 2024 Apr 16]. ↲
Compacted Zone in Soil. In: Soil Tech Notes. USDA. ↲
Forests and Tree Planting: Afforestation
Abt R, Schaberg R, Hess G. 2000. Forest Resource Trends and Projections for North Carolina. Southern Center for Sustainable Forests [accessed 2024 Apr 16]. ↲
Othman S. 2018 May 30. Drop Drop, How do Trees Make Flooding Stop? Arbor Day Foundation; [accessed 2024 Apr 17]. ↲
Creating a forest: A step-by-step guide to planting & maintaining trees. n.d. Madison (WI): Wisconsin DNR. [accessed 2024 Apr 17]. ↲
N.C. Forest Service - Private Forestry Service Providers. 2025 Jan 11. NC Department of Agriculture & Consumer Services; [accessed 2025 Mar 1]. ↲
N.C. Forest Service - Consulting Foresters. 2025 Jan 9. NC Department of Agriculture & Consumer Services; [accessed 2025 Mar 1]. ↲
N.C. Forest Service - Tree Nurseries. 2025 Jan 9. NC Department of Agriculture & Consumer Services; [accessed 2025 Mar 1]. ↲
Boone J. 2024 Apr 5. Managing the Right Species on the Right Site: Part 1, Site Selection. NC State Extension; [accessed 2024 Aug 1]. ↲
Boone J. 2024 Aug 13. Managing the Right Species on the Right Site: Part 2, Species Selection. NC State Extension; [accessed 2024 Aug 1]. ↲
Walker T. 2025 Feb 26. Planting Loblolly Pine? Choose Seedling Genetics That Can Weather the Winter. NC State Extension; [accessed 2025 Mar 4]. ↲
Riparian & Wetland Tree Planting Pocket Guide For North Carolina. NC Forest Service. [accessed 2025 May 12]. ↲
Boone J, Hamilton R. 2019 Mar 15. Site Preparation Methods and Contracts. NC State Extension; [accessed 2024 Jan 18]. ↲
Bardon R. 2025 Mar 1. Reforestation. NC State Extension Forestry; [accessed 2025 Mar 1]. ↲
Agroforestry
Mayo D. 2020 Feb 21. 7 steps to successful pasture establishment. UF IFAS Extension; [accessed 2024 Apr 17]. ↲
Wetland Restoration
Wetlands: Protecting Life and Property from Flooding. 2006 May 1. EPA; [accessed 2024 Apr 22]. ↲
USDA Natural Resources Conservation Service. Description, Propagation and Establishment of Wetland-Riparian 2011, Grass and Grass-Like Species in the Intermountain West. TN
Plant Materials No.38. [accessed 2024 Apr 22] ↲
I Have a Wetland, Now What? NC Division of Water Resources. 2018-2025. North Carolina Wetlands Information. https://www.ncwetlands.org. Published by the North Carolina Division of Water Resources, Water Sciences Section. [accessed 2024 Apr 22]. ↲
Lev E. Common Wetland Rehabilitation Techniques, 2009. Oregon Explorer; [accessed 2024 Apr 22]. ↲
Hogan D. 2018 Jul 24. 4 Essential Steps of Wetland Restoration. Brennan; [accessed 2024 Apr 22]. ↲
Natural Stream Channel Restoration
Doll B.A., Grabow G.L., Hall K.R., Halley J., Harman W.A., Jennings G.D., Wise D.E. Stream Restoration: A Natural Channel Design Handbook; North Carolina Stream Restoration Institute, North Carolina State University: Raleigh, NC, USA, 2003. [accessed 2024 Apr 24]. ↲
I Have a Wetland, Now What? NC Wetlands; 2018. [accessed 2024 Apr 22]. ↲
Dry Dams and Berms
Castaldo G. Rainwater Harvesting: Berms and Swales. Santa Cruz Permaculture; [accessed 2024 Apr 24]. ↲
Land Drainage Features
Ghane E. Agricultural Drainage. Michigan State University Extension Bulletin E3370. 2018. [accessed 2024 Apr 24]. ↲
Panuska J. n.d. The basics of agricultural tile drainage. Basic Engineering Principles 2. UW Extension. [accessed 2024 Apr 24]. ↲
Publication date: June 6, 2025
N.C. Cooperative Extension prohibits discrimination and harassment regardless of age, color, disability, family and marital status, gender identity, national origin, political beliefs, race, religion, sex (including pregnancy), sexual orientation and veteran status.