
Coastal agricultural lands in the US Southeast, including North Carolina, face a growing threat of salt accumulation and salinization driven by natural events such as storm surges, high tides, hurricanes, and wind. These factors result in saltwater intrusion into soil profiles, forming water-soluble salts that negatively impact land productivity and have significant implications for irrigation water sources. The dynamic interaction between storm surges, high tides, and hurricane-induced winds leads to the inland movement of salts, particularly sodium chloride (NaCl, common table salt), potentially causing challenges such as reduced crop yields, tree and crop mortality, and overall land degradation.
Hurricane-induced high tides frequently flood low-lying farm fields in coastal North Carolina, impacting soil fertility by raising levels of toxic soluble salts, particularly sodium (Na) and chloride (Cl), to potentially toxic levels. While fertile soils contain low or nontoxic levels of sodium along with other soluble salts (including potassium, calcium, magnesium, sulfate, and chloride), the saltwater influx from multiple sources, including ocean spray, tidal surges, and shallow groundwater intrusion, can significantly increase sodium levels in soil. The severity of sodium accumulation and toxicity depends on factors such as proximity to the ocean; site elevation and hydrology; drainage network; rainfall amount, intensity, and timing; and soil properties. Sufficient rainfall prior to saltwater influx minimizes sodium infiltration, while significant post-storm rainfall dilutes and flushes salt from soils, reducing sodium accumulation. Maximum sodium accumulation occurs when soils are relatively dry prior to saltwater influx because more sodium will directly contact soil particles.
In fall 2018, we measured water-soluble salt levels in drainage canals and tidal streams in agricultural areas near the North Carolina coast, finding from 4 to 16 parts per thousand (ppt) in an area of Hyde County, and from 1 to 3 ppt in an area of Pasquotank County with less direct seawater influence. As a comparison, seawater is typically 32 to 36 ppt water-soluble salt. Compared with irrigation water salinity guidelines, waters in both areas contained salt levels that might be problematic (Irrigation Water Quality Problems, NC State Extension, AG-759). During the sampling period in fall 2018, water from shallow groundwater monitoring wells in a Hyde County field had salinity levels of 4.4 ppt at a depth of 4 feet and 8.3 ppt at a depth of 7 feet. The crop had failed in that portion of the field. In a section of the field where the crop was doing well, the salinity was 5.2 ppt at a depth of 4 feet and 5.4 ppt at a depth of 9 feet. As this was immediately after Hurricane Florence, it is unknown what the salinity concentrations were when the soybeans were first planted and during early growth.
Soil Testing for Soluble Salts
Soluble salts can have dramatic impacts on crops (Figure 1). Soil testing can be used to assess substantial accumulation of soluble salts (soluble salts index, SS-I), including sodium, in agricultural soils. To acquire soluble salts levels and a problem diagnosis, submit soil samples to the Soil Testing Laboratory of the NC Department of Agriculture & Consumer Services’ Agronomic Services Division. Be sure to use the Diagnostic Soil Sample Information chapter for soluble salts analysis. For routine soil samples, the Soil Testing Lab reports only sodium levels, not SS-I. A limited number of diagnostic samples can be submitted without approval from the lab; verify with the lab if submitting more than 10 diagnostic samples. Collect soil samples for salt analysis as follows:
- Select different soil types and fields that represent a range of concerns. Fine-textured soil may be of greatest concern because downward water movement is more limited than in coarsely textured soils.
- Sample at different depth increments to evaluate the distribution of salt (preferably at 0 to 2 inches, 2 to 4 inches, 4 to 8 inches, and 8 to 12 inches; or at a minimum, split a 12-inch core into the upper 6 inches and the bottom 6 inches).
You may also find it useful to evaluate salt levels by planting seeds in a small area of the field and monitoring growth. Alternatively, plant seeds in pots filled with the affected soil in a greenhouse for faster evaluation. If seeds germinate and initial growth is not affected, concerns may be minimal.
Table 1 presents soil test data from salt-affected and “normal” areas of a field in Hyde County, North Carolina, shown in Figure 1. When reviewing Table 1, it is important to know that background sodium levels in most North Carolina agricultural soils are around 0.1 meq/100 cm3, with an exchangeable sodium percentage (ESP) of 5 percent or less. This field is partly salt-damaged and partly normal and the numbers in Table 1 are from those two distinct conditions. Although sodium levels were elevated, the overall salt level did not damage the plants.
Figure 2 shows the relationship between SS-I and soil test sodium concentration from 910 total data points collected by Dr. David Hardy of the North Carolina Department of Agriculture and Consumer Services. Data collected from fields inundated with saltwater show a strong relationship between soluble salts and sodium levels. Thus, the sodium value on routine reports can be used as an indicator of soluble salt levels. Typically, soils in agricultural fields in eastern North Carolina at the end of the growing season will have SS-I of 20 or less, with sodium levels around 0.1 meq per 100 cm3 soil as mentioned above. It is important to remember that the SS-I is also influenced by other fertilizer salts, not just by sodium. For example, high salt levels are often seen after high rates of nitrogen application. Generally, salt damage may be expected to occur on emerging seedlings and young plants growing in soils with an SS-I of about 50; however, this depends greatly on the crop sensitivity and growth stage, soil type, soil texture, and moisture status of the soil.
Several factors can affect plant stress tolerance to salt damage besides salt concentration. Plants vary in their tolerance to salts. You can find information on relative differences in crop tolerances in Chapter 4—Plant Response and Crop Selection for Saline and Alkali Soils, page 65, in Diagnosis and Improvement of Saline and Alkali Soils Handbook (Allison et al. 1954). Seedlings and young transplants are generally more sensitive than mature plants to salts. Soil type and soil moisture also impact potential salt damage. Salt stress will be more likely in sandy, low organic soils, especially under dry conditions, primarily due to limited water holding capacity, poor nutrient retention, and limited microbial activity. Over time, salts will persist longer in finer textured soils because water infiltration is slower and leaching is less likely.
Soils with elevated sodium level present multiple challenges beyond salt damage. When significantly altered, the balance with other cations (calcium, magnesium, and potassium) can also be affected, creating additional fertility concerns. When the ESP of the cation exchange capacity (CEC) is 15 percent or more, sodium can adversely impact soil structure, especially of clays, limiting infiltration and giving rise to drainage or crusting issues.
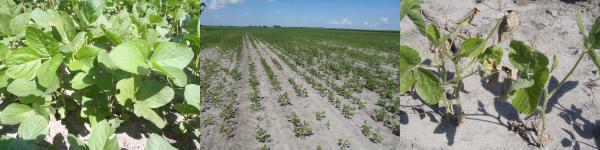
Figure 1. Soybean growth in a salt water-impacted field in Hyde County, N.C. (center); with areas of normal growth (left photo) and damaged plants (right photo).
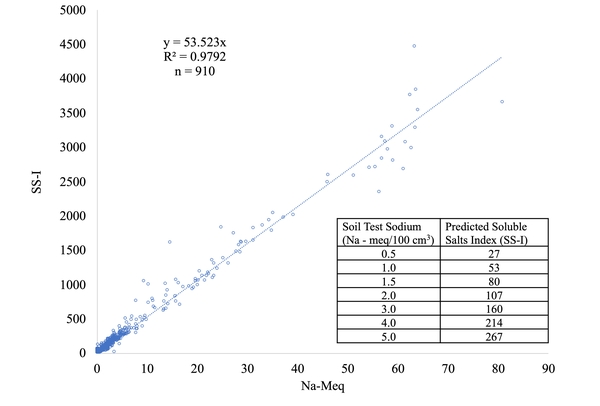
Figure 2. Soluble salts index as predicted by soil test sodium concentrations. Based on this relationship: SS-I = 53.523 (sodium), R² = 0.9798, n = 910.
Data compiled by David H. Hardy, NCDA&CS, Agronomic Division, 2024.
Remediation
Coastal land managers and farmers in the US Southeast can implement diverse management practices to combat salt accumulation. Employing adaptive cropping system management practices, such as adjusting planting schedules and irrigation strategies based on salt levels, contributes to resilience. Water control structures, such as tide gates and levees, regulate saltwater intrusion. Leaching with freshwater and efficient drainage systems collectively mitigate salt impact.
North Carolina climate, topography, and soil type provide both opportunities to develop methods for remediating salt-affected fields and challenges related to having low elevation, a high water table, and sodium influx from storms or groundwater, as seen in Pasquotank County. A potential method for remediating fields high in sodium is to displace the sodium cation with calcium, usually by applying calcium sulfate or gypsum. Because gypsum is a salt, leaching rainfall or irrigation after its application is required for benefit. The amount of gypsum needed for sodium displacement is shown in Table 2. In practice, this technique has only limited success in coastal North Carolina because it is often difficult to flush the dissolved gypsum through the soil profile in a manner that leaches the sodium. Flushing is impeded because soils are relatively fine-textured, the elevation is low, and the water table is high. High water table may limit deep percolation and availability of sufficient fresh water for irrigation. This problem is further exacerbated if additional sodium is introduced during periodic storms or via groundwater intrusion. This was observed in a Pasquotank County field where 9,000 pounds per acre of gypsum were applied over three years. The top 6 inches of soil still had an SS-I of 350 and an ESP of 36 (Crozier, C. personal communication).
Management practices that encourage rainfall infiltration, such as conservation tillage, facilitate better water penetration; residue management aids in retaining moisture and preventing excessive salt accumulation. Vegetated fallow periods not only promote soil structure but also minimize the risk of saltwater intrusion. For more severely impacted fields where economical yields of current agricultural crops cannot be maintained, changes in land use practices may be required.
References
Oster, J. D., and H. Fenkel. 1980. “The Chemistry of the Reclamation of Sodic Soils with Gypsum and Lime.” Soil Science Society Proceedings 44:41–45.
Publication date: Aug. 5, 2024
AG-439-87
N.C. Cooperative Extension prohibits discrimination and harassment regardless of age, color, disability, family and marital status, gender identity, national origin, political beliefs, race, religion, sex (including pregnancy), sexual orientation and veteran status.