
Introduction
Measuring the productivity, availability, and consumption of forages is critical to understanding the interactions of plants and animals in grazing systems. These factors are closely related to the stocking rate and allowance of forage — the relationship between forage and livestock characteristics per unit of land area — and have significant influence on the conversion of pasture to animal products.
Compared to clipping trials, measuring forage characteristics in grazing systems introduces new variables and factors that need to be considered. These factors are related to animal behavior (non-uniform grazing, fouling, trampling, and temperament) and to the effect of defoliation by animal species with different feeding habits such as browsing versus grazing. This publication describes four techniques that can be used to quantify the herbage of grazed swards.
Background and Rationale
The most accurate method for estimating forage mass is clipping the forage. Clipping can be costly in terms of time and labor because the areas to be grazed by cattle are generally large. The challenge is sampling sufficient locations to account for the variations present in the pasture without removing large quantities of forage.
Four forage sampling techniques are presented in this article. These include a direct sampling technique that uses hand-clipping and three double-sampling techniques. The doubling-sampling techniques are canopy height, use of a disk meter (falling or rising), and comparative yields with eye estimates. Dry matter concentration is also discussed because it provides the basis of comparison of forage productivity and the balance of animal rations.
Dry Matter Concentration and Dry Matter Production
Dry matter concentration and dry matter production are different. The concentration of dry matter is a measurement influenced by the amount of water in the plant tissue and expressed as a percentage (%). Moisture concentration in fresh forage can range between 75% to 85% and can be very easily influenced by environmental conditions. Comparisons of productivity, nutrient concentration, and other plant responses are expressed on a dry matter basis after removing the water.
\({\text{% dry matter (% DM)}} = \frac{\text{dry weight}}{\text{wet weight}} \times 100 \)
Knowing the moisture concentration is also critically important for forage conservation (hay and silage production) and for ration calculations. Specific details on forage conservation techniques are provided in NC State Extension publications AG-803 for hay and AG-812 for haylage and silage. Moisture concentration is calculated as:
\( \% \text{ moisture} = 100 - \% \text{ DM} \)
or
\( \% \text{ moisture} = \frac{\text{wet weight} - \text{dry weight}}{\text{wet weight}} \times 100 \)
The most used methods to estimate dry matter concentration include the use of forced-air dryers or a microwave oven. With forced-air dryers, the forage is left to dry at 140°F (60°C) until a constant weight is reached, which can be about two days for fescue or bermudagrass and longer for corn or sorghum. Forced-air dryers are a reliable method although they can be costly and time consuming. As an alternative, a microwave oven or a Koster moisture tester (smaller forced-air dryer) can provide faster estimates for on-farm decisions.
Dry matter production is calculated with the amount of dry forage harvested and the area from which the forage was collected. Dry matter production is reported in terms of lb/acre, ton/acre, and/or megagram per hectare (Mg/ha). Other terms that refer to dry matter production include herbage mass, herbage production, forage production, and forage mass or forage harvested.
\(\text{DM production (lb/acre)} = \frac{\% \text{ DM } \times \text{ fresh forage harvested}}{\text{area}} \)
Techniques to Estimate Forage Mass
One of the challenges that is common to all forage mass estimation methods is knowing the number of samples that are needed to accurately estimate the amount of forage in the paddock. In general, the more uniform the pasture, the fewer samples are required to appropriately characterize the variation of the pasture. For example, if the forage in a pasture is uniform, it is best to take at least 3, or the recommended 5 to 10 samples per acre. If the pasture is less uniform, you should consider taking more samples. The reality is that pastures are rarely uniform.
Direct Sampling by Hand-Clipping
Hand clipping is a direct sampling procedure that involves removal of the clipped forage from the field. This is the most accurate way to determine the amount of forage in an specific area. Although this method can be time consuming, especially in larger areas, all other indirect methods, such as double sampling or remote sensing, need to be calibrated and tested against direct sampling.
The sampling process involves:
- Defining the area to clip. Quadrats or circles that cover an area of 0.25 to 1 m2 are commonly used (Figure 1).
- Clipping the forage to the target post-grazing stubble height (Table 1). Maintaining a sward at an adequate stubble height will prevent weed infestation and ensure persistence of the desired species. Persistence of forage species is dependent, to a great extent, on the utilization regime that is used. This refers to how close to the soil surface and how often the forage is grazed (grazing intensity and frequency). With a mixture of several species in a pasture, you can consider defining the post-graze stubble height in favor of the more desirable species present. The botanical composition of pastures is a dynamic system and over time, changes in composition of the sward can be expected as a function of managing the grazing activity.
Table 1. Recommended post-graze stubble height to ensure persistence of selected forage species and prevent weed infestation when using rotational stocking. Adapted from Castillo (2022), AG-939.
Forages Target post-graze stubble height Alfalfa 3 to 4 in. Bermudagrass, bluegrass, bahiagrass, clovers 2 to 3 in. Fescue, orchardgrass, prairegrass, dallisgrass 3 to 4 in. Gamagrass, switchgrass, big bluestem, indiangrass 5 to 6 in.
- Collecting the clipped forage, drying it, and determining dry matter production from each sampled quadrat. The average of the quadrats provides an estimate of the amount of forage available to be grazed by cattle.
Double-Sampling Techniques
Pasture height, comparative yield, and disk meter measurements can be used to estimate forage mass. Accuracy of the estimates, however, is dependent on calibration with a direct method such as hand-clippings. The accuracy of the estimation is only as good as the calibration.
Calibration of double-sampling techniques
The calibration process is critical for obtaining accurate estimates of forage mass. Obtaining acceptable calibrations allows many measurements to be made in a relatively short period from extensive areas. This helps to account for the variation present in the pasture within paddocks. Each calibration is useful for a given set of conditions that should consider, among other factors, the type of species (mixed pasture or monoculture) and the time of the year (seasonality). When considering the specific conditions in your operation, you may want to develop separate calibrations for your summer and cool-season perennial forages, monoculture, and mixed pastures.
The steps in the calibration process are:
- Determining the area where the forage mass will be estimated on a given day. For example, you may estimate forage mass from a 1-acre paddock, or from five 1-acre paddocks where cattle will be allocated in the following day or days.
- Identifying at least 3 calibration sites, or the recommended 5 to 10, with a range of areas from the least to greatest forage production. You can select from sparse spots in your pasture (least) to very dense areas with abundant forage (greatest). The goal is to characterize the range of conditions in your pasture.
- Taking an indirect measurement from each calibration site with either height measurement with a ruler, falling or rising disk meter height, or a visual estimate.
- Clipping each calibration site to the target post-graze stubble height (see Table 1), weighing the clipped forage, and determining the dry matter production.
- Developing a regression equation that estimates forage mass by plotting on the X-axis the indirect measurement versus dry matter from the hand-clippings on the Y-axis (Figure 2). Desired values are closer to 1, but values ≥ 0.75 can be considered acceptable. A computer program such as Excel can help to quickly develop the calibration curve.
- After the calibration equation has been developed, you can continue to take indirect measurements by using a ruler or disk meter in the pasture. Average the heights for each paddock and plot the value in the equation to obtain estimates of the forage mass for a given paddock.
Canopy height
Measurements can be made with a ruler from the soil level to the surface height of the undisturbed sward or to the extended height of tillers or leaves. One of the main advantages of using the canopy height technique is the ability to take large number of measurements in a short period of time. One of the disadvantages is that this approach does not consider the density of the pasture (Figure 3). Thus, there can be a progressive overestimation of forage mass with increasing height because the greater proportion of the herbage tends to be concentrated in the lower layers of the canopy, especially with warm season forages.
Disk meter
The disk can be weighted (weighted disk meter) or made of a relatively lightweight material such as aluminum or plastic. The area can vary, but in general ranges from 0.25 to 1m.2 The disk includes a vertical graduated rod. The process involves lifting the disk to a constant height on the rod, placing the rod on the ground, and dropping the disk (Figure 4). The height to which the disk settles is then recorded. The readings are influenced by a combination of both canopy height and density. The disk meter is best used with leafy or soft-stemmed species because large or rigid stems interfere with the movement of the disk and result in a poor relationship between the forage harvested and disk settling height.
Comparative forage mass method (eye estimates)
Begin by selecting either 5 or 10 reference quadrats that constitute the yield scale against which the yield of sample quadrats are to be rated. Select two quadrats (1 and 5) that represent the least and greatest yielding areas so that the forage mass is rarely outside this range, and one quadrat is in between (medium). Another option is to do a 9-standard scale. You can select standards in between these ranges (Table 2). The standards should be selected by consultation with all observers, and preferably will be centrally located for reference. The procedure requires a training time (at least 30 minutes) for the observers to learn the standards and make continuous references to them to ensure consistency. After collecting the data, the values are calibrated by harvesting the standard quadrats and developing a prediction equation similar to the disk meter procedure.
Factors that Affect Choice of Indirect Method
Type of species
Canopies with many stems or those with erect, stiff stubbles are generally not very well suited to the use of the disk meter. The disk can fail to characterize the growing vegetation by stopping on a height determined by an old dry stem. However, canopies such as tall fescue, orchardgrass, ryegrass, bahiagrass, and relatively immature bermudagrass can be well characterized.
Shape, size, and number of sampling units and sampling height
The area to be clipped can take the form of a quadrat, circle, or a rectangle. It is important to be consistent and decide on sampling the forage that is inside (rooted) versus outside the sampling area. The size of a sampling unit generally covers an area of 0.25 to 0.5 m.2
The number of sampling units is critical and must not be based on the size of the paddock. Instead, the number should be based on the variation in the pasture. The less uniform the pasture, the more sampling units are needed to be able to adequately characterize the amount of forage available in the pasture. The sampling height for obtaining the hand-clippings and the calibration standards should be based on the goals of the producer. Generally, it is easier to sample to the soil surface because it is easier to maintain a reference height. Sampling to soil-surface, however, can impose stress on the pasture. Sampling to the height of the recommended post-graze stubble height will ensure adequate calculation of the available forage to be grazed by cattle, and will prevent overgrazing and pasture deterioration.
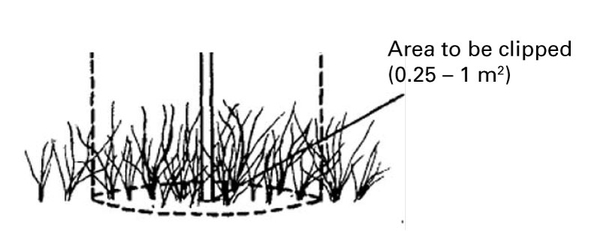
Figure 1. Schematic of a defined area to be clipped. Only rooted plants within the frame should be clipped.
Source: Bransby et al. (1977).
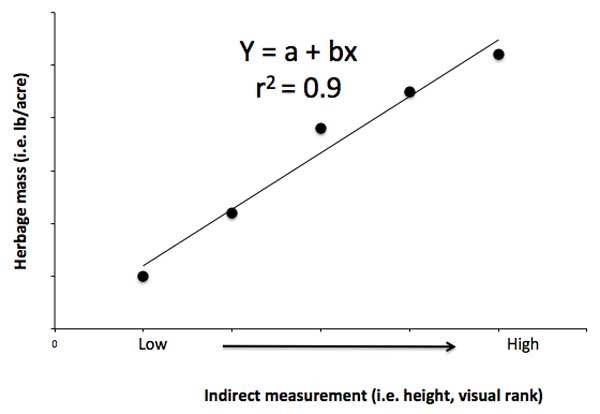
Figure 2. Calibration equation to estimate forage mass. Y = herbage mass (lb/acre). This value comes from the hand-clippings. a = intercept of the equation with the X-axis. b = slope of the equation. x = values of your indirect measurements. r2 = measurement to assess the goodness of fit of the equation.
Source: Author
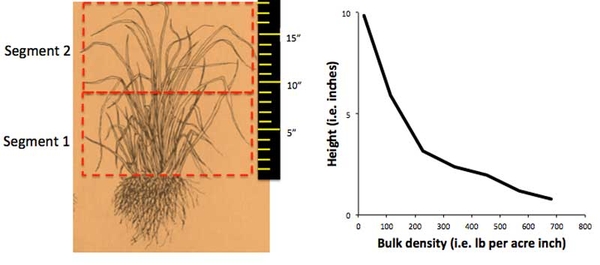
Figure 3. Note the difference in amount of forage mass per segment. Every cubic inch at a given canopy height differs in the amount of forage mass. This relationship is species specific.
Source: Author
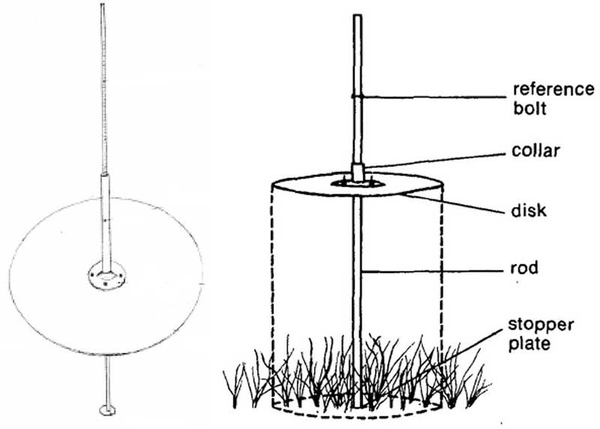
Figure 4. Schematic of the disk meter.
Source: Bransby et al. (1977).
Summary and Conclusion
Four techniques were discussed to estimate forage mass in grazed swards. Hand-clipping is the most accurate and direct sampling technique, although it can be time consuming, especially when estimating forage mass from large areas. Indirect techniques to estimate forage mass require calibration against a direct technique to ensure accuracy. Well-calibrated, double-sampling techniques (canopy height, disk meter, and eye estimates) allow accurate estimation of forage mass from a larger pasture area over a relatively shorter time as compared to hand-clippings.
Continuous sampling of pastures (paddocks) can help producers make decisions during the grazing season. Forages grow on a daily basis and respond to environmental conditions (weather, soil fertility) and management approaches such as frequency and intensity of defoliation. It is difficult to provide a specific recipe for a sampling schedule. However, since goals and limitations are different for every producer, frequent sampling (recommended weekly, or at least twice per month) can help identify trends in forage production. Such information will help the producer adjust management approaches (such as allocating animals to a given paddock for a certain number of days) accordingly. In addition, consistent record keeping helps to identify differences in productivity from various paddocks and provides a basis for specific amendments for the least productive areas.
Ultimately, the objective of these techniques is to eventually train the producers to quickly make reasonable estimates of herbage mass. This will result in proper allocation of forage to the animal group and meeting both the nutritional requirements and animal production goals.
References
Bransby, David I., Arthur G. Matches, and Gary G. Krause. 1977. “Disk Meter for Rapid Estimation of Herbage Yield in Grazing Trials.” Agronomy Journal 69, no. 3: 393–396.
Castillo, Miguel S. 2022. Pasture Grazing Heights for Rotational Stocking. AG-939. Raleigh, NC: NC State Extension.
Hodgson, John G. 1990. Grazing Management: Science into Practice. Harlow, Essex, UK: Longman Scientific & Technical.
Romero, Juan J., Miguel S. Castillo, and Joe C. Burns. 2015. Forage Conservation Techniques: Silage and Haylage Production. AG-812. Raleigh, NC: NC State Extension.
Romero, Juan J., Miguel S. Castillo, Joe C. Burns, Paul Mueller, and Jim Green. 2015. Forage Conservation Techniques: Hay Production. AG-803. Raleigh, NC: NC State Extension.
References for Further Reading
Brink, Geoffrey E., Michael D. Casler, and Mary Beth Hall. 2007. “Canopy Structure and Neutral Detergent Fiber Differences among Temperature Perennial Grasses.” Crop Science 47: 2182-2189.
Haydock, K.P., and N.H. Shaw. 1975. “The Comparative Yield Method for Estimating Dry Matter Yield of Pasture.” Australian Journal of Experimental Agriculture and Animal Husbandry 15, no.76: 663-670.
Sanderson, Matt A., C. Allen. Rotz, Stanley W. Fultz, and Edward B. Rayburn. 2001. “Estimating Forage Mass with a Commercial Capacitance Meter, Rising Plate Meter, and Pasture Ruler.” Agronomy Journal 93, no.6: 1281-1286.
Santillan, R.A., William R. Ocumpaugh, and Gerald O. Mott. 1979. “Estimating Forage Yield with a Disk Meter.” Agronomy Journal 71, no. 1: 71-74.
Wilm, H.G., David F. Costello, and Graydon E. Klipple. 1944. “Estimating Forage Yield by The Double-Sampling Method.” Agronomy Journal 36, no. 3:194-203.
Publication date: March 25, 2024
AG-961
N.C. Cooperative Extension prohibits discrimination and harassment regardless of age, color, disability, family and marital status, gender identity, national origin, political beliefs, race, religion, sex (including pregnancy), sexual orientation and veteran status.