
Prevent runoff to surface waters and groundwater pollution by inspecting and calibrating any irrigation system used for animal wastewater application. Regular field measurement and calibration ensure uniform waste applications that produce good crop growth and protect water resources.
Application systems used to apply animal waste to land should meet acceptable application uniformity guidelines to make sure they provide good agronomic performance and minimize environmental impact. Application uniformity tends to decline with an irrigation system’s age for various reasons. Often, the decline can be attributed to pump and sprinkler wear. Pump impellers may wear, resulting in lower pump pressure. Sprinkler nozzles wear over time due to sediment in the wastewater. Also, struvite and other salts may crystallize and precipitate in the main lines, resulting in increased head loss and lower sprinkler operating pressure.
In liquid manure land application systems, poor application uniformity has many disadvantages. If liquid manure is overapplied to crops, the extra liquid manure will either run off and pollute surface water or percolate below the crop root zone and pollute the groundwater. If liquid manure is underapplied, crop growth may decline, resulting in poor quality cover crops and decreased yield. Therefore, field measurement and calibration of land application systems are necessary and should be performed periodically.
According to North Carolina state rules that went into effect September 1, 1996, land application equipment used on livestock production farms must be field calibrated or evaluated in accordance with existing design charts and tables. Technical specialists certifying waste management plans after September 1, 1996, must also certify that operators have been provided calibration and adjustment guidance for all land application equipment. These rules apply to irrigation systems in addition to all other types of liquid, slurry, or solid application equipment.
One aspect of land application equipment calibration is the assessment of uniformity, or how evenly waste is applied to receiving crops. A series of N.C. Cooperative Extension bulletins entitled “Field Calibration Procedures for Animal Wastewater Application Equipment” (in the AG-553 series) describe detailed calibration procedures for typical irrigation equipment used for land applications of animal waste: Evans et al., 1997a (AG-553-1); Evans et al., 1997b (AG553-2); Evans et al., 1997c (AG 553-3). These publications give instructions for field determination of the uniformity coefficient (UC), more commonly referred to as the coefficient of uniformity (CU), and provide ranges of good and acceptable values of UC for land application of animal waste.
More recent guidance provided by the North Carolina 1217 Interagency Group (2007) established calibration requirements that comprised measurement of both a system’s flow rate and “wetted diameter,” and its uniformity as detailed in Evans et al. (1997a, AG-553-1; 1997b, AG-553-2; 1997c, AG-553-2). As set forth in the eighth edition of the SB 1217 guidance document, flow rate and wetted diameter were to be measured every year for facilities with National Pollutant Discharge Elimination System (NPDES) general permits and every other year for facilities with statewide general permits. Under the eighth edition guidelines, field determination of uniformity was to be done every three years regardless of permit type.
Many factors can affect a sprinkler’s water distribution and a system’s application uniformity, including sprinkler model, nozzle type (such as taper bore, taper ring, and ring in gun-type sprinklers), nozzle size, nozzle pressure, sprinkler or lane spacing, and wind. Recently conducted research at NC State University evaluated the correlation of these variables to CU in stationary and traveling systems (Liu, 2009). Liu found that if sprinkler spacing (or lane spacing for travelers) was within design specifications and pressure was within the ranges provided in a manufacturer’s charts, then application uniformity would normally be in an acceptable range as set forth in Evans et al. (1997a; 1997b). Generally, if sprinkler spacing is 50 to 70 percent of the field-measured wetted diameter for stationary systems and 60 to 85 percent of the field-measured wetted diameter for traveling systems, uniformity will be acceptable. See the “Irrigated Acreage Determination Procedures for Wastewater Application Equipment” publications (Evans et al., 1999a; Evans et al., 1999b) for more details on acceptable sprinkler and lane spacing.
Here we explain calibration procedures for stationery and hard-hose traveler irrigation systems and how to determine acceptable application uniformity for the systems as established by the ninth and latest edition of the SB 1217 document (North Carolina 1217 Interagency Group, 2009). It does not invalidate the procedures (commonly referred to as the “catch can” method) described in AG-553-1 and AG-553-2 if operators want to use those for uniformity assessment. However, AG 553-1 and AG 553-2 do not fulfill the flow measurement calibration requirements currently established by the ninth edition of the SB 1217 document.
General Guidelines
You will need a manufacturer’s chart for your system’s sprinkler and nozzle combination and also information contained in the irrigation system design documentation (NRCS, 2009, Appendix B) or the wettable acreage determination (worksheets in AG 553-6 or AG 553-7). Manufacturer charts are used to compare field-measured wetted diameter to expected wetted diameter (from a chart) and may also be used to estimate flow rate. Charts can be obtained from the sprinkler company’s website. An example of a chart for a “gun-type” sprinkler is shown in Figure 1.
Irrigation system design documentation should have been submitted in the approval process for the animal wastewater land application system. Operating pressure at the sprinkler can be found in Table 2 or Table 3 of Appendix B of the Natural Resources Conservation Service NC Irrigation Guide (NRCS, 2009), depending upon the type of irrigation system used for land application. Sprinkler flow rate can be found in Table 4 in Appendix B of the same guide. If design documentation is not available, sprinkler flow rate can be obtained by using the pressure and sprinkler information found in the irrigated acreage field data worksheets for stationary (Evans et al., 1999a, pp. 14, 15) and traveling gun irrigation systems (Evans et al., 1999b, p. 14) completed at the time of the irrigated acreage determination for your system. See the section labeled “Measuring and Comparing System Flow Rate” for instructions on obtaining flow rate from sprinkler pressure. Measured sprinkler flow rate will be compared to the flow rate in the design documentation or the irrigated acreage worksheets (see item 3 in the traveling gun system and stationary sprinkler system data sheets at the end of this bulletin).
Calibration of hard-hose traveler and stationary systems involves four steps:
- measuring system operating pressure (at the sprinkler),
- measuring sprinkler wetted diameter,
- measuring system flow rate, and
- comparing the field-obtained measurements in steps 1–3 with manufacturer charts, irrigation design documents, and/or irrigated acreage determination information.
Forms are provided in this bulletin to make it easy to record and document field calibration as well as interpret field-collected data. Uniformity assessment of these systems involves two steps:
-
comparing field-measured wetted diameter and pressure to manufacturer charts, and
-
calculating sprinkler or lane spacing as a percentage of field-measured wetted diameter to determine if spacing falls in the recommended range.
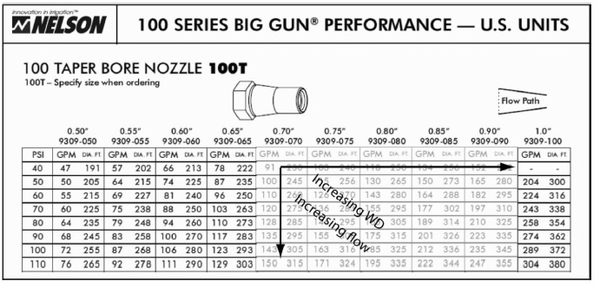
Figure 1. Manufacturer’s chart for a Nelson 100 Tape Bore Nozzle. Note for a given nozzle size, that flow rate (GPM) and wetted diameter (DIA. FT.) increase with increasing nozzle pressure; and for a given nozzle pressure (PSI), flow rate and wetted diameter increase with increasing nozzle size.
Field Procedure
The field procedure consists of four steps: (1) measuring operating pressure, (2) measuring sprinkler wetted diameter and comparing it to the manufacturer’s chart, (3) measuring system flow rate and comparing it to the appropriate documentation, and (4) calculating sprinkler or lane spacing.
Equipment Required
- Pressure gauge (mounted to sprinkler body or riser or connected to pitot tube: see Figure 2 and Figure 3);
- Flow meter with in-line adapters (see Figure 6), if field measured nozzle pressure and manufacturer's charts will not be used to obtain flow rate;
- Measuring tape (200 – 300 ft tape recommended) or measuring wheel; and
- Flags.
Measuring Operating Pressure
Pressure should be recorded only after the system has been fully pressurized and all air expelled from the system. For traveling gun systems, measure operating pressure at the gun operated in the lane farthest from the pump. For stationary systems, take a pressure reading from at least two sprinklers located on two different lateral lines farthest from the pump. Take pressure readings about one-third to one-half the way from the head of the lateral. This is the lateral location where average pressure occurs.
Pressure may be taken in either of two ways: (1) from a gauge mounted on the sprinkler riser or on the gun body (Figure 2a and 2b) or (2) by using a pressure gauge with a pitot tube attached (Figure 2c). If using a mounted gauge, the gauge should not be permanently mounted as fouling and plugging will occur. The same gauge can be used at multiple locations by removing the gauge from the threaded port; if doing this, be sure to replace the plug into the port. An alternative approach is to install a shut-off valve between the sprinkler riser pipe or gun body and pressure gauge and leave the gauge permanently mounted. If using a pitot tube, place the tube directly into the nozzle stream as close to the nozzle as possible and hold steady while noting the pressure. For larger nozzles, it may be necessary to move the pitot tube slightly to center the tube in the stream and to obtain the maximum pressure reading, which is the correct pressure to record (see Figure 2).
Measuring and Comparing Sprinkler Wetted Diameter
Take measurements under no wind to very light wind (less than 5 mph) conditions with the system operating at normal pressure (the pressure recorded in the previous step). Locations of wetted diameter measurement should occur at the same locations as pressure measurement. To compare measured wetted diameter to the manufacturer’s data, obtain a manufacturer’s chart for the specific model, nozzle type (for gun-type sprinklers), and nozzle size of the sprinkler. Charts can be obtained from irrigation dealers or from the sprinkler manufacturer’s website.
Traveling Systems
Measurement instructions are the same as in AG-553-7 (Evans et al., 1999b) and are adapted and reprinted here for convenience.
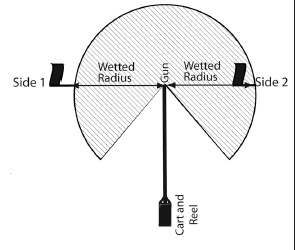
The wetted distance from the gun should be determined on both sides of the lane along the perimeter as indicated in Figure 4. The system should be operated long enough for all air to be purged from the system before starting to make measurements. With the system operating at normal pressure, complete these steps:
- Observe and flag the farthest point getting wetted for each of three consecutive rotations of the gun while standing just outside the wetted perimeter.
- Select one flag to mark the average distance of the three observations. Remove the other two flags.
- Move to the other side of the lane (180 degrees around the wetted perimeter) and repeat steps 1 and 2. The wetted perimeter should be flagged on two sides of the gun as shown in Figure 4.
- Measure and record the distances from the gun to each flag. These are measurements of wetted radius.
- Compare the two measurements of wetted radius. If the measurements are within 5 percent, add the two measurements to obtain the wetted diameter, and step 6 can be skipped. If the difference of the two measurements exceeds 5 percent, repeat steps 1 though 4 at another location along the lane or in a different lane.
- If the difference between the second set of measurements still exceeds 5 percent, the wind speed may be too high, resulting in excessive drift, or the gun may be functioning improperly. Once you have corrected the cause of variation in the two measurements, repeat beginning with step 1. If you cannot correct the problem, contact an irrigation technical specialist (“I” designation as listed with the Division of Soil and Water Conservation, NC Department of Environment and Natural Resources), or an irrigation dealer.
Stationary Systems
Measurement instructions are the same as in AG-553-6 (Evans et al., 1999a) and are adapted and reprinted here for convenience.
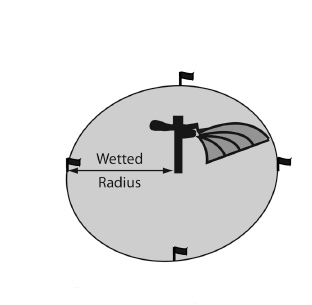
The wetted distance from each sprinkler should be determined at four points along the perimeter as indicated in Figure 5. Measured sprinklers should be the same model and have the same nozzle type and size.
- Observe and flag the farthest point getting wetted for each of three consecutive rotations of the sprinkle while standing just outside the wetted perimeter.
- Select one flag to mark the average distance of the three observations. Remove the other two flags.
- Move 90 degrees around the wetted perimeter, and repeat steps 1 and 2. Continue until the wetted perimeter has been flagged on four sides of the sprinkler as shown in Figure 5.
- Move to sprinkler no. 2, and repeat steps 1 through 3.
- Measure and record the distances from the sprinkler to each flag.
- Determine the average of the four measurements for each sprinkler.
- Compare the average measurements for the two sprinklers. If the measurements are within 10 percent, compute the average of the two and this will be the wetted radius (skip step 8 If the difference between the measurements is more than 10 percent, repeat steps 1 through 6 for a third sprinkler.
- Compare the measurements for all three sprinklers and identify the two that are closest. If their difference is less than 10 percent, compute the average of the two, and this value is the wetted radius. If the difference is more than 10 percent, repeat steps 1 through 6 until you identify two sprinklers that fall within 10 percent of each other.
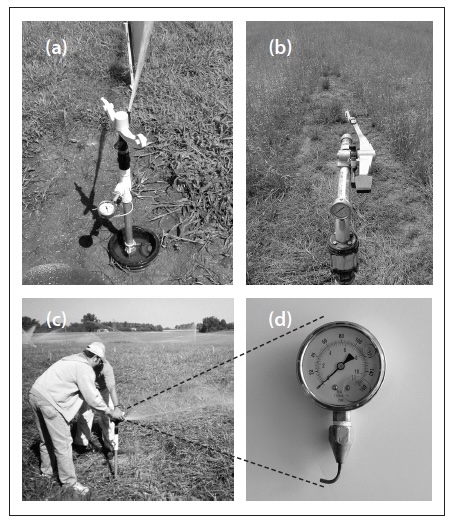
Figure 2. Measuring pressure using: (a) pressure gage mounted in sprinkler riser; (b) pressure gage mounted in gun body; and (c) pitot tube inserted into nozzle while sprinkler operating. Pitot tube connected to gauge is shown in (d).
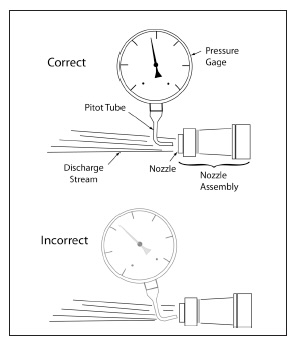
Figure 3. Correct (upper figure) and incorrect (lower figure) positioning of pitot tube in discharge stream for pressure measurement. A gun ring nozzle is shown in this illustration.
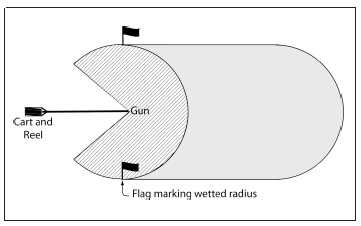
Figure 4. Illustration of field measurement of wetted radius for traveling gun systems.
Adapted from Figure 7 in Evans et al., 1999b.
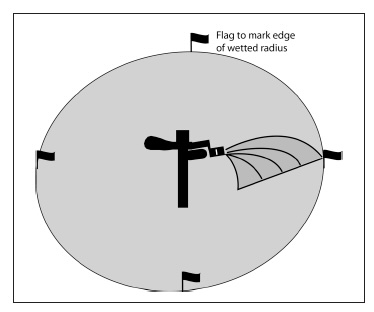
Figure 5. Illustration of field measurement of sprinkler wetted radius for stationary systems.
Adapted from Figure 7 in Evans et al., 1999a.
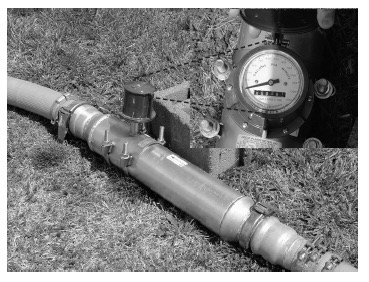
Figure 6. In-line flow meter with an exploded view of register
Compare Field-Measured Wetted Diameter to Manufacturer’s Chart
Once you have determined the wetted diameter from field measurements, compare the field-measured wetted diameter to the expected wetted diameter for the specific sprinkler and nozzle using the charts provided by the manufacturer. The field-measured wetted diameter must be within 15 percent of the wetted diameter reported in the manufacturer’s chart for the operating pressure determined in “Measuring Operating Pressure." If the difference is more than 15 percent, the difference may be due to excessive wind conditions at the time of field measurements or malfunctioning equipment. Contact an irrigation technical specialist if the wetted diameter values cannot be reconciled to within 15 percent.
Measuring and Comparing System Flow Rate
Flow Meter
Flow meters are appropriate for traveling gun systems in which the flow is to one gun or for stationary systems with gun-type sprinklers that normally operate one gun at a time. If using a flow meter, you will need a stopwatch or watch with a second hand. Make sure the flow meter used has been calibrated.
Determine flow rate by either (1) recording the instantaneous flow rate or (2) using the flow totalizer and elapsed time. Run the system in motion until all air is out of the system and the flow rate has been stabilized as shown by the flow rate needle or the digital readout on the flow meter.
1a. Record instantaneous flow rate in gallons per minute (gpm).
OR
1b. Subtract the ending flow totalizer reading from beginning flow totalizer reading for a time period of not less than 15 minutes. Convert to gallons per minute (gpm) by dividing gallons by elapsed time in minutes. When reading the totalizer, make sure to note the value of the last (farthest right) digit. Often this digit indicates hundreds of gallons, in which case the totalizer number needs to be multiplied by 100.
Note: Use step 1b rather than 1a if the instantaneous flow rate varies by more than 10 percent after all the air has been purged from the system and the flow has stabilized. For flow meters with needles (normally propeller-type meters), this is indicated by a “bouncing” needle.
Manufacturer’s Charts
If using manufacturer’s charts to estimate sprinkler flow rate, you will need to use the same chart as used in the "Compare Field-Measured Wetted Diameter to Manufacturer’s Chart" step. Determine the exact size of the nozzle opening. For large gun-type sprinklers, the nozzle size is usually stamped on the nozzle (or ring for ring nozzles) and measured in inches. For smaller sprinklers, the nozzle size is usually stamped on the nozzle that is threaded into the sprinkler body. The stamped number is normally given in 64ths of an inch; e.g., a number 16 nozzle is 16/64-inch (or ¼-inch).
- Enter the chart at the pressure measured and move to the column with the correct nozzle size. Record the flow rate. For recorded pressures that are between pressures given in the chart, either interpolate the flow rate or use the pressure in the chart that is just lower than the pressure recorded to obtain the flow rate.
-
Repeat step 1 for the other sprinklers for which pressure was recorded.
-
Compute the average of the flow rates. The average flow rate will be compared with the appropriate documentation.
Comparing Field-Measured Flow Rate to Appropriate Documentation
Field-measured flow rate must be within 10 percent of the value specified in the irrigation design documentation or as was determined during the irrigated acreage determination. If the two flow rate values are not within 10 percent, consult an irrigation technical specialist.
Uniformity Assessment
Acceptable uniformity may be inferred from two measurements: nozzle pressure and sprinkler (or lane) spacing. Nozzle pressure must be within the range shown on the manufacturer’s chart for your specific sprinkler. Sprinkler or lane spacing is expressed as a percent of the field-measured wetted diameter. Refer to the field data sheets for computation of sprinkler spacing. For traveling systems, the lane spacing must be within 60 to 90 percent of the field-measured wetted diameter for systems installed prior to February 1, 1999; and between 60 and 85 percent of field measured wetted diameter for systems installed after February 1, 1999. Stationary sprinkler spacing must be within 50 to 70 percent of field-measured wetted diameter. If both nozzle pressure and sprinkler spacing meet the above criteria, application uniformity is acceptable. If not, contact an irrigation technical specialist.
References
Related publications in the AG-553 series on animal waste application published by N.C. Cooperative Extension at NC State University, Raleigh:
Evans, R. O., J. C. Barker, J. T. Smith, and R. E. Sheffield 1997a. Field Calibration Procedures for Animal Wastewater Application Equipment - Stationary Sprinkler Irrigation System (AG-553-1).
Evans, R. O., J. C. Barker, J. T. Smith, and R. E. Sheffield. 1997b. Field Calibration Procedures for Animal Wastewater Application Equipment - Hard Hose and Cable Tow Traveler Irrigation System (AG-553-2).
Evans, R. O., J. C. Barker, J. T. Smith, and R. E. Sheffield. 1997c. Field Calibration Procedures for Animal Wastewater Application Equipment – Center Pivot and Linear Move Irrigation System (AG-553-3).
Evans, R. O., R. E. Sneed, R. E. Sheffield, and J. T. Smith. 1999a. Irrigated Acreage Determination Procedures for Wastewater Application Equipment—Stationary Sprinkler Irrigation System (AG-553-6).
Evans, R. O., R. E. Sneed, R. E. Sheffield, and J. T. Smith. 1999b. Irrigated Acreage Determination Procedures for Wastewater Application Equipment—Hard Hose Traveler Irrigation System (AG-553-7).
Other References
Liu, Zhengzhong. 2009. A Rapid Assessment Tool for Determining Uniformity of Irrigation-Type Manure Application Systems. Unpublished master’s thesis. Raleigh: NC State University, Department of Biological and Agricultural Engineering.
North Carolina 1217 Interagency Group. 2007. Eighth Senate Bill (SB) 1217 Interagency Group Guidance Document. Raleigh: NC Department of Environment and Natural Resources (NCDENR).
North Carolina 1217 Interagency Group. 2009. Ninth Senate Bill (SB) 1217 Interagency Group Guidance Document. Raleigh: NCDENR.
USDA—Natural Resources Conservation Service (NRCS). 2009. North Carolina Irrigation Guide. NEH 652, IG Amend. NC1, Sept. Raleigh: NRCS State Office.
Field Data Sheets
Traveling Gun System Calibration and Uniformity Data Sheet
Date:
Land Owner:
Farm No.
Manufacturer's Specifications:
Gun Model:
Nozzle Type:
- Measure Pressure
- Nozzle Diameter (in):
- Pressure (Gun) psi:
- Measure Wetted Radius (Refer to Figure 4 or Figure 7)
- Side 1 average distance from gun to wetted radius (ft):
- Side 2 average distance from gun to wetted radius (ft):
- Wetted diameter, WD (sum of Side 1 and Side 2) in ft:
- Wetted diameter from manufacturer’s chart using pressure in 1.b. (ft):
- \((Percent\ difference=\frac{field\ measured\ (2.c)\operatorname{ft}}{manufacturer's\ chart\ (2.d)\ ft}\times100=\)______%
Is 2.e between 85% and 115%? If “no,” contact technical irrigation specialist.
- Determine Flow Rate, Q (Using flow meter)
- Instantaneous flow rate (gpm): or...
- Ending totalizer reading (gallons):
- Beginning totalizer reading (gallons):
- Elapsed time between totalizer readings (min.):
- \(( flow\ rate=\frac{Ending\ totalizer\ reading(3.b)\ gall.\ -\ beginning\ totalizer\ reading\ (3.c)\ gall.}{Elapsed\ time\ (3.d)\ min.\ }=\) gpm. or… (Using Manufacturer’s Chart)
- Pressure from 1.b. (psi):
- Flow rate from manufacturer’s chart (gpm):
- Flow rate from irrigation design documentation/wettable acreage documentation (gpm):
- \(( Percent\ difference=\frac{field\ measured\ (3.a,\ e,\ or\ g)\ ft.}{Documentation\ (3.h)\ ft.}\times100=\) ______% Is 3.i between 90% and 110%? If "no," contact technical irrigation specialist.
- Assess Uniformity, Calculate Percent Overlap and Check Pressure
- Lane Spacing (ft):
- Lane Spacing (% of WD) = \(\frac{Lane\ Spacing\ (4.a)\ ft.}{Wetted\ Diameter\ (2.c)\ ft.}\times100=\)______%
-
Is Lane spacing (% of WD) (4.b):
Between 60% and 90%? (For systems installed prior to Feb.1, 1999)
Between 60% and 85%? (For systems installed after Feb. 1, 1999)
- Nozzle pressure from 1.b. (psi):
- Minimum pressure from manufacturer’s chart for gun model and nozzle type (psi):
- Maximum pressure from manufacturer’s chart for gun model and nozzle type (psi):
Is Nozzle pressure (4.c) between the minimum (4.d) and maximum (4.e) chart pressure?
If the answer to either question is “no” then uniformity is not acceptable. Contact an irrigation technical specialist.
Stationary Sprinkler System Calibration and Uniformity Data Sheet
Date:
Land owner:
Farm No.:
Manufacturer's Specifications:
Gun/Sprinkler Model:
Nozzle Type:
Nozzle Diameter (in.):
- Measure Pressure (measured from at least two sprinklers)
- Pressure (GunSprinkler) 1 (psi):
- Pressure (Gun/Sprinkler) 2 (psi):
- Pressure (Gun/Sprinkler) 3 (psi):
- Average pressure (psi):
- Measure Wetted Radius (refer to Figure 6 or Figure 8)
| Measurement | Sprinkler 1 (ft) | Sprinkler 2 (ft) | Sprinkler 3 (ft) |
|---|---|---|---|
| a. Side 1 average distance from sprinkler to wetted radius | |||
| b. Side 2 average distance from gun to wetted radius | |||
|
c. Side 3 average distance from sprinkler to wetted radius |
|||
| d. Side 4 average distance from gun to wetted radius | |||
| e. Average wetted radius |
f. Compare sprinkler radius for 1 and 2 \(\frac{sprinkler\ 1\ (2.e)\ \ \ \ \ \ \ \operatorname{ft}}{sprinkler\ 2\ (2.e)\ \ \ \ \ \ \ ft}\ \ \ \times100=\) ______%
Is 2.f between 90% and 110%?
g. If "yes," average the wetted radius for sprinklers 1 and 2 and multiply by 2 to obtain wetted diameter (WD) (ft.):
If "no," repeat for sprinkler 3 and compare against sprinklers 1 or 2 to see if between 90% and 100%.
h. Wetted diameter from manufacturer's chart using pressure in 1.e (ft.):
i. \(Percent\ difference=\frac{field\ measured\ (2.g)\operatorname{ft}}{manufacturer's\ chart\ (2.h)ft}\times100=\)______%
Is 2.i between 85% and 115%? If "no," contact technical irrigation specialist.
3. Determine Flow Rate, Q
a. Pressure from 1.e (psi):
b. Flow rate from manufacturer's chart (gpm):
c. Flow rate from irrigation design documentation/wettable acreage documentation (gpm):
e. \(Percent\ difference=\frac{field\ measured\ (3.b)\operatorname{gpm}}{Documentation(3.c)\ gpm}\times100=\)______%
Is 3.e between 90% and 110%? Yes? No?
If "no," contact technical irrigation specialist.
Access Uniformity
4. Calculate Percent Overlap and Check Pressure
a. Sprinkler spacing (ft):
b. Is Sprinkler spacing (% of WD) (4.b) between 50% and 70%? Yes? No?
c. Nozzle Pressure from 1.e (psi):
d. Minimum pressure from manufacturer's chart for sprinkler model and nozzle (psi):
e. Maximum pressure from manufacturer's chart for sprinkler model and nozzle (psi):
Is nozzle pressure (4.c) between the minimum (4.d) and maximum (4.e) chart pressure?
If the answer to either question is "no," then uniformity is not acceptable. Contact an irrigation technical specialist
Publication date: Feb. 1, 2011
Reviewed/Revised: March 12, 2026
AG-553-09
N.C. Cooperative Extension prohibits discrimination and harassment regardless of age, color, disability, family and marital status, gender identity, national origin, political beliefs, race, religion, sex (including pregnancy), sexual orientation and veteran status.