
North Carolina has about 18.14 million acres of timberland, primarily dominated by hardwoods in terms of number of species, acres of timberland, and live standing tree inventory. North Carolina timber delivered to wood-using mills was valued at $903.5 million in 2016 (Parajuli and Bardon 2018a). Most of the wood and fiber resources available throughout the state have been consumed by several sawmills, pulp and Oriented Strand Board (OSB) mills, and recently pellet mills. A key driver affecting a landowner’s decision to invest in forest management is industrial demand for the timber. That demand motivates the production of mature, sawtimber-sized trees suitable for producing lumber. In 2016, sawmills and veneer producing mills had a total economic contribution of about $4.4 billion to the North Carolina economy, supporting 18,716 jobs with a payroll of $1.7 billion (Parajuli and Bardon 2018b).
Softwood tree species, predominantly the southern yellow pines (Pinus spp.) in eastern North Carolina, supply lumber for use in residential and commercial construction. Loblolly pine is a dominant softwood species, covering about 4.91 million acres of land in North Carolina. The lumber sawn from North Carolina’s higher quality hardwood trees in the western part of the state is often the primary raw material for many other secondary wood products industries, including the state’s wood furniture cluster in Hickory and High Point. The mixed oak species group, mainly white oak, red oak and hickory, covers about 1.23 million acres of timberland. Lower grade hardwood sawtimber produces lumber for upholstered furniture frames, mats, and board roads for energy exploration, along with pallets for shipping goods across the country and around the world.
This publication updates McConnell’s (2013) information regarding North Carolina’s lumber markets over a 19-year time series, 1998 through 2016. Following the similar method adopted by McConnell (2013), annual production, consumption, and values of softwood and hardwood lumber revenues in North Carolina are estimated based on posted market prices. Partnered with timber or other forest product market trends, the information presented here can assist production forestry clientele—landowners, loggers, and mills—in their decision-making and understanding the recent trends in North Carolina lumber markets. These estimates will be revised periodically as new data become available.
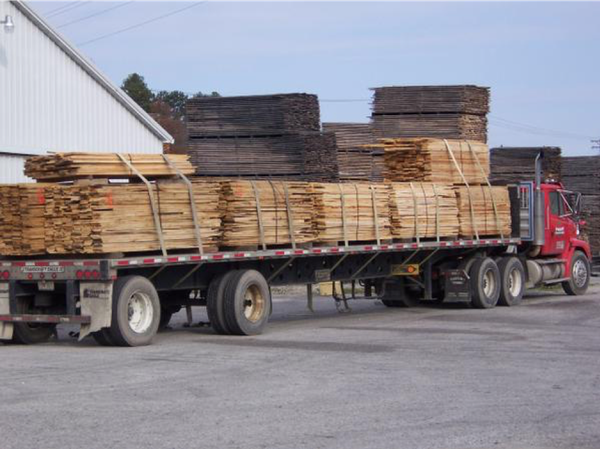
Hardwood lumber loaded for delivery to downstream users
Methods
Data were gathered from several sources. Historical national lumber production and consumption statistics, both softwood and hardwood, from 1965 to 2016 were obtained from the US Forest Service (Howard and Jones 2016, and James Howard personal communication).
Lumber consumption and production in North Carolina were estimated using an income-based approach (Laaksonen-Craig et al. 2003). State annual lumber consumption was calculated as the product of national lumber consumption times the ratio of real GDP by State for North Carolina to real US GDP.
Yearly lumber production in North Carolina was determined by first calculating the ratio of annual payroll for the Sawmills sector (NAICS 321113) in North Carolina to its national equivalent. The payroll ratio was next weighted by mill receipt data for softwood and hardwood sawlogs from North Carolina’s timber product output reports. The weighted payroll ratio was then multiplied by national lumber production. This calculation was done separately for both softwood and hardwood lumber.
Softwood lumber production revenues were calculated using the annual average price for No. 2 and better southern yellow pine lumber. The values of hardwood lumber production were determined using a weighted average price for the following species (sold as rough green or partially air dried): No. 1 common red and white oak, yellow-poplar, and soft maple. Weights were the proportional species representation in the North Carolina sawtimber inventory. Revenues reported should be considered as those paid to the producers.
Real US GDP and real GDP by State data were obtained from the Federal Reserve Bank of St. Louis Economic Data. Sawmill payroll statistics for the United States and North Carolina were obtained from the US Census Bureau’s County Business Patterns (US Census Bureau 2018). Both state and national payrolls were adjusted for inflation using the Producer Price Index—Lumber (US Bureau of Labor Statistics 2018). Lumber prices were based on those published by RISI Inc. and Hardwood Review and were adjusted to 2016 constant dollars using the Producer Price Indexes for softwood and hardwood lumber respectively (US Bureau of Labor Statistics 2018).
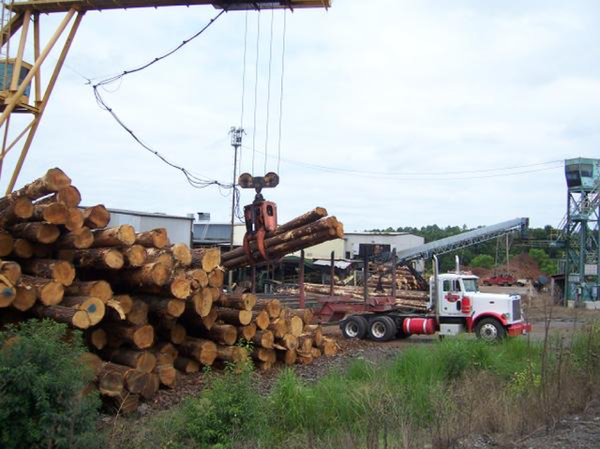
Unloading pine sawlogs.
Housing Starts
New residential construction in the United States is a primary driver of the wood product industry, consuming approximately 70% of structural wood products and about one-third of softwood lumber. Figure 1 presents the annual trend of nationwide, privately-owned total housing starts in the United States. Housing starts in 2005, right before the housing market crash, were at an annual rate of over two million units. The residential construction dropped precipitously (about 75%) to the annual rate of just about one-half million units in 2009, due to the housing market crash followed by the 2008 financial crisis. The housing market, however, continues to improve slowly in recent years. The annual rate of residential construction in 2016 was about 1.17 million units, with roughly two-thirds being single-family housing starts. Recent research projected that housing starts would remain at a long-run median of about 1.3 million total annual starts (Prestemon et al. 2017).
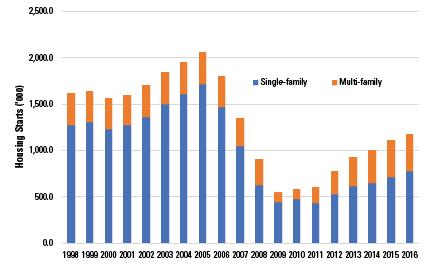
Figure 1. U.S. residential construction: new privately-owned housing units started.
U.S. Census Bureau
Total Production and Consumption
The lumber industry is an integral part of the North Carolina forest product industry. Since 1998, North Carolina has produced an annual average of about 2.301 billion board feet (BBF) of softwood and hardwood lumber, which represents about 5.2% of the total US domestic lumber production annually. Similarly, an annual average lumber consumption in North Carolina is about 1.575 BBF, approximately 2.8% of annual national lumber consumption in the United States.
Combined softwood and hardwood lumber production averaged around 2.510 billion board feet (BBF) from 1998 to 2003 before peaking in 2005. The housing market crash and the subsequent global recession in 2008 substantially impacted both lumber production and consumption trends. Statewide production fell 38.4% from 2005 (2.72 BBF) to 2009 (1.672 BBF). From the 2009 low point, production had increased 44.2% to 2.410 BBF by 2016 (Figure 2).
Annual lumber consumption in North Carolina has followed a trend similar to that of production. Consumption peaked in 2005 at 2.057 BBF of softwood and hardwood lumber before falling to 1.074 BBF in 2009. Falling demand by downstream users linked to housing was largely responsible for this falloff. Neither production nor consumption had returned to pre-recession levels by 2016.
Overall, North Carolina has been a net lumber exporter since at least 1998. Annual production has exceeded annual consumption every year. Lumber exports from the state are destined for several domestic and foreign markets.
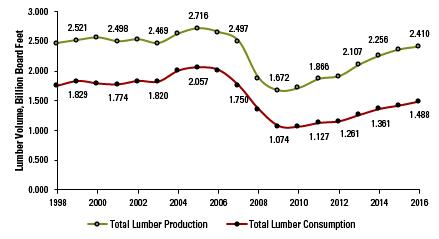
Figure 2. North Carolina lumber production and consumption, 1998-2016.
Softwood Production and Consumption
North Carolina is primarily a manufacturer of softwood lumber. More than two-thirds of the state’s total annual production volume is accounted for by softwood species, and this trend has held for every year of the time series. Much of this production comes from large southern pine sawmills located in the state’s piedmont and coastal plain.
Over the time series, annual average softwood lumber production has exceeded 1.636 BBF; prior to 2008, softwood lumber production annually exceeded 1.809 BBF. Aside from 2003, production steadily increased until 2005, peaking at nearly 2.000 BBF. Production declined moderately in 2006 (2.3 % decline from 2005) and 2007 (9.0% decline from 2006) before falling an additional 24.9% in 2008 from 2007. Since 2009, production has increased steadily at an annual average rate of 5.7%. Production volume in 2016 was estimated at 1.786 BBF (Figure 3).
Softwood lumber consumption peaked in 2005 at about 1.756 BBF and reached a series low of 0.886 BBF in 2009. Consumption had generally trailed production by approximately 0.253 BBF from 1998 to 2007. Note that consumption nearly approached production in 2008, when the difference between the two was only 0.155 BBF. Since 2009, production has exceeded consumption by at least 0.324 BBF annually. Nearly all of the softwood lumber exported from North Carolina is destined for domestic markets in other states.
The real softwood lumber price (in 2016 dollars), represented by #2&BTR, 8-foot 2- by 4-inch kiln-dried southern pine price series (RISI 2018), fluctuated between $300 and $400 per thousand board feet (MBF), with an annual average of $350/MBF from 1998 to 2016. The lowest price point of $309/MBF was in 2009. In 2016, the softwood lumber price was $385.67/MBF, about the same level as 1998.
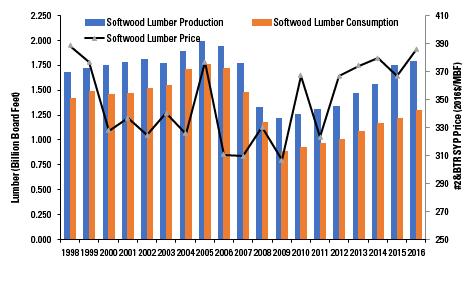
Figure 3. North Carolina softwood lumber production, consumption, and price: 1998-2016.
Hardwood Production and Consumption
The hardwood lumber industry consists of two primary product categories—appearance grade lumber and industrial products. Higher quality hardwood trees, which are capable of producing greater volumes of appearance grade lumber, are located more so in the western part of the state than elsewhere. The hardwoods of eastern North Carolina are more commonly manufactured for use in industrial grade products.
Hardwood lumber production and consumption in the United States have been in overall decline since the late 1990s, and the trends in North Carolina have been no different. Production peaked in 2000 at 0.815 BBF before falling to a low of 0.453 BBF in 2010. Movement in consumption over the time series was similar to that of production, but year-on-year changes were largely of lesser magnitudes (Figure 4).
North Carolina, on average, has annually produced 2.85 times more hardwood lumber than it has consumed since 1998. This differs from the national trend, in which hardwood lumber consumption has been largely equivalent to production since 1965 (Howard and Jones 2016). Further, the hardwood product mix has undergone a dramatic shift in the United States in recent years. The relative volume of appearance grade lumber manufactured has lessened, while industrial products now comprise approximately 60% of total hardwood production.
The state’s wood furniture industry was historically the largest consumer of appearance grade lumber. The decline of that industry nationally contributed to a global shift in demand for appearance grade lumber away from domestic markets to foreign destinations. In other words, the export market is a primary driver of the hardwood industry in recent years. North Carolina hardwood lumber in recent years has been shipped primarily to China, Vietnam, Italy, and the United Kingdom. In fact, about 95% of the total lumber volume exported from the state to foreign markets is hardwood lumber, predominantly oak lumber (USDA FAS 2018).
The hardwood lumber price series, an index of No. 1 common red and white oak, yellow-poplar, and soft maple prices, closely followed the trend of hardwood lumber production. The lowest hardwood price was in 2009 with an annual average value of $513.66/MBF. The 2016 price was about $636.40/MBF, $40.72/MBF lower than the 1998 price level. In the period from 1998 to 2016, annual hardwood lumber prices were, on average, about 80% higher than softwood lumber prices.
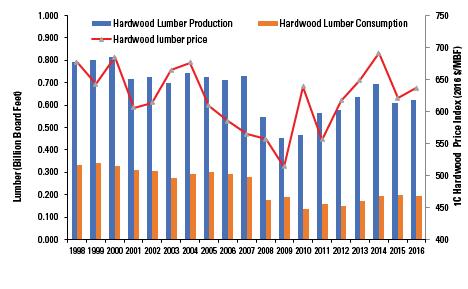
Figure 4. North Carolina hardwood lumber production, consumption, and price: 1998–2016.
Lumber Revenues
Plotting lumber revenues over the time series reveals three distinct time periods. From 1998 to 2005, annual production averaged1 $1.115 billion (2016 dollars) in value and fluctuated about 5.85% from the mean (Figure 5). The small declines in overall sales for these years appeared related to the long-term decline in hardwood lumber production. In the four-year period from 2005 to 2009, the value of North Carolina lumber fell by half, from $1.192 billion to $606 million. Since the low point of 2009, annual state lumber revenue has been rising constantly, but still has not reached back to the 2005 level. The annual total lumber revenue in 2016 was $1.086 billion.
Since 2014, total lumber sales had recovered to surpass their pre-recession level of 2007 and at the same time exceeded $1.000 billion for the first time since 2006. While the annual softwood lumber revenue had been in a continuous upward trend since 2011, annual hardwood sales value has fluctuated in recent years. The 2016 softwood lumber revenue was about $689 million, the second largest annual value since 1998. On the other hand, the annual average hardwood revenue in the period of 2009 to 2016 was about $377 million, a 22% lower than the annual average revenue in the period of before 2005.
1 As measured by the geometric mean.
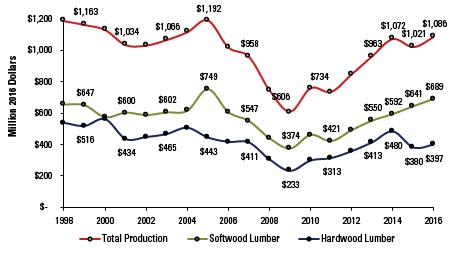
Figure 5. North Carolina lumber revenues, 2016 constant dollars, 1998–2016.
Summary and Implications
Lumber product value is a significant contributor to North Carolina’s economy. Even at the lowest point of the time series, the state produced well in excess of 1.500 BBF of softwood and hardwood lumber. Approximately 71.1% of that production has been softwood lumber, with 28.9% being hardwood. The hardwood share has shrunk in recent years.
Lumber consumption in North Carolina has primarily been centered in the sectors of residential and commercial construction; engineered wood products manufacturing; wood windows, doors, and millwork manufacturing; and upholstered wood furniture manufacturing. The consumption mix of lumber has also remained relatively constant in the state since 1998. Approximately 84.0% of total lumber consumption has been softwood species, while 16.0% has been hardwood species.
The figures in this publication highlight how global events and trends have affected lumber markets in North Carolina. Recoveries from the 2008 recession have been gradual in residential and commercial construction in the United States. The rise of world markets for US lumber, specifically hardwood, has pushed gains in net exports. And with the rise in markets, the global competitiveness of North Carolina hardwoods has improved.
Following the expiration of the 2006 Softwood Lumber Agreement (SLA) between the United States and Canada in October 2015, the US government has imposed company-specific import tariffs of about 21% on Canadian softwood lumber. These tariffs have a profound impact on the US softwood lumber markets. Similarly, with the improving US housing markets and strong economic growth in recent years, softwood lumber prices across the board were trending at an all-time high in the first half of 2018. Moreover, improved construction and remodeling markets offer business opportunities for North Carolina manufacturers but also low-cost competing imports. Further, any continued strengthening of the US dollar in the world market makes American exports more expensive and foreign imports less so. China has been a main destination for North Carolina lumber; more than 50% of lumber exports from North Carolina were destined for China in 2017. The lumber markets, particularly softwoods, are projected to remain more volatile, unless the US-Canada softwood lumber trade dispute gets settled. Likewise, the hardwood export markets, in particular, have been impacted by recent tariffs and retaliatory trade policies between the United States and China and the European Union.
Softwood lumber and other wood products are used for housing construction
References
Federal Reserve Bank of St. Louis. 2018. FRED® Economic Data Add-In: Real GDP by state: North Carolina. St. Louis (MO): Federal Reserve Bank [accessed Oct 3 2018].
Federal Reserve Bank of St. Louis. 2018. FRED® Economic Data: Real U.S. GDP. St. Louis (MO): Federal Reserve Bank [accessed Oct 3 2018].
Hardwood Review. c1998–2016. Weekly price report. Charlotte (NC): Hardwood Publishing.
Howard, J.L. and K.C. Jones. 2016. U.S. timber production, trade, consumption, and price statistics, 1965–2013. Research paper FPL-RP-679. Madison (WI): US Department of Agriculture, Forest Service, Forest Products Laboratory. 100 p.
Laaksonen-Craig, S., G.E. Goldman, and W. McKillop. 2003. Forestry, forest industry, and forest products consumption in California. Agriculture and Natural Resources Publication 8070. Berkeley (CA): University of California, Division of Agriculture and Natural Resources. 19 p.
Parajuli, R. and R. Bardon. 2018a. 2016 Income of North Carolina Timber Harvested and Delivered to Mills. Raleigh (NC): Extension Forestry, NC State Extension, NC State University.
Parajuli, R. and R. Bardon. 2018b. Economic Contribution of the Forest Sector in North Carolina, 2016. AG-844 Extension Forestry, NC State Extension, NC State University.
Prestemon, J.P., D.N. Wear, K.L. Abt, R.C. Abt. 2017. Projecting housing starts and softwood lumber consumption in the United States. Forest Science 64(1):1-14.
RISI Inc. c1998–2016. Weekly price report. Atlanta (GA): RISI Inc.
U.S. Census Bureau. 2018. Geography Area Series: County Business Patterns for 321113 2012 NAICS Code. Washington (DC): US Census Bureau [accessed October 1 2018].
U.S. Census Bureau. 2018. County Business Patterns. Washington (DC): U.S. Department of Commerce [accessed Oct 3 2018].
U.S. Bureau of Labor Statistics. 2018. Producer Price Index commodity data. Washington (DC): U.S. Department of Labor [accessed Oct 3 2018].
USDA FAS. 2018. Global Agricultural Trade System. U.S. Department of Agriculture Foreign Agricultural Service [accessed Oct 3 2018].
Publication date: Jan. 11, 2019
AG-816
N.C. Cooperative Extension prohibits discrimination and harassment regardless of age, color, disability, family and marital status, gender identity, national origin, political beliefs, race, religion, sex (including pregnancy), sexual orientation and veteran status.
