Because public parks are widely available in communities across the country, parks are recognized as important environments for promoting active lifestyles. A growing number of studies suggest that parks contribute significantly to physical activity among adults and children.1–4 Research conducted in parks demonstrates that particular areas within parks produce more activity than others.5–8 Results from these kinds of studies have inspired researchers to more closely examine the potential of parks to promote physical activity. These examinations use intervention studies and natural experiments. In these studies, researchers are able to obtain baseline measures on park use and activity in a park before an improvement occurs and compare the measures to data obtained following the improvement. Such comparisons evaluate the extent to which park facilities encourage increased use and activity levels. Studies of this kind show promising results. In general, parks are used more often and users are more active following improvements or renovations.9–13
Translating this research evidence to on-the-ground planning and construction inevitably shifts the discussion to financial considerations. What are the financial costs of adding or maintaining new facilities that could increase use and activity? What are the life span costs relative to increased use and additional physical activity? Answers to such questions can provide objective information to park officials, policymakers, and citizens to help them make more informed decisions about park facilities construction to promote active lifestyles. Park and recreation agencies at all levels of government are challenged now more than ever to provide high quality services in a fiscally conservative environment. As public parks and recreation facilities are increasingly positioned as health resources, greater demands for providing and using parks are expected. Park improvement projects with the stated purpose of encouraging activity need to be supported by data on the financial costs associated with making such improvements.
The goal of our analysis is to provide realistic and objective estimates of costs of providing park facilities that can increase physical activity. To our knowledge, no study has attempted to establish the financial costs associated with providing park facilities and amenities most supportive of physical activity during a park visit. Our analysis addressed three aims:
- Identify designated recreational activity use zones within selected parks and classify them as high-activity, moderate-activity, and low-activity zones using data derived from systematic observations.
- Describe the facilities, equipment, and amenities in the recreational activity use zones where the activity occurred.
- Estimate the construction costs of facilities and equipment in different types of recreational use zones (that is, high-activity, moderate-activity, and low-activity zones).
The analysis takes advantage of park use and observed physical activity data available from two previous studies funded by the Robert Wood Johnson Foundation and Active Living Research (project numbers 55862 and 59449) and park construction and maintenance cost data provided by Design Concepts CLA, Inc. (Lafayette, CO).
Data Sources
Physical Activity. Data on physical activity come from systematic observations of 10 parks in Tampa, FL, 18 parks in Chicago, IL, and 20 neighborhood parks in Durham, NC. These studies provide objective measures of park-based physical activity using the System for Observing Play and Leisure among Youth (SOPLAY) (Tampa and Chicago parks) and the System for Observation Play and Active Recreation in Communities (SOPARC) (Durham parks). The parks from all three cities were selected to include parks with potential to serve low-income and minority communities. Results have been published from the Tampa-Chicago14–16 and Durham studies.17–20
In the Tampa and Chicago parks, four scanning periods (two in the AM; two in the PM) were conducted for each activity area (such as, basketball courts, picnic areas, playgrounds). Observers also recorded ages, gender, types of activity, predominant activities, and environmental variables, including the time of day (AM or PM). Observations took place in the parks between 10 AM and 6 PM from Friday through Sunday during the spring (Tampa, March – April) and early summer (Chicago, May – June) of 2005). Trained observers coded park users’ behaviors into one of three activity levels: sedentary (such as standing, sitting, lying down), moderate activity (such as walking and other moderate intensity activities), and vigorous activity (such as running, climbing, jumping).
Similarly, for the Durham parks, observations occurred for eight weeks from 10 AM to 7 PM (EDT) on all weekend days and two randomly selected weekdays between May and July of 2007. Each park was observed 16 times over the study period (eight weekend days and eight weekdays). Following the SOPARC protocol, observed activity was coded as sedentary, moderate, and vigorous. Note that observed activities of park users within specific zones may reflect uses other than those intended (such as playing soccer on a football field or children playing with toys on a tennis court).
Kilocalories expended in each park activity were estimated by equating activity categories with these constants: .051 kcal/kg/min for sedentary, 0.096 kcal/kg/min for moderate, and 0.144 kcal/kg/min for vigorous. For example, if 10 park users were observed in a playground and two were sedentary, four were walking, and four were vigorously active, the resulting energy expenditures for each activity group would be 0.102 (sedentary), 0.384 (moderate), and 0.576 (vigorous), or a total of 1.06 kcal/min. For this analysis, we use kcal/kg/hour to be consistent with SOPLAY, a forerunner of SOPARC, and other studies.21–22, 6, 15
Park Facilities. Data on park facilities and features were obtained by direct observation from 10 parks in Tampa, FL; 28 parks in Chicago, IL; and 20 parks in Durham, NC. Each park was audited to identify and measure the presence or absence of specific facilities (such as play structures and basketball hoops) and amenities (such as water fountains and benches). Audits were conducted in the predetermined SOPLAY activity zones mapped by two of the project investigators. For all cities, zones were grouped as: fields (softball, football, soccer, etc.) (n=187), courts (basketball, tennis, etc.) (n=93), playgrounds (n=66), open space areas (n=31) and shelters (n=69). Zone counts for each city were as follows in Table 1:
Table 1. Number and Types of Park Activity Zones by Study Area Location
| |
Zone Types |
|
| City |
Fields |
Courts |
Playgrounds |
Open Areas |
Shelters |
Total |
| Chicago, IL |
93 |
43 |
27 |
7 |
1 |
171 |
| Tampa, FL |
25 |
20 |
15 |
18 |
53 |
131 |
| Durham, NC |
69 |
30 |
24 |
6 |
15 |
129 |
| Total |
187 |
93 |
66 |
31 |
69 |
446 |
Qualitative descriptions of each park zone were also recorded.
Park construction costs. Cost estimation is as much an art as a science, and expert judgment is required to generate an accurate estimate for a specific project. There are numerous variables that affect the final cost of any project, including the site’s existing conditions, its location, the presence or absence of support facilities and other features necessary for the proposed project, and other factors. Some items vary considerably in size, type, materials, configuration, and other aspects that affect their cost. Costs shown in this report do not include the cost of land acquisition and design, engineering, permits, and other soft costs. For these reasons, we recommend that a contingency in the range of 20 percent to 30 percent be added to these items if they are to be newly constructed on undeveloped sites. It should also be expected that once a final estimate is reached, the actual contractor bid price could range as much as 20 percent below to 20 percent above that estimate depending on the many factors involved. General standards accepted in the industry are that final estimates based on detailed plans should be accurate to within plus or minus 10 percent of the actual bid price, but even this is not always guaranteed. The cost estimates were based on costs data from actual park development and park master planning projects performed by Layton and Design Concepts CLA Inc. Location factors were used to adjust costs to a particular location.
Analysis
To describe physical activity levels in parks, the following data are reported: (1) the total number of users of each park activity zone, (2) estimated total energy expenditure for each type of park activity zone (kcal/kg/hour), and (3) estimated energy expenditure over and above sedentary level energy expenditure. By calculating energy expenditure over and above sedentary levels (removing basal metabolic rate), park zones will show only levels of active energy expenditure. For example, zones with large numbers of users will show high levels of energy expenditure, even if all use is sedentary, because any activity (such as standing or sitting) expends energy. Therefore, the resulting measure of active energy expenditure provides the best indication of the potential for park zones and their components to promote moderate and vigorous activity levels.
By using active energy expenditure (AEE), we wanted to emphasize physical activity over and above the sedentary rate. For this, energy expenditure without a basal metabolic rate (BMR), or AEE, was calculated by obtaining the total energy expenditure per zone, then subtracting sedentary energy expenditure from all the participants, including those at the moderate and vigorous levels. For example, if energy expenditure (EE) for sedentary = 1, moderate = 3, and vigorous = 6, and there were 10 participants in a zone (five participants being sedentary, four moderately active, and one vigorously active), our typical approach to calculating EE would be: 5*1 = 5; 4*3 = 12; 1*6 = 6. The products are summed to provide total EE (that is, 5+12+6 = 23 overall EE). So if all 10 participants were classified as sedentary (10*1 = 10), and we subtract that from total EE (23 minus 10), the result would be an AEE of 13. Also, total AEE for all zones was divided by the total scans of observations in each zone to obtain a standardized AEE per observation.
Using total estimated AEE, each park activity zone was given a total energy expenditure score and was subsequently ranked to create classifications of high (coded 1), moderate (coded 2), and low activity zones (coded as 3). The AEE classes for the recorded variable were determined using the original levels of AEE for moderate (5.76 kcal/kg/hr) and vigorous (8.64 kcal/kg/hr). Low activity (or sedentary level) was any zone below 2.0 kcal/kg/hr.
We also computed an “active energy expenditure cost” (AEEC) rating that indicates the cost of constructing a park facility relative to the amount of physical activity (AEE) it generates. The AEEC rating was calculated by recoding each zone into three classes for EE (1= highly active; 2 = moderately active; 3 = low active) and three classes for cost (1 = low cost; 2 = medium cost; and 3 = high cost). The cost classes were determined using tertiles from the cost values. After adding the classes together, a range from 2 (2 = most active; least expensive) to 6 (least active; most expensive) was created and recoded into 1 to 5 (by reducing one number in each category) to rate the activity zones in terms of cost and energy expenditure (Table 7).
This report is organized by first presenting an overview of physical activity participation in park activity zones. Total numbers of park users observed, total energy expenditure, and AEE are reported. Second, the cost efficiency results are reported.
Park Zone Descriptions
A description of each type of park zone used for this analysis that includes photographs of the different zone types is provided in the sections below. In addition to the zone description, size of the zones (mean), the number of park users used to calculate EE values, construction costs, maintenance costs, and the zone’s AEEC rating are provided. A summary of energy expenditure, cost estimation, and cost-efficiency is presented in the following section.
Active Energy Expenditure
Active energy expenditure is reported to show physical activity intensities above the basal metabolic rate. To obtain AEE per observation, the total amount of AEE for each zone was divided by the total observations of that zone, including observations with zero participants (that is, no park users were present during scheduled observations). Four types of zones exhibit AEE amounts greater than 10 kcal/kg/hr (Table 2). Highest AEE was recorded for football fields (35.93), large soccer fields (16.01), tracks (14.77), and small soccer fields (12.39). The next most active zones, with AEE between 5 and 10 kcal/kg/hr, included small (9.6) and large volleyball courts (7.65), small (7.35) and medium shelters (8.66), outdoor racquetball courts (7.64), medium (5.08) and large playgrounds (7.09), small (6.42) and medium softball/baseball fields (5.53), and large basketball courts (5.02). Other zones typically found in parks that were in the lower range of AEE were small playgrounds (1.92) and medium soccer fields (1.73). Zones designated for picnicking were all less than 1.5 kcal/kg/hr, irrespective of their sizes.
Costs Analysis
Based on each zone’s description and size, a cost estimate was provided to indicate what it would cost to reproduce that zone in 2013 dollars. An overview of national costs associated with each zone type is shown in Table 3, which also includes an estimate of annual maintenance costs. The costs are adjusted to reflect national and city-by-city cost differences (Table 2). Overall national costs are reported in the main summary of this report. Separate estimates are provided to show costs associated with park construction in Tampa, Florida; Chicago, Illinois; and Durham, North Carolina (Tables 4 through 6). As noted previously, the physical activity data were collected in parks located in these cities.
Table 2. Location Factors Used to Adjust Cost Estimates for Each City
| |
Materials |
Installation |
Total (Average) |
| Tampa, FL |
99.5 |
81.1 |
91.4 |
| Chicago, IL |
99.3 |
138.3 |
116.5 |
| Durham, NC |
100.3 |
53.9 |
79.9 |
| Denver, CO |
101.7 |
83.4 |
93.6 |
| National Weight Average |
100 |
100 |
100 |
| Source: RSMeans Engineering Staff. (2012). Location factors index. In building construction cost data. Kingston, MA: Gordion Group, Inc. |
To adjust national costs to a specific location:
City Cost = (NationalCost * LocationFactor) ÷ 100
To adjust Denver, CO costs to a specific location:
City Cost = (LocationFactor ÷ DenverLocationFactor) * DenverCost
To indicate which zones have the greatest potential to support physical activity through existing facilities or could increase opportunities for higher levels of activity by constructing new facilities, an AEEC rating was calculated for each type of park zone observed in Tampa, Chicago, and Durham parks. Lower ratings indicate greater cost efficiency with respect to a zone’s observed AEE. By contrast, high rating values indicate “poor efficiency,” meaning that a particular type of zone is costly and produces low levels of AEE. To make the interpretation of the rating clear, the ratings were recoded to form a scale of 1 to 5, with 1 designated as the “most cost efficient” and 5 as the “least cost efficient.” The results of the AEEC ratings analysis are shown in Table 7, where the park zones are ranked according to the 1-to-5 AEEC classification.
Based on the AEEC ratings, the most efficient zones were multi-use courts and small shelters. Both of these maximized energy expenditure while minimizing the construction and maintenance costs. A second grouping of zones, the next most cost efficient, consisted of small and medium open areas, medium and large basketball courts, and medium volleyball courts. At the opposite end of the scale, the least cost-efficient zones (that is, high cost and low AEE) were large trails (mostly large walkways) and large volleyball courts, pools, medium playgrounds, and all sizes of softball/baseball fields.
The following limitations should be considered in using the results of this analysis. First, the physical activity data are limited to observations conducted in neighborhood parks in three cities. These observations were conducted in spring and summer months on selected weekdays and weekend days (both Saturday and Sundays) and do not account for all possible times parks could be used. Second, the energy expenditure measures are based on constant values assigned to physical intensity categories (sedentary, moderate, and vigorous activity levels) and may not reflect exact levels of energy expenditures associated with people’s physical activity behaviors in parks. Third, data used to estimate costs of constructing park facilities were derived from historical bids on park design and building projects. Such estimates vary with factors such as extent of site preparation required, land acquisition, weather delays, geographic and locational differences, and other contingencies.
The analysis is based on actual use of parks, and data were obtained by objective and widely accepted methods for recording physical activity in parks. In addition, the costs data were derived from actual bids made by a park master planning firm with more than 25 years of industry experience. The cost estimates were also adjusted for locational differences by applying locational factors based on industry standards.
This analysis combined physical activity data from three park studies with park facilities cost data taken from actual bids on park development projects. Our goal in the analysis was to use these data to provide insights on costs associated with improving park facilities to promote physical activity. Neither cost nor physical activity (AEE) alone should drive the design and management of parks. Both factors are part of a complete set of information that should be used to make informed decisions that are informed by statistical evidence whenever possible. The AEEC rating can offer new information to help decision-makers balance all of the competing interests and issues associated with providing parks and other greenspaces. Public greenspace has to serve a broad set of needs within a community, one of which is to encourage active living. Given that need, active living facilities should be provided routinely throughout the park or greenspace system. The AEEC rating could be useful when tight budgets, political issues, or both are preventing the provision of adequate active-living components in a situation. For example, if there is political resistance to spending money on "developed" park features in a location, the benefits of activity-generating features could be used as evidence for providing developed features, and the AEEC rating could be used to show that the proposed features do provide a justifiable return on the investment.
There is also a danger, however, that improper application of the AEEC rating could lead to an oversupply of multi-courts and a dearth of medium-sized playgrounds, if cost versus benefit is the only consideration. Very good reasons may exist to provide baseball or softball fields beyond the AEEC rating of the fields. Thus, it should be stressed that AEEC rating is just one of the many considerations that must be considered in the decision. This caution also applies to considering cost and EE separately. To date, no ideal mathematical formula exists that tells us what to put into a park to “make” people active or healthy or to optimize a park’s design for achieving multiple goals. The prospect of a formula or rubric that would roll up all of the desired outcomes from parks and greenspace into a single model of coefficients and variables is alluring. Ideally, a park system would be expected to yield a set quantity of energy expenditure per capita, as well as other benefits, such as stormwater mitigation, air purification, economic development, carbon capture, and other ecosystem services. Future analyses might move in this direction. Considering costs in relation to energy expenditure is one possible step towards that. Meanwhile, the AEEC rating is a metric that could be useful to park planners and decision makers.
Descriptions of Park Activity Zone Costs and Observed Physical Activity
| Football fields varied in features and were treated as one per zone. These sometimes included a soccer field inside the field or a track around the field. Fields were of regulation size with goal posts and end zones. |
| Average size (sq ft) |
58,718.00 |
| Cost to construct |
$100,000 |
| Construction cost per sq ft |
$1.70 |
| Annual maintenance costs |
$15,000 |
| Total number of park users |
65 |
| Total number of observations |
5 |
| Park users per observation |
13 |
| Active EE (EE kcal/kg/hour) per user |
2.76 |
| Active EE (EE kcal/kg/hour) per observation |
35.93 |
| Active Energy Expenditure Cost (AEEC) rating |
2 |
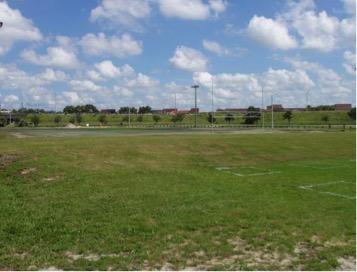
Football field.
| Large soccer fields ranged from an open area with painted lines to a full field with goal posts by itself or inside a track. Large fields were suitable for regulation lacrosse and other field sports. Each full-size regulation field was 49,500 sq ft to 81,000 sq ft. |
| Average size (sq ft) |
77,652.41 |
| Cost to construct |
$115,000 |
| Construction cost per sq ft |
$1.48 |
| Annual maintenance costs |
$20,000 |
| Total number of park users |
357 |
| Total number of observations |
40 |
| Park users per observation |
8.93 |
| Active EE (EE kcal/kg/hour) per user |
1.79 |
| Active EE (EE kcal/kg/hour) per observation |
16.01 |
| Active Energy Expenditure Cost (AEEC) rating |
3 |
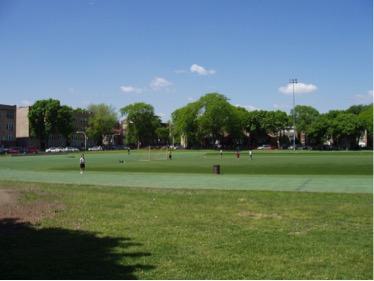
Large soccer field.
| Tracks varied in size (11,867 – 37,260 sq ft) and in features but were always counted as one per zone. Tracks usually are located with a football or soccer field inside. Six lanes with an eight-lane straightaway and synthetic surface is considered a standard track for competition. |
| Average size (sq ft) |
22,657.28 |
| Cost to construct |
$400,000 |
| Construction cost per sq ft |
$17.65 |
| Annual maintenance costs |
$60,000 |
| Total number of park users |
233 |
| Total number of observations |
29 |
| Park users per observation |
8.03 |
| Active EE (EE kcal/kg/hour) per user |
1.84 |
| Active EE (EE kcal/kg/hour) per observation |
14.77 |
| Active Energy Expenditure Cost (AEEC) rating |
3 |
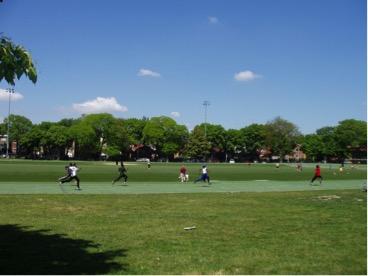
Track.
| Small soccer fields varied in size (20,250 – 21,582 sq ft) and in features but were always counted as one per zone. The range of field conditions included open areas to fields with painted lines and goals. These were individual fields or situated inside of a track. |
| Average size (sq ft) |
20,648.18 |
| Cost to construct |
$40,000 |
| Construction cost per sq ft |
$1.94 |
| Annual maintenance costs |
$7,500 |
| Total number of park users |
121 |
| Total number of observations |
22 |
| Park users per observation |
5.50 |
| Active EE (EE kcal/kg/hour) per user |
2.25 |
| Active EE (EE kcal/kg/hour) per observation |
12.39 |
| Active Energy Expenditure Cost (AEEC) rating |
2 |
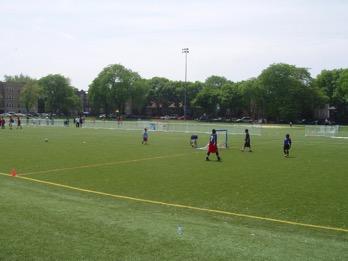
Small soccer field.
| Small volleyball courts consisted of one standard court with sand or grass surface, poles, and net. Each court is a complete unit. These zones ranged in size between 2,050 and 3,854 sq ft. A standard court is 1800 sq ft with a surrounding safety area. |
| Average size (sq ft) |
2,651.33 |
| Cost to construct |
$50,000 |
| Construction cost per sq ft |
$18.86 |
| Annual maintenance costs |
$5,000 |
| Total number of park users |
27 |
| Total number of observations |
6 |
| Park users per observation |
4.50 |
| Active EE (EE kcal/kg/hour) per user |
2.13 |
| Active EE (EE kcal/kg/hour) per observation |
9.60 |
| Active Energy Expenditure Cost (AEEC) rating |
2 |
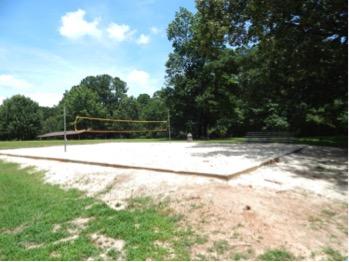
Small volleyball court.
| Multi-courts were typically paved asphalt or concrete surfaces for multiple sport activities (for example, volleyball, four-square, etc.). Multi-courts varied in size (range 5,842.32 – 6,552 sq ft) and features but were always counted as one court per zone. One court is approximately 80 feet × 80 feet in asphalt with striping. |
| Average size (sq ft) |
6,215.00 |
| Cost to construct |
$20,000 |
| Construction cost per sq ft |
$3.22 |
| Annual maintenance costs |
$2,500 |
| Total number of park users |
41 |
| Total number of observations |
6 |
| Park users per observation |
6.83 |
| Active EE (EE kcal/kg/hour) per user |
1.38 |
| Active EE (EE kcal/kg/hour) per observation |
9.45 |
| Active Energy Expenditure Cost (AEEC) rating |
1 |
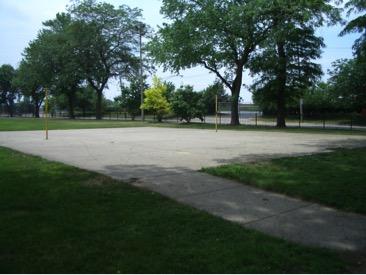
Multi-court.
| Small shelters were typically covered areas for picnics. These shelters varied in size (between 800 and 1,500 sq ft) and in features, but were always counted as one per zone. The dimensions for typical small shelters included a 30-ft × 30-ft shelter structure on a concrete pad, with a 6-ft × 50-ft concrete access walk, as a complete unit. Typical amenities included were grills, trash cans, and water fountains (or spigots). |
| Average size (sq ft) |
1,056.30 |
| Cost to construct |
$45,000 |
| Construction cost per sq ft |
$42.60 |
| Annual maintenance costs |
$4,500 |
| Total number of park users |
2,044 |
| Total number of observations |
341 |
| Park users per observation |
5.27 |
| Active EE (EE kcal/kg/hour) per user |
1.45 |
| Active EE (EE kcal/kg/hour) per observation |
8.66 |
| Active Energy Expenditure Cost (AEEC) rating |
2 |
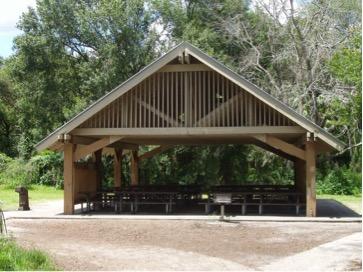
Medium shelter.
| Skate rinks were provided for roller skating and roller hockey activities. This type of facility varied in size (19,000 – 19,998 sq ft) and in features, but was always counted as one per zone. Rinks were located on post-tensioned concrete pads. |
| Average size (sq ft) |
19,332.67 |
| Cost to construct |
$120,000 |
| Construction cost per sq ft |
$6.21 |
| Annual maintenance costs |
$5,000 |
| Total number of park users |
34 |
| Total number of observations |
6 |
| Park users per observation |
5.67 |
| Active EE (EE kcal/kg/hour) per user |
1.37 |
| Active EE (EE kcal/kg/hour) per observation |
7.74 |
| Active Energy Expenditure Cost (AEEC) rating |
3 |
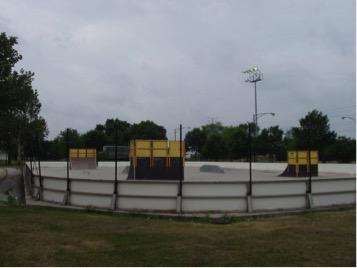
Skate rink.
| Medium-sized volleyball courts consisted of two standard courts with sand or grass surface, poles, and nets, with a safety zone. The sizes of medium volleyball courts ranged from 4,258 to 4,374 sq ft. |
| Average size (sq ft) |
4,309.00 |
| Cost to construct |
$100,000 |
| Construction cost per sq ft |
$23.21 |
| Annual maintenance costs |
$10,000 |
| Total number of park users |
55 |
| Total number of observations |
10 |
| Park users per observation |
5.50 |
| Active EE (EE kcal/kg/hour) per user |
1.39 |
| Active EE (EE kcal/kg/hour) per observation |
7.65 |
| Active Energy Expenditure Cost (AEEC) rating |
2 |
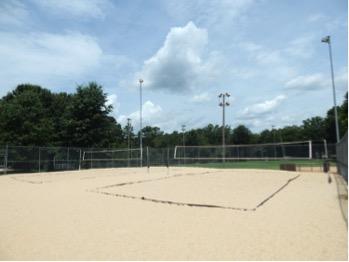
Medium volleyball court.
| Outdoor racquetball courts were facilities designed specifically for racquetball. Each individual facility contained six courts. The courts were marked and lined. Each standard court was 800 sq ft. (This zone type was found only in the Tampa, FL, parks system.) |
| Average size (sq ft) |
5,434.49 |
| Cost to construct |
$120,000 |
| Construction cost per sq ft |
$22.08 |
| Annual maintenance costs |
$1,500 |
| Total number of park users |
243 |
| Total number of observations |
83 |
| Park users per observation |
2.93 |
| Active EE (EE kcal/kg/hour) per user |
2.61 |
| Active EE (EE kcal/kg/hour) per observation |
7.64 |
| Active Energy Expenditure Cost (AEEC) rating |
3 |
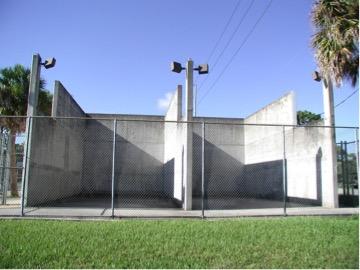
Racquetball courts.
| Small shelters were 24 ft × 24 ft in size and situated on a concrete pad with 6-ft × 50-ft concrete access walkways. Shelter and pad were considered together as a complete unit. Typical amenities included were grills and trash cans. |
| Average size (sq ft) |
589.11 |
| Cost to construct |
$25,000 |
| Construction cost per sq ft |
$42.44 |
| Annual maintenance costs |
$2,500 |
| Total number of park users |
1,854 |
| Total number of observations |
352 |
| Park users per observation |
5.27 |
| Active EE (EE kcal/kg/hour) per user |
1.39 |
| Active EE (EE kcal/kg/hour) per observation |
7.35 |
| Active Energy Expenditure Cost (AEEC) rating |
1 |
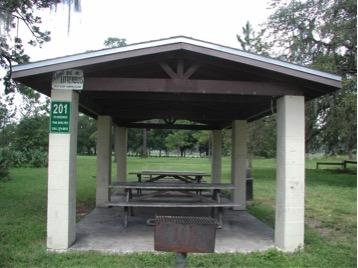
Small picnic shelter.
| Large playgrounds contained multiple areas and play sets. These typically included two to three swing sets, prefabricated play equipment, and custom play equipment (such as climbing structures, bridges, hanging apparatus, etc.). Safety surfacing was provided. Large playgrounds ranged from 10,110 to 31,135.11 sq ft in area. |
| Average size (sq ft) |
18,700.13 |
| Cost to construct |
$500,000 |
| Construction cost per sq ft |
$26.74 |
| Annual maintenance costs |
$25,000 |
| Total number of park users |
1,693 |
| Total number of observations |
441 |
| Park users per observation |
3.84 |
| Active EE (EE kcal/kg/hour) per user |
1.85 |
| Active EE (EE kcal/kg/hour) per observation |
7.09 |
| Active Energy Expenditure Cost (AEEC) rating |
3 |
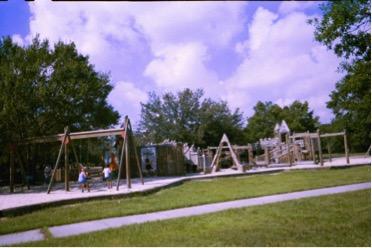
Large playground.
| Pools included facilities or an aquatics complex with a six- to eight-lane competition pool and a leisure pool with one or two water slides or lazy river. Each facility was considered as a complete zone. |
| Average size (sq ft) |
4,494.34 |
| Cost to construct |
$7,000,000 |
| Construction cost per sq ft |
$1,557.52 |
| Annual maintenance costs |
N/A |
| Total number of park users |
239 |
| Total number of observations |
68 |
| Park users per observation |
3.51 |
| Active EE (EE kcal/kg/hour) per user |
1.96 |
| Active EE (EE kcal/kg/hour) per observation |
6.87 |
| Active Energy Expenditure Cost (AEEC) rating |
5 |
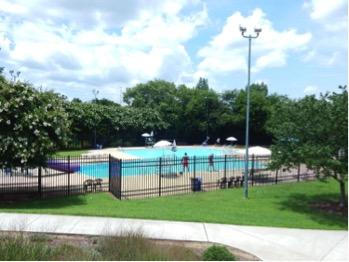
Swimming pool.
| Small softball/baseball fields included a single field with a backstop, grass or skinned (worn or bare soil) infield, and 150-ft foul lines. Bleachers and dugout facilities were generally not present. Small softball/baseball fields ranged between 6,384 and 27,840 sq ft. |
| Average size (sq ft) |
20,141.42 |
| Cost to construct |
$200,000 |
| Construction cost per sq ft |
$9.93 |
| Annual maintenance costs |
$10,000 |
| Total number of park users |
1,034 |
| Total number of observations |
250 |
| Park users per observation |
4.14 |
| Active EE (EE kcal/kg/hour) per user |
1.55 |
| Active EE (EE kcal/kg/hour) per observation |
6.42 |
| Active Energy Expenditure Cost (AEEC) rating |
4 |
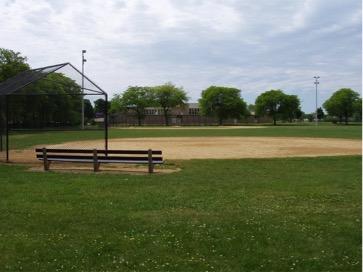
Small softball/baseball field.
| Medium-sized softball/baseball fields included a single field with backstop, perimeter chain-linked fencing, fenced dugouts, bleachers, skinned infields, and 200-ft foul lines. Lighting was present at some facilities. These areas ranged between 28,000 and 39,624 sq ft. |
| Average size (sq ft) |
33,546.39 |
| Cost to construct |
$300,000 |
| Construction cost per sq ft |
$8.94 |
| Annual maintenance costs |
$15,000 |
| Total number of park users |
830 |
| Total number of observations |
265 |
| Park users per observation |
3.13 |
| Active EE (EE kcal/kg/hour) per user |
2.59 |
| Active EE (EE kcal/kg/hour) per observation |
5.53 |
| Active Energy Expenditure Cost (AEEC) rating |
4 |
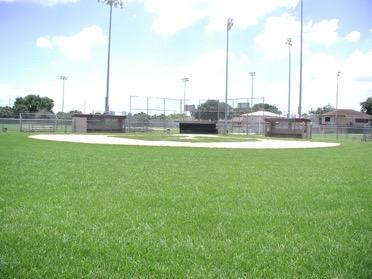
Medium softball/baseball field.
| Medium-sized playgrounds included a play structure and a set of swings. Swings had two or three seats. The structures were prefabricated and situated with a safety surface of approximately 85 ft in diameter. Sizes ranged between 4,162.79 and 9,271 sq ft. |
| Average size (sq ft) |
5,853.07 |
| Cost to construct |
$250,000 |
| Construction cost per sq ft |
$42.71 |
| Annual maintenance costs |
$12,500 |
| Total number of park users |
1,585 |
| Total number of observations |
566 |
| Park users per observation |
2.80 |
| Active EE (EE kcal/kg/hour) per user |
1.82 |
| Active EE (EE kcal/kg/hour) per observation |
5.08 |
| Active Energy Expenditure Cost (AEEC) rating |
4 |
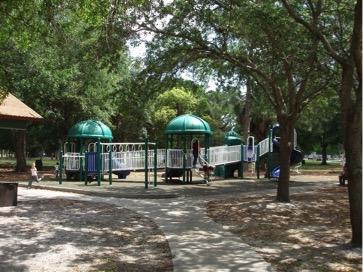
Medium playground.
| Basketball courts categorized as large included courts with five to six individual half-courts side by side or two full courts with asphalt or concrete surfaces. Large basketball courts ranged between 9,443 and 18,674.60 sq ft. |
| Average size (sq ft) |
12,588.38 |
| Cost to construct |
$60,000 |
| Construction cost per sq ft |
$4.77 |
| Annual maintenance costs |
$5,000 |
| Total number of park users |
340 |
| Total number of observations |
139 |
| Park users per observation |
2.45 |
| Active EE (EE kcal/kg/hour) per user |
2.05 |
| Active EE (EE kcal/kg/hour) per observation |
5.02 |
| Active Energy Expenditure Cost (AEEC) rating |
3 |
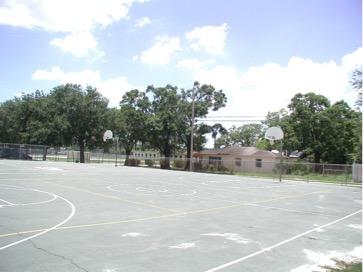
Large basketball courts.
| Medium-sized open areas were grassy areas without built features. Some areas exhibited evidence of infrequent mowing but were generally suitable for active uses (such as running, children playing, etc.) or passive uses (picnics, sitting, socializing). These areas were approximately 16,000 sq ft (126 ft × 126 ft) and ranged between 10,653 and 28,392 sq ft. |
| Average size (sq ft) |
16,334.78 |
| Cost to construct |
$25,000 |
| Construction cost per sq ft |
$1.53 |
| Annual maintenance costs |
$3,500 |
| Total number of park users |
1,229 |
| Total number of observations |
533 |
| Park users per observation |
2.31 |
| Active EE (EE kcal/kg/hour) per user |
2.04 |
| Active EE (EE kcal/kg/hour) per observation |
4.69 |
| Active Energy Expenditure Cost (AEEC) rating |
2 |
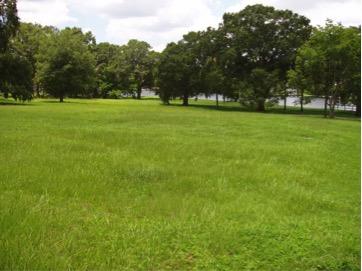
Medium open area.
| Large softball/baseball fields had multiple fields in a single complex. Parks had between four and 12 fields. Each single field included a backstop, perimeter fence, fenced dugouts with roofs, grandstand, bleachers, press-box, and 300-ft foul lines. Fields in this category ranged from 41,717.57 to 87,984 sq ft. |
| Average size (sq ft) |
61,086.22 |
| Cost to construct |
$400,000 |
| Construction cost per sq ft |
$6.55 |
| Annual maintenance costs |
$20,000 |
| Total number of park users |
715 |
| Total number of observations |
302 |
| Park users per observation |
2.37 |
| Active EE (EE kcal/kg/hour) per user |
1.96 |
| Active EE (EE kcal/kg/hour) per observation |
4.64 |
| Active Energy Expenditure Cost (AEEC) rating |
4 |
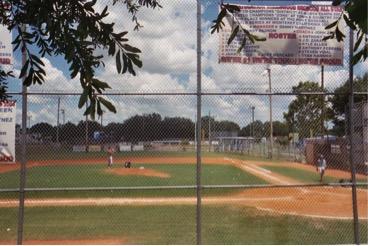
Large softball/baseball field.
| Large shelters provide cover for picnic tables and ranged between 2,108.14 and 32,160 sq ft in size. A typical large shelter included a 70-ft × 70-ft shelter situated on a concrete pad, with a 6-ft × 50-ft concrete access walkway. Typical amenities included with large shelters were water fountains, multiple grills, and trash cans. |
| Average size (sq ft) |
5,284.92 |
| Cost to construct |
$100,000 |
| Construction cost per sq ft |
$18.92 |
| Annual maintenance costs |
$10,000 |
| Total number of park users |
864 |
| Total number of observations |
270 |
| Park users per observation |
3.20 |
| Active EE (EE kcal/kg/hour) per user |
1.38 |
| Active EE (EE kcal/kg/hour) per observation |
4.42 |
| Active Energy Expenditure Cost (AEEC) rating |
3 |
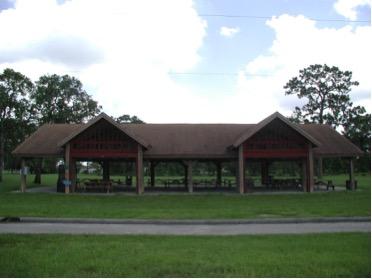
Large shelter.
| Small tennis court facilities consisted of one to three courts in one zone. One court with net, fence, and surfacing is considered to be 7,200 sq ft. Typical features included with courts were benches, lighting fixtures, and trash cans. Small tennis courts zones ranged between 1,920 and 23,718 sq ft. |
| Average size (sq ft) |
16,308.65 |
| Cost to construct |
$90,000 |
| Construction cost per sq ft |
$5.52 |
| Annual maintenance costs |
$7,500 |
| Total number of park users |
352 |
| Total number of observations |
161 |
| Park users per observation |
2.19 |
| Active EE (EE kcal/kg/hour) per user |
1.60 |
| Active EE (EE kcal/kg/hour) per observation |
3.50 |
| Active Energy Expenditure Cost (AEEC) rating |
3 |
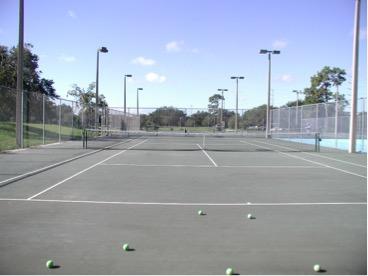
Small tennis courts.
| Medium-sized tennis courts zones consisted of four to six courts. Each set of courts was treated as one zone. Typical features included with courts were benches, lighting, and trash cans. Medium tennis court zones ranged between 24,804 and 39,624 sq ft. Each complete set of four courts assumes the 28,972 sq ft size. |
| Average size (sq ft) |
28,972.81 |
| Cost to construct |
$180,000 |
| Construction cost per sq ft |
$6.21 |
| Annual maintenance costs |
$15,000 |
| Total number of park users |
341 |
| Total number of observations |
183 |
| Park users per observation |
1.86 |
| Active EE (EE kcal/kg/hour) per user |
1.80 |
| Active EE (EE kcal/kg/hour) per observation |
3.36 |
| Active Energy Expenditure Cost (AEEC) rating |
4 |
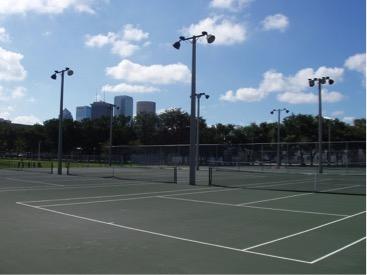
Medium tennis courts.
| Small basketball court zones ranged from a stand-alone half court with one rim to one full court with two rims with asphalt or concrete surfacing. These zones ranged between 460 and 4,085 sq ft in size. |
| Average size (sq ft) |
2,884.36 |
| Cost to construct |
$15,000 |
| Construction cost per sq ft |
$5.20 |
| Annual maintenance costs |
$2,500 |
| Total number of park users |
268 |
| Total number of observations |
177 |
| Park users per observation |
1.51 |
| Active EE (EE kcal/kg/hour) per user |
2.15 |
| Active EE (EE kcal/kg/hour) per observation |
3.25 |
| Active Energy Expenditure Cost (AEEC) rating |
2 |
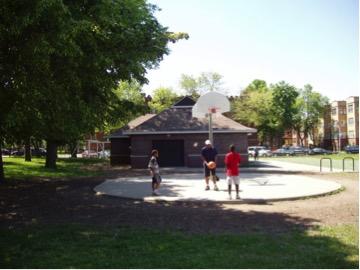
Small basketball courts.
| Medium-sized basketball courts zones included two to four courts, half-courts, or full courts, with asphalt or concrete surfacing. These ranged between 5,400 and 8,033.74 sq ft in size. |
| Average size (sq ft) |
6,984.56 |
| Cost to construct |
$30,000 |
| Construction cost per sq ft |
$4.30 |
| Annual maintenance costs |
$2,500 |
| Total number of park users |
202 |
| Total number of observations |
191 |
| Park users per observation |
1.06 |
| Active EE (EE kcal/kg/hour) per user |
2.45 |
| Active EE (EE kcal/kg/hour) per observation |
2.59 |
| Active Energy Expenditure Cost (AEEC) rating |
2 |
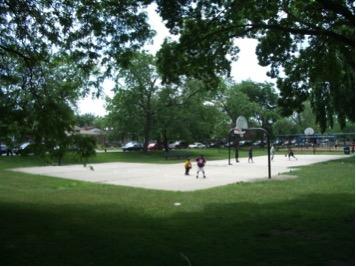
Medium basketball courts.
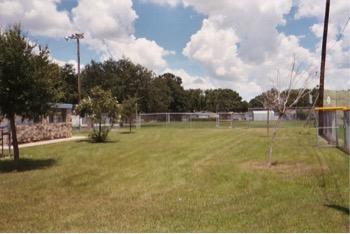
| Small open area zones consisted of a grassy area with no built features. In some cases fencing was present. Such zones ranged between 651.75 and 9,682.14 sq ft. These were typically 70 ft × 70 ft, showed signs of frequent mowing, and included irrigation. |
| Average size (sq ft) |
4,914.20 |
| Cost to construct |
$7,500 |
| Construction cost per sq ft |
$1.53 |
| Annual maintenance costs |
$1,200 |
| Total number of park users |
427 |
| Total number of observations |
326 |
| Park users per observation |
1.31 |
| Active EE (EE kcal/kg/hour) per user |
1.96 |
| Active EE (EE kcal/kg/hour) per observation |
2.57 |
| Active Energy Expenditure Cost (AEEC) rating |
2 |
Small open area.
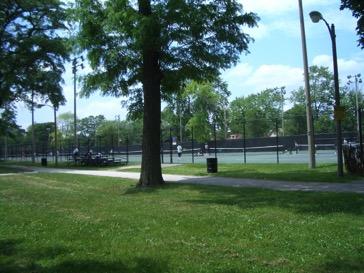
| Large tennis court zones had greater than six courts. One park had two sets of eight courts (16 total) divided by a tall fence. Courts typically included fencing, painted asphalt surfacing, bleachers, and lighting. Eight courts are considered standard for a tournament facility. Large tennis court zones ranged from 47,957 to 82,600 sq ft in size. Cost does not include restroom and other support facilities. |
| Average size (sq ft) |
56,211.12 |
| Cost to construct |
$270,000 |
| Construction cost per sq ft |
$4.80 |
| Annual maintenance costs |
$25,000 |
| Total number of park users |
152 |
| Total number of observations |
136 |
| Park users per observation |
1.12 |
| Active EE (EE kcal/kg/hour) per user |
1.82 |
| Active EE (EE kcal/kg/hour) per observation |
2.03 |
| Active Energy Expenditure Cost (AEEC) rating |
4 |
Large tennis courts.
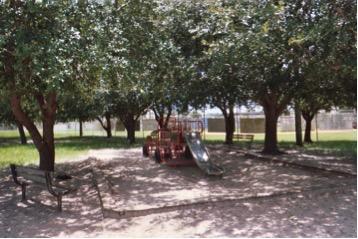
| Small playgrounds typically had one prefabricated playground structure or one set of swings. Swings had two or three sets with safety surfacing (such as sand, wood chips, etc.). These ranged between 333.02 and 3,744 sq ft in size. |
| Average size (sq ft) |
1,987.11 |
| Cost to construct |
$100,000 |
| Construction cost per sq ft |
$50.32 |
| Annual maintenance costs |
$5,000 |
| Total number of park users |
526 |
| Total number of observations |
548 |
| Park users per observation |
0.96 |
| Active EE (EE kcal/kg/hour) per user |
2.00 |
| Active EE (EE kcal/kg/hour) per observation |
1.92 |
| Active Energy Expenditure Cost (AEEC) rating |
4 |
Small playground.
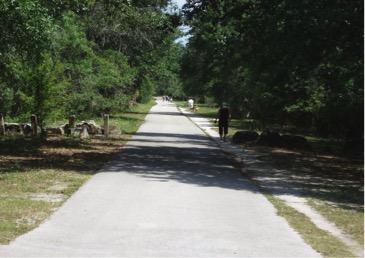
| Trails considered large were 8-ft-wide concrete paths and 1 mile long (lineal foot of trail and improvements or 5,280 linear feet). |
| Average size (sq ft) |
41,768.61 |
| Cost to construct |
$150,000 |
| Construction cost per sq ft |
$3.59 |
| Annual maintenance costs |
$0.50 |
| Total number of park users |
76 |
| Total number of observations |
137 |
| Park users per observation |
0.55 |
| Active EE (EE kcal/kg/hour) per user |
3.33 |
| Active EE (EE kcal/kg/hour) per observation |
1.85 |
| Active Energy Expenditure Cost (AEEC) rating |
5 |
Large trail.
| Large open spaces were areas of approximately of 58,000 sq ft (240 ft × 240 ft). These areas were mowed infrequently and supported active (such as running, children playing, etc.) or passive uses (picnics, sitting, socializing). |
| Average size (sq ft) |
58,348.85 |
| Cost to construct |
$90,000 |
| Construction cost per sq ft |
$1.54 |
| Annual maintenance costs |
$15,000 |
| Total number of park users |
458 |
| Total number of observations |
433 |
| Park users per observation |
1.06 |
| Active EE (EE kcal/kg/hour) per user |
1.75 |
| Active EE (EE kcal/kg/hour) per observation |
1.85 |
| Active Energy Expenditure Cost (AEEC) rating |
4 |
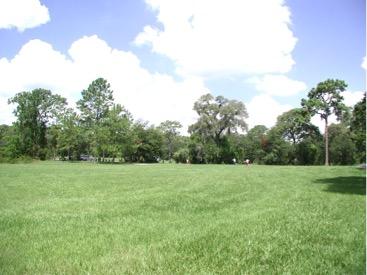
Large open area.
| Medium soccer zones varied in size (22,000 – 61,200 sq ft) and in features, but were always counted as one per zone. These zones ranged from an open area with painted lines to a full field with goal posts, either situated apart from other fields or facilities or located inside a track. They supported adult regulation play. |
| Average size (sq ft) |
25,221.43 |
| Cost to construct |
$75,000 |
| Construction cost per sq ft |
$2.97 |
| Annual maintenance costs |
$15,000 |
| Total number of park users |
54 |
| Total number of observations |
63 |
| Park users per observation |
0.86 |
| Active EE (EE kcal/kg/hour) per user |
2.01 |
| Active EE (EE kcal/kg/hour) per observation |
1.73 |
| Active Energy Expenditure Cost (AEEC) rating |
4 |
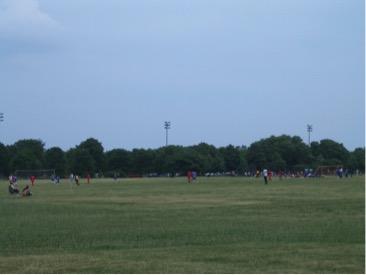
Medium soccer field.
| Small picnic areas included a picnic table on a concrete pad, trash receptacle, and 6-ft × 50-ft concrete access walk. Each table, pad, receptacle, and access walk was considered as a complete assembly unit. |
| Average size (sq ft) |
987.80 |
| Cost to construct |
$4,000 |
| Construction cost per sq ft |
$4.05 |
| Annual maintenance costs |
$500 |
| Total number of park users |
69 |
| Total number of observations |
90 |
| Park users per observation |
0.77 |
| Active EE (EE kcal/kg/hour) per user |
1.96 |
| Active EE (EE kcal/kg/hour) per observation |
1.50 |
| Active Energy Expenditure Cost (AEEC) rating |
3 |
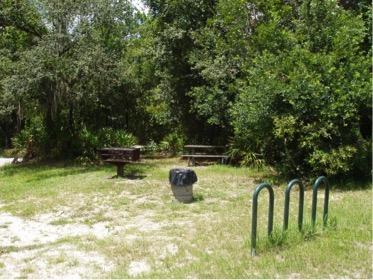
Small picnic area.
| Large picnic areas typically included 12 picnic tables on a large pad with trash receptacles and a 6-ft × 50-ft concrete access walk. Each set of tables, pad, receptacles, and walk was considered as a complete assembly unit. |
| Average size (sq ft) |
20,943.78 |
| Cost to construct |
$30,000 |
| Construction cost per sq ft |
$1.43 |
| Annual maintenance costs |
$5,000 |
| Total number of park users |
97 |
| Total number of observations |
93 |
| Park users per observation |
1.04 |
| Active EE (EE kcal/kg/hour) per user |
1.12 |
| Active EE (EE kcal/kg/hour) per observation |
1.17 |
| Active Energy Expenditure Cost (AEEC) rating |
3 |
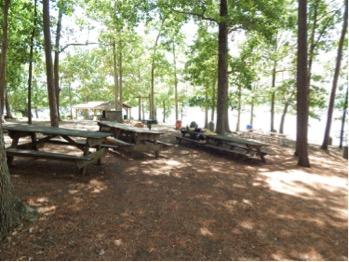
Large picnic area.
| Only one such zone was present—a colored concrete walkway with custom scoring pattern and/or stamped or sandblasted graphics. The assumed size of this zone was 13,299 sq ft. |
| Average size (sq ft) |
13,228.96 |
| Cost to construct |
$79,794 |
| Construction cost per sq ft |
$6.03 |
| Annual maintenance costs |
Varies |
| Total number of park users |
30 |
| Total number of observations |
30 |
| Park users per observation |
1 |
| Active EE (EE kcal/kg/hour) per user |
1.09 |
| Active EE (EE kcal/kg/hour) per observation |
1.09 |
| Active Energy Expenditure Cost (AEEC) rating |
4 |
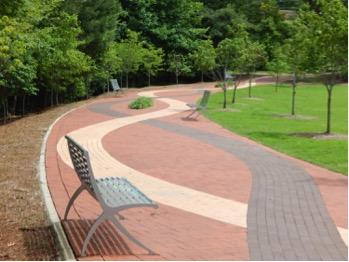
Color design – walkway.
| Large volleyball courts varied in size (4,956 – 12,733 sq ft) and in features, but were always counted as one per zone. Four standard courts with sand surface, poles, and nets were included. One complete set of four courts is 8,844 sq ft and assumes four standard courts, each with a safety zone. |
| Average size (sq ft) |
8,844.50 |
| Cost to construct |
$200,000 |
| Construction cost per sq ft |
$22.61 |
| Annual maintenance costs |
$20,000 |
| Total number of park users |
11 |
| Total number of observations |
8 |
| Park users per observation |
1.38 |
| Active EE (EE kcal/kg/hour) per user |
0.75 |
| Active EE (EE kcal/kg/hour) per observation |
1.04 |
| Active Energy Expenditure Cost (AEEC) rating |
5 |
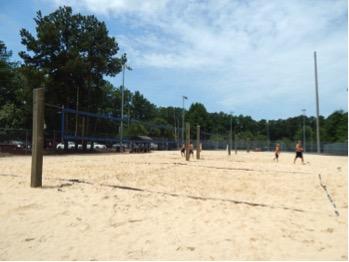
Large volleyball courts.
| Exercise areas included standard steel fitness course equipment with six stations. Each six-station course combined was considered as one zone. Size of area is not really as much a factor in cost as the type and amount of equipment. |
| Average size (sq ft) |
992.31 |
| Cost to construct |
$20,000 |
| Construction cost per sq ft |
$20.15 |
| Annual maintenance costs |
$375 |
| Total number of park users |
108 |
| Total number of observations |
88 |
| Park users per observation |
1.23 |
| Active EE (EE kcal/kg/hour) per user |
0.74 |
| Active EE (EE kcal/kg/hour) per observation |
0.91 |
| Active Energy Expenditure Cost (AEEC) rating |
3 |
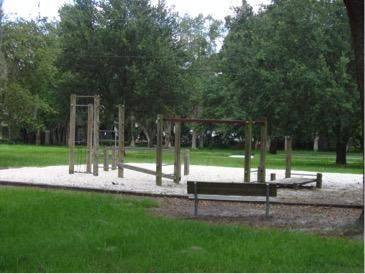
Exercise area.
| Medium trails were 6-ft-wide concrete paths with drainage improvements. These zones were lineal foot of trail and improvements size of approximately 8,354 sq ft, assuming a 6-ft-wide concrete path and a ¼-mile length (1,320 linear ft). |
| Average size (sq ft) |
8,354.09 |
| Cost to construct |
$30,000 |
| Construction cost per sq ft |
$3.59 |
| Annual maintenance costs |
$0.40 |
| Total number of park users |
76 |
| Total number of observations |
222 |
| Park users per observation |
0.34 |
| Active EE (EE kcal/kg/hour) per user |
2.17 |
| Active EE (EE kcal/kg/hour) per observation |
0.74 |
| Active Energy Expenditure Cost (AEEC) rating |
4 |
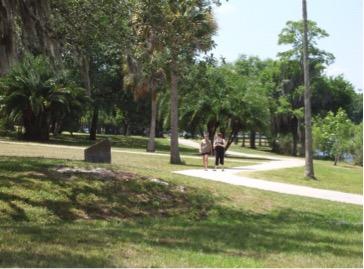
Medium trail.
| Medium-sized picnic areas varied in size (3,288.82 – 9,317.78 sq ft) and in features but were always counted as one per zone. These typically consisted of four picnic tables on single or multiple concrete pads, two trash receptacles, and a 6-ft × 50-ft concrete access walk. |
| Average size (sq ft) |
6,671.34 |
| Cost to construct |
$9,000 |
| Construction cost per sq ft |
$1.35 |
| Annual maintenance costs |
$1,500 |
| Total number of park users |
28 |
| Total number of observations |
93 |
| Park users per observation |
0.30 |
| Active EE (EE kcal/kg/hour) per user |
1.36 |
| Active EE (EE kcal/kg/hour) per observation |
0.41 |
| Active Energy Expenditure Cost (AEEC) rating |
3 |
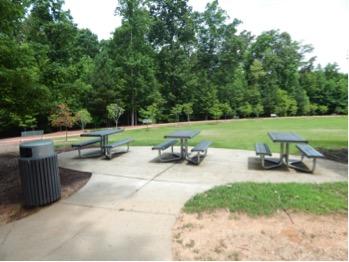
Medium picnic area.
| Trails regarded as small were 3-ft-wide soft-surface trails with drainage improvements. Their lineal foot of trail and improvements zone size was 2,966 sq ft (assuming a 3-ft-wide soft-surface trail, 1,000 ft in length). |
| Average size (sq ft) |
2,966.45 |
| Cost to construct |
$10,000 |
| Construction cost per sq ft |
$3.37 |
| Annual maintenance costs |
$0.30 |
| Total number of park users |
68 |
| Total number of observations |
337 |
| Park users per observation |
0.20 |
| Active EE (EE kcal/kg/hour) per user |
1.76 |
| Active EE (EE kcal/kg/hour) per observation |
0.36 |
| Active Energy Expenditure Cost (AEEC) rating |
3 |
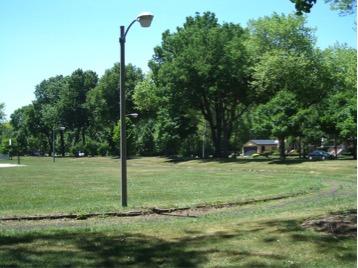
Small trail.
| An amphitheatre is a .75 acre pie-shaped grassy area with a 450 sq ft concrete pad for a stage, and no lighting, electrical work, canopy, or furnishings. |
| Average size (sq ft) |
3,214.92 |
| Cost to construct |
$50,000 |
| Construction cost per sq ft |
$15.55 |
| Annual maintenance costs |
$5,000 |
| Total number of park users |
0 |
| Total number of observations |
26 |
| Park users per observation |
0 |
| Active EE (EE kcal/kg/hour) per user |
0.00 |
| Active EE (EE kcal/kg/hour) per observation |
0.00 |
| Active Energy Expenditure Cost (AEEC) rating |
4 |
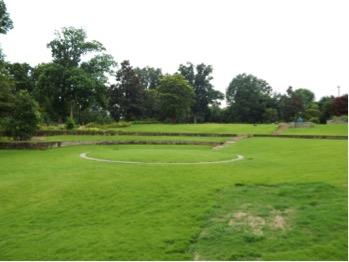
Amphitheater.
| One handball court was observed. Standard size per court is 800 sq ft. Each court cone was not priced. Size as described would hold about 16 courts. |
| Average size (sq ft) |
13,914.49 |
| Cost to construct |
$20,000 |
| Construction cost per sq ft |
$1.44 |
| Annual maintenance costs |
$10,000 |
| Total number of park users |
0 |
| Total number of observations |
32 |
| Park users per observation |
0 |
| Active EE (EE kcal/kg/hour) per user |
0.00 |
| Active EE (EE kcal/kg/hour) per observation |
0.00 |
| Active Energy Expenditure Cost (AEEC) rating |
3 |
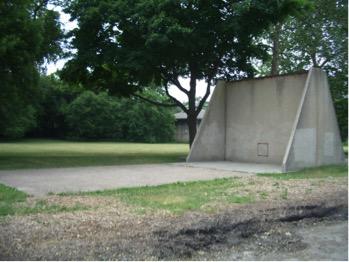
Handball court.
| One shuffleboard court was observed. It included a standard concrete court with painted lines. One standard court was 312 sq ft, assuming a 576 sq ft zone is for two courts. |
| Average size (sq ft) |
576.00 |
| Cost to construct |
$3,000 |
| Construction cost per sq ft |
$5.21 |
| Annual maintenance costs |
$750 |
| Total number of park users |
0 |
| Total number of observations |
12 |
| Park users per observation |
0 |
| Active EE (EE kcal/kg/hour) per user |
0.00 |
| Active EE (EE kcal/kg/hour) per observation |
0.00 |
| Active Energy Expenditure Cost (AEEC) rating |
3 |
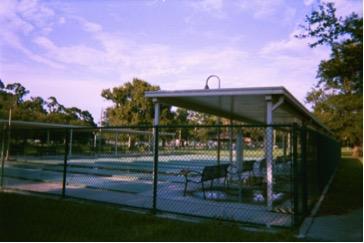
Shuffleboard court.
Table 3. National Average Cost Overview of Park Facilities
| Facility Type |
Mean Size of Observed Park Activity Zones (sq ft) |
Construction Cost Estimate |
Annual Maintenance Cost Estimate |
| Amphitheater |
3,214.92 |
$53,419 |
$5,342 |
| Basketball |
|
|
|
| Large |
12,588.38 |
$64,103 |
$5,342 |
| Medium |
6,984.56 |
$32,051 |
$2,671 |
| Small |
2,884.36 |
$16,026 |
$2,671 |
| Color Design/Walkway |
13,228.96 |
$85,250 |
|
| Exercise Area |
992.31 |
$21,368 |
$401 |
| Football Area |
58,718.00 |
$106,838 |
$16,026 |
| Handball Court |
13,914.49 |
$10,684 |
$10,684 |
| Multi-court Purpose |
6,215.00 |
$21,368 |
$2,671 |
| Open Area |
|
|
|
| Large |
58,346.85 |
$96,154 |
$16,026 |
| Medium |
16,334.78 |
$26,709 |
$3,739 |
| Small |
4,914.20 |
$8,013 |
$1,282 |
| Picnic Area |
|
|
|
| Large |
20,943.78 |
$32,051 |
$5,342 |
| Medium |
6,671.34 |
$9,615 |
$1,603 |
| Small |
987.80 |
$4,274 |
$534 |
| Playgrounds |
|
|
|
| Large |
18,700.13 |
$534,188 |
$26,709 |
| Medium |
5,853.07 |
$267,094 |
$13,355 |
| Small |
1,987.11 |
$106,838 |
$5,342 |
| Swimming Pool |
4,494.34 |
$7,478,632 |
|
| Racquetball Courts |
5,434.49 |
$128,205 |
$1,603 |
| Rink/skate |
19,332.67 |
$128,205 |
$5,342 |
| Shelters |
|
|
|
| Large |
5,284.92 |
$106,838 |
$10,684 |
| Medium |
1,056.30 |
$48,077 |
$4,808 |
| Small |
589.11 |
$26,709 |
$2,671 |
| Shuffleboard Courts |
576 |
$3,205 |
$801 |
| Soccer Field |
|
|
|
| Large |
77,652.41 |
$122,863 |
$21,368 |
| Medium |
25,221.43 |
$80,128 |
$16,026 |
| Small |
20,648.18 |
$42,735 |
$8,013 |
| Softball/Baseball Field |
|
|
|
| Large |
61,086.22 |
$427,350 |
$21,368 |
| Medium |
33,546.39 |
$320,513 |
$16,026 |
| Small |
20,141.42 |
$213,675 |
$10,684 |
| Tennis Courts |
|
|
|
| Large |
56,211.12 |
$288,462 |
$26,709 |
| Medium |
28,972.81 |
$192,308 |
$16,026 |
| Small |
16,308.65 |
$96,154 |
$8,013 |
| Track |
22,657.28 |
$427,350 |
$64,103 |
| Trail |
|
|
|
| Large |
41,768.61 |
$160,256 |
$0.53 |
| Medium |
8,354.09 |
$32,051 |
$0.43 |
| Small |
2,966.45 |
$10,684 |
$0.32 |
| Volleyball Court |
|
|
|
| Large |
8,844.50 |
$213,675 |
$21,368 |
| Medium |
4,309.00 |
$106,838 |
$10,684 |
| Small |
2,651.33 |
$53,419 |
$5,342 |
| Source: RSMeans Engineering staff. (2012). Building construction cost data. Kingston, MA: Gordion Group, Inc. |
Table 4. Tampa, FL, Cost Overview of Park Facilities
| Facility Type |
Mean Size of Observed Park Activity Zones (sq. ft.) |
Construction Cost Estimate |
Annual Maintenance Cost Estimate |
| Amphitheater |
3,214.92 |
$48,825 |
$4,882 |
| Basketball |
|
|
|
| Large |
12,588.38 |
$58,590 |
$4,882 |
| Medium |
6,984.56 |
$29,295 |
$2,441 |
| Small |
2,884.36 |
$14,647 |
$2,441 |
| Color Design/Walkway |
13,228.96 |
$77,919 |
|
| Exercise Area |
992.31 |
$19,530 |
$366 |
| Football Field |
58,718.00 |
$97,650 |
$14,647 |
| Handball Court |
13,914.49 |
$9,765 |
$9,765 |
| Multi-purpose Courts |
6,215.00 |
$19,530 |
$2,441 |
| Open Area |
|
|
|
| Large |
58,346.85 |
$87,885 |
$14,647 |
| Medium |
16,334.78 |
$24,412 |
$3,418 |
| Small |
4,914.20 |
$7,324 |
$1,172 |
| Picnic Area |
|
|
|
| Large |
20,943.78 |
$29,295 |
$4,882 |
| Medium |
6,671.34 |
$8,788 |
$1,465 |
| Small |
987.8 |
#3,906 |
$488 |
| Playgrounds |
|
|
|
| Large |
18,700.13 |
$488,248 |
$24,412 |
| Medium |
5,853.07 |
$244,124 |
$12,206 |
| Small |
1,987.11 |
$97,650 |
$4,882 |
| Swimming Pool |
4,494.34 |
$6,835,470 |
|
| Racquetball Courts |
5,434.49 |
$117,179 |
$1,465 |
| Rink/skate |
19,332.67 |
$117,179 |
$4,882 |
| Shelters |
|
|
|
| Large |
5,284.92 |
$97,650 |
$9,765 |
| Medium |
1,056.30 |
$43,942 |
$4,394 |
| Small |
589.11 |
$24,412 |
$2,441 |
| Shufleboard Courts |
576 |
$2,929 |
$732 |
| Soccer Field |
|
|
|
| Large |
77,652.41 |
$112,297 |
$19,530 |
| Medium |
25,221.43 |
$73,237 |
$14,647 |
| Small |
20,648.18 |
$39,060 |
$7,324 |
| Softball/Baseball Field |
|
|
|
| Large |
61,086.22 |
$390,598 |
$19,530 |
| Medium |
33,546.39 |
$292,949 |
$14,647 |
| Small |
20,141.42 |
$195,299 |
$9,765 |
| Tennis Courts |
|
|
|
| Large |
56,211.12 |
$263,654 |
$24,412 |
| Medium |
28,972.81 |
$175,769 |
$14,647 |
| Small |
16,308.65 |
$87,885 |
$7,324 |
| Track |
22,657.28 |
$390,598 |
$58,590 |
| Trail |
|
|
|
| Large |
41,768.61 |
$146,474 |
$0.49 |
| Medium |
8,354.09 |
$29,295 |
$0.39 |
| Small |
2,966.45 |
$9,765 |
$0.29 |
| Volleyball Court |
|
|
|
| Large |
8,844.50 |
$195,299 |
$19,530 |
| Medium |
4,309.00 |
$97,650 |
$9,765 |
| Small |
2,651.33 |
$48,825 |
$4,882 |
| Source: RSMeans Engineering staff (2012). Building construction cost data. Kingston, MA: Gordion Group, Inc. |
Table 5. Chicago, IL, Cost Overview of Park Facilities
| Facility Type |
Mean Size of Observed Park Activity Zones (sq. ft.) |
Construction Cost Estimate |
Annual Maintenance Cost Estimate |
| Amphitheater |
3,214.92 |
$62,233 |
$6,223 |
| Basketball |
|
|
|
| Large |
12,588.38 |
$74,679 |
$6,223 |
| Medium |
6,984.56 |
$37,340 |
$3,112 |
| Small |
2,884.36 |
$18,670 |
$3,112 |
| Color Design/Walkway |
13,228.96 |
$99,316 |
|
| Exercise Area |
992.31 |
$24,893 |
$467 |
| Football Field |
58,718.00 |
$124,466 |
$18,670 |
| Handball Court |
13,914.49 |
$12,447 |
$12,447 |
| Multi-purpose Courts |
6,215.00 |
$24,893 |
$3,112 |
| Open Area |
|
|
|
| Large |
58,346.78 |
$112,019 |
$18,670 |
| Medium |
16,334.78 |
$31,116 |
$4,356 |
| Small |
4,914.20 |
$9,335 |
$1,494 |
| Picnic Area |
|
|
|
| Large |
20,943.78 |
$37,340 |
$6,223 |
| Medium |
6,671.34 |
$11,202 |
$1,867 |
| Small |
987.80 |
$4,979 |
$622 |
| Playgrounds |
|
|
|
| Large |
18,700.13 |
$622,329 |
$31,116 |
| Medium |
5,853.07 |
$311,165 |
$15,558 |
| Small |
1,987.11 |
$124,466 |
$6,223 |
| Swimming Pool |
4,494.34 |
$8,712,607 |
|
| Racquetball Courts |
5,434.49 |
$149,359 |
$1,867 |
| Rink/skate |
19,332.67 |
$149,359 |
$6,223 |
| Shelters |
|
|
|
| Large |
5,284.92 |
$124,466 |
$12,447 |
| Medium |
1,056.30 |
$56,010 |
$5,601 |
| Small |
589.11 |
$31,116 |
$3,112 |
| Shuffleboard Courts |
576 |
$3,734 |
$933 |
| Soccer Field |
|
|
|
| Large |
77,652.41 |
$143,136 |
$24,893 |
| Medium |
25,221.43 |
$93,349 |
$18,670 |
| Small |
20,648.18 |
$49,786 |
$9,335 |
| Softball/Baseball Field |
|
|
|
| Large |
61,086.22 |
$497,863 |
$24,893 |
| Medium |
33,546.39 |
$373,397 |
$18,670 |
| Small |
20,141.42 |
$248,932 |
$12,447 |
| Tennis Courts |
|
|
|
| Large |
56,211.12 |
$336,058 |
$31,116 |
| Medium |
28,972.81 |
$224,038 |
$18,670 |
| Small |
16,308.65 |
$112,019 |
$9,335 |
| Track |
22,657.28 |
$497,863 |
$74,679 |
| Trail |
|
|
|
| Large |
41,768.61 |
$186,699 |
$0.62 |
| Medium |
8,354.09 |
$37,340 |
$0.50 |
| Small |
2,966.45 |
$12,447 |
$0.37 |
| Volleyball Court |
|
|
|
| Large |
8,844.50 |
$238,932 |
$24,893 |
| Medium |
4,309.00 |
$124,466 |
$12,447 |
| Small |
2,651.33 |
$62,233 |
$6,233 |
| Source: RSMeans Engineering staff. (2012). Building construction cost data. Kingston, MA: Gordion Group, Inc. |
Table 6. Durham, NC, Cost Overview of Park Facilities
| Facility Type |
Mean Size of Observed Park Activity Zones (sq ft) |
Construction Cost Estimate |
Annual Maintenance Cost Estimate |
| Amphitheater |
3,214.92 |
$42,682 |
$4,268 |
| Basketball |
|
|
|
| Large |
12,588.38 |
$51,218 |
$4,268 |
| Medium |
6,984.56 |
$25,609 |
$2,134 |
| Small |
2,884.36 |
$12,804 |
$2,134 |
| Color Design/Walkway |
13,228.96 |
$68,115 |
|
| Exercise Area |
992.31 |
$17,073 |
$320 |
| Football Field |
58,718.00 |
$85,363 |
$12,804 |
| Handball Court |
13,914.49 |
$8,536 |
$8,536 |
| Multi-purpose Courts |
6,215.00 |
$17,073 |
$2,134 |
| Open Area |
|
|
|
| Large |
58,346.85 |
$76,827 |
$12,804 |
| Medium |
16,334.78 |
$21,341 |
$2,988 |
| Small |
4,914.20 |
$6,402 |
$1,024 |
| Picnic Area |
|
|
|
| Large |
20,943.78 |
$25,609 |
$4,268 |
| Medium |
6,671.34 |
$7,683 |
$1,280 |
| Small |
987.80 |
$3,415 |
$427 |
| Playgrounds |
|
|
|
| Large |
18,700.13 |
$426,816 |
$21,341 |
| Medium |
5,853.07 |
$213,408 |
$10,670 |
| Small |
1,987.11 |
$85,363 |
$4,268 |
| Swimming Pool |
4,494.34 |
$5,975,427 |
|
| Racquetball Courts |
5,434.49 |
$102,436 |
$1,280 |
| Rink/Skate |
19,332.67 |
$102,436 |
$4,268 |
| Shelters |
|
|
|
| Large |
5,284.92 |
$85,363 |
$8,536 |
| Medium |
1,056.30 |
$38,413 |
$3,841 |
| Small |
589.11 |
$21,341 |
$2,134 |
| Shuffleboard Courts |
576 |
$2,561 |
$640 |
| Soccer Field |
|
|
|
| Large |
77,652.41 |
$98,168 |
$17,073 |
| Medium |
25,221.43 |
$64,022 |
$12,804 |
| Small |
20,648.18 |
$34,145 |
$6,402 |
| Softball/Baseball Field |
|
|
|
| Large |
61,086.22 |
$341,453 |
$17,073 |
| Medium |
33,546.39 |
$256,090 |
$12,804 |
| Small |
20,141.42 |
$170,726 |
$8,536 |
| Tennis Courts |
|
|
|
| Large |
56,211.12 |
$230,481 |
$21,341 |
| Medium |
28,972.81 |
$153,654 |
$12,804 |
| Small |
16,308.65 |
$76,827 |
$6,402 |
| Track |
22,657.28 |
$341,453 |
$51,218 |
| Trail |
|
|
|
| Large |
41,768.61 |
$128,045 |
$0.43 |
| Medium |
8,354.09 |
$25,609 |
$0.34 |
| Small |
2,966.45 |
$8,536 |
$0.26 |
| Volleyballl Court |
|
|
|
| Large |
8,844.50 |
$170,726 |
$17,073 |
| Medium |
4,309.00 |
$85,363 |
$8,536 |
| Small |
2,651.33 |
$42,682 |
$4,268 |
| Source: RSMeans Engineering staff. (2012). Building construction data. Kinston, MA: Gordion Group, Inc. |
Table 7. Park Zones Ranked by Cost-Active Energy Expenditure (EE) per Zone
| Zone Name |
Cost |
Cost (recoded) |
Active EE (kcal/kg/hr) |
Active EE (recoded) |
AEE-Cost Ratio (recoded) |
| Shelter—Small |
$25,000 |
1 |
7.35 |
1 |
1 |
| Multi-court |
$20,000 |
1 |
9.45 |
1 |
1 |
| Open Area—Small |
$7,500 |
1 |
2.57 |
2 |
2 |
| Basketball—Medium |
$30,000 |
1 |
2.59 |
2 |
2 |
| Basketball—Small |
$15,000 |
1 |
3.25 |
2 |
2 |
| Open Area—Medium |
$25,000 |
1 |
4.69 |
2 |
2 |
| Volleyball—Medium |
$100,000 |
2 |
7.65 |
1 |
2 |
| Shelter—Medium |
$45,000 |
2 |
8.66 |
1 |
2 |
| Volleyball—Small |
$50,000 |
2 |
9.60 |
1 |
2 |
| Soccer—Small |
$40,000 |
2 |
12.39 |
1 |
2 |
| Football |
$100,000 |
2 |
35.93 |
1 |
2 |
| Shuffleboard |
$3,000 |
1 |
0.00 |
3 |
3 |
| Handball |
$10,000 |
1 |
0.00 |
3 |
3 |
| Trail—Small |
$10,000 |
1 |
0.36 |
3 |
3 |
| Picnic Area—Medium |
$9,000 |
1 |
0.41 |
3 |
3 |
| Exercise Area—Small |
$20,000 |
1 |
0.91 |
3 |
3 |
| Picnic Area—Large |
$30,000 |
1 |
1.17 |
3 |
3 |
| Picnic Area—Small |
$4,000 |
1 |
1.50 |
3 |
3 |
| Tennis—Small |
$90,000 |
2 |
3.50 |
2 |
3 |
| Shelter—Large |
$100,000 |
2 |
4.42 |
2 |
3 |
| Basketball—Large |
$60,000 |
2 |
5.02 |
2 |
3 |
| Playground—Large |
$500,000 |
3 |
7.09 |
1 |
3 |
| Racquetball |
$120,000 |
3 |
7.64 |
1 |
3 |
| Rink/Skate |
$120,000 |
3 |
7.74 |
1 |
3 |
| Track |
$400,000 |
3 |
14.77 |
1 |
3 |
| Soccer—Large |
$115,000 |
2 |
16.01 |
1 |
3 |
| Amphitheater |
$50,000 |
2 |
0.00 |
3 |
4 |
| Trail—Medium |
$30,000 |
1 |
0.74 |
3 |
4 |
| Color Design/Walkway |
$79,794 |
2 |
1.09 |
3 |
4 |
| Soccer—Medium |
$75,000 |
2 |
1.73 |
3 |
4 |
| Open Area—Large |
$90,000 |
2 |
1.85 |
3 |
4 |
| Playground—Small |
$100,000 |
2 |
1.92 |
3 |
4 |
| Tennis—Large |
$270,000 |
3 |
2.03 |
2 |
4 |
| Tennis—Medium |
$180,000 |
3 |
3.36 |
2 |
4 |
| Softball/Baseball—Large |
$400,000 |
3 |
4.64 |
2 |
4 |
| Playground—Medium |
$250,000 |
3 |
5.08 |
2 |
4 |
| Softball/Baseball—Small |
$200,000 |
3 |
6.42 |
2 |
4 |
| Pool |
$7,000,000 |
3 |
6.87 |
2 |
4 |
| Volleyball—Large |
$200,000 |
3 |
1.04 |
3 |
5 |
| Trail—Large |
$150,000 |
3 |
1.85 |
3 |
5 |
| Note: AEE Cost Ratio was calculated by adding the recoded cost and the recoded Active EE. The result was reduced by 1 to reflect a scale from 1 to 5. |
- Roemmich JN, Epstein LH, Raja S, Yin L, Robinson J, Winiewicz D. Association of access to parks and recreational facilities with the physical activity of young children. Preventive Medicine 2006;43:437-41.
- Cohen D, McKenzie T, Sehgal A, Williamson S, Golinelli D, Lurie N. Contribution of public parks to physical activity. Am J Public Health 2007;97:509-14.
- Evenson KR, Wen F, Hillier A, Cohen DA. Assessing the contribution of parks to physical activity using global positioning system and accelerometry. Medicine and Science in Sports and Exercise 2013; 45:1981-87.
- Han B, Cohen D, McKenzie TL. Quantifying the contribution of neighborhood parks to physical activity. Preventive Medicine 2013;57:483-87.
- Floyd MF, Spengler JO, Maddock JE, Gobster PH, Suau L. Park-based physical activity in diverse communities of two U.S. cities: An observational study. American Journal of Preventive Medicine 2008;34:299-305.
- Besenyi GM, Kaczynski AT, Wilhelm Stanis SA, Vaughan KB. Demographic variations in observed energy expenditure across park activity areas. Preventive Medicine 2013;56:79-81.
- Edwards N, Hooper P, Knuiman M, Foster S, & Giles-Corti B. Associations between park features and adolescent park use for physical activity. International Journal of Behavioral Nutrition and Physical Activity 2015;12:21-31.
- Flaes SAB, Chinapaw MJ, Koolhaas CM, van Mechelen W, Verhagen EA. More children more active: Tailored playgrounds positively affect physical activity levels amongst youth. Journal of Science and Medicine in Sport In Press.
- Cohen DA, Han B, Isacoff J, Shulaker B, Williamson S, Marsh T, Bhatia R. Impact of park renovations on park use and park-based physical activity. Journal of Physical Activity & Health 2015;12:289-295.
- Veitch J, Ball K, Crawford D, Abbott GR, Salmon J. Park improvements and park activity: a natural experiement. American Journal of Preventative Medicine 2012;42:616-19.
- Tester J, Baker, R. Making the playfields event: evaluating the impact of an environmental intervention on park use and physical activity. Preventive Medicine 2009;48:316-20.
- Roemmich JN, Beeler JE, Johnson L. A microenvironment approach to reducing sedentary time and increasing physical activity of children and adults at a playground. Preventive Medicine 2014;62:108-12.
- King DK, Litt J, Hale J, Burniece KM, Ross C. ‘The park a tree built’: Evaluating how a park development project impacted where people play. Urban Forestry & Urban Greening 2015;14:293-99.
- Spengler JO, Floyd MF, Maddock JE, Gobster PH, Suau LJ, Norman GJ. Correlates of park-based physical activity among chidren in diverse communities: results from an observational study in two cities. American Journal of Health Promotion 2011;25: e1-e9.
- Floyd MF, Spengler JO, Maddock JE, Gobster PH, Suau LJ. Park-based physical activity in diverse communities of two US cities: an observational study. American Journal of Preventative Medicine 2008;34:299-305.
- Floyd MF, Spengler JO, Maddock JE, Gobster PH, Suau L. Environmental and social correlates of physical activity in neighborhood parks: an observational study in Tampa and Chicago. Leisure Sciences 2008;30:360-75.
- Baran PK, Smith WR, Moore RC, Floyd MF, Bocarro JN, Cosco NG, Danninger TM. Park use among youth and adults: examination of individual, social, and urban form factors. Environment and Behavior 2014;46:768-800.
- Floyd MF, Bocarro JN, Smith WR, Baran PK, Moore RC, Cosco NG, Edwards MB, Suau LJ, Fang K. park-based physical activity among children and adolescents. American Journal of Preventive Medicine 201l;41:258-265.
- Bocarro JN, Floyd M, Moore R, Baran P, Danninger T, Smith W, Cosco N. Adaptation of the system for observing physical activity and recreation in communities (SOPARC) to assess age groupings of children. Journal of Physical Activity & Health 2009;6:699-707.
- Bocarro JN, Floyd MF, Smith WR, Edwards MB, Schultz CL, Baran P, et al. Social and environmental factors related to boys’ and girls’ park-based physical activity. Preventing Chronic Disease 2015;12:140532.
- McKenzie TL, Marshall SJ, Sallis JF, Conway TL. Leisure-time physical activity in school environments: an oservational study using SOPLAY. Preventive Medicine 2000;30:70-77.
- McKenzie TL, Cohen DA, Sehgal A, Williamson S, Golinelli D. System for observing play and recreation in communities (SOPARC): Reliability and feasibility measures. Journal of Physical Activity & Health 2006;3:S208-S222.
This publication was funded by the Robert Wood Johnson Foundation through its Active Living Research program. The authors would also like to thank two independent reviewers, chosen for their perspective and technical expertise, for their constructive comments on preliminary drafts of this report: Zarnaaz Bashir, MPH, National Recreation and Park Association; and Bisakha "Pia" Sen, PhD, The University of Alabama at Birmingham.
Authors
-
Myron Floyd
-
Parks, Recreation, and Tourism Management
-
Luis J. Suau
-
Shaw University
-
Robby Layton
-
Design Concepts CLA, Inc.
-
Jay E. Maddock
-
Texas A&M University
-
Karly Bitsura-Meszaros
-
NC State University
Find more information at the following NC State Extension websites:
Publication date: Dec. 16, 2015
AG-813
N.C. Cooperative Extension prohibits discrimination and harassment regardless of age, color, disability, family and marital status, gender identity, national origin, political beliefs, race, religion, sex (including pregnancy), sexual orientation and veteran status.


