
Introduction
Quantification of water needs for agriculture is important for both planning and managing agricultural operations such as farms and ranches. These water needs can be quantified as water "demands" from crops and livestock. Water demand for crops in North Carolina is normally not fully met from rainfall, so producers often use irrigation to increase crop yield and quality. Most sources of irrigation water in North Carolina are local and include farm ponds as well as rivers and streams adjacent to irrigated land or groundwater pumped from wells located on the producer's property. Recently, due in part to the Agricultural Water Resources Assistance Program (AgWRAP) that provided partial funding for agricultural farm ponds and favorable commodity prices, interest in agricultural farm ponds has increased. With support from the NC Division of Soil and Water Conservation of the NC Department of Agriulture and Consumer Services (NCDA&CS), we developed a "Water Needs Assessment Tool" to estimate agricultural water requirements and agricultural pond capacity requirements in North Carolina. The tool was initially used to help rank applications for potential cost-share, but it can be used by technical specialists, such as certified crop advisors, the U.S. Department of Agriculture's (USDA) Natural Resource Conservation Service (NRCS) personnel, NC Division of Soil and Water Conservation staff and District Soil and Water Conservation staff, and NC Cooperative Extension agents, to help growers and producers plan for their water needs. The tool is implemented in Visual Basic for Applications (VBA) within Microsoft Excel. Although online help is available with the spreadsheet tool, there is no background or explanation of how water needs are developed in the online help. This document was prepared to provide the background and references for the spreadsheet-based tool and its data inputs, and to show the methods used to generate model output. Two examples are also provided. To access the spreadsheet model, download File 1 and File 2. Note that Microsoft Excel on a PC is required.
General Input Requirements and Background
The required input and output provided by the model are listed below:
Inputs
- County
- Crops to be irrigated with planting dates and acreage
- Livestock type and number of head
If an estimate of farm pond required capacity (size) is desired, additional required inputs are:
- Watershed area
- Type of runoff estimate method to use (cover type is required for the more complex method)
Outputs
Depending on the input provided, output includes:
- Estimated monthly runoff into the proposed pond
- Estimated monthly irrigation water requirements by crop
- Estimated monthly total livestock water requirements
- Estimated monthly water deficits
- Estimated required pond size and warning notes
To determine required farm pond capacity and effectively use water captured by these ponds, a user needs to estimate the expected uses (water demand) and expected inflow (water supply) associated with the planned pond. Water demand is normally crop irrigation and livestock watering. Water supply is normally provided by surface runoff occurring from rainfall on the watershed defined by the pond location. Although many farm ponds are fed by shallow groundwater and springs, the tool does not attempt to quantify that contribution and only estimates surface water runoff. Also, several counties in North Carolina are not likely to have conditions conducive to farm pond development, but the tool may still be used to estimate irrigation and livestock water requirements.
The time step of this tool is one month, although some intermediate calculations are performed with daily time steps to generate monthly averages of, for instance, crop curves.
Data Sources
Weather Data
Weather data were obtained from the NCDC (National Climatic Data Center, 2011). Monthly 30-year normals for 1980 to 2010 were downloaded for all precipitation and temperature stations in North Carolina. Normal (average) rainfall, normal mean, normal maximum, and normal minimum temperatures are used in the tool. Rainfall data are used to estimate runoff and effective precipitation, while temperature data are used to compute reference evapotranspiration (ETo). Figure 1 shows all rainfall stations, and Figure 2 shows all temperature stations in the NCDC dataset. One precipitation station was identified in each of the 100 counties in North Carolina to represent rainfall in each county. Ten temperature stations were selected to represent 10 climate zones for computation of ETo. Each county was assigned to a climatic zone. Climatic stations used to calculate ETo are presented in Table 1, and locations are shown in Figure 3.
| Location | Latitude | Longitude | Elevation (feet) | Research Station Name1 |
|---|---|---|---|---|
| Aurora | 35.39 | -76.78 | 20 | Pamlico Aquaculture Field Lab |
| Fletcher | 35.43 | -82.56 | 2,069 | Mountain Horticultural Crops Research Station |
| Goldsboro | 35.44 | -78.09 | 134 | Cherry Research Station |
| Jackson Springs | 35.22 | -79.73 | 731 | N/A |
| Laurel Springs | 36.40 | -81.30 | 2,872 | N/A |
| Lewiston | 36.13 | -77.17 | 49 | N/A |
| Raleigh | 35.73 | -78.68 | 420 | Lake Wheeler Road Field Station |
| Salisbury | 35.70 | -80.62 | 823 | Piedmont Research Station |
| Whiteville | 34.40 | -78.80 | 89 | Border Belt Research Station |
| 1 For those stations co-incident to NCDA&CS Research Stations, otherwise N/A. | ||||
Soils
Soils information is needed for runoff estimation if the "NRCS cover type" runoff option is selected. The hydrologic soil group for NC soils was obtained from Tables NC6-1 and NC6-2 (USDA–NRCS, 2009). The user may identify the primary soil for the watershed contributing runoff to the proposed pond by using NRCS soils maps or the NRCS soil data server.
All other data or information sources are listed in the appropriate sections below.
Water Demand
Irrigation water demand is determined from reference evapotranspiration (ETo), crop type, planting date, effective precipitation, and irrigation system efficiency.
Crop Water Requirements
Reference Evapotranspiration. Reference evapotranspiration for all 10 regions was computed from monthly averages of mean, minimum, and maximum temperatures and the modified Hargreaves equation (Hargreaves and Samani, 1982). The Hargreaves equation is shown in Figure A where:
ETo = reference evapotranspiration, mm or in.
T = mean temperature for the peiod, °C
Rs = mean solar radiation for the period, in the same units of equivilant water evaporation (mm or in.)
\({\rm ET}_o=0.0135\times\ R_s\left(T+\ 17.8\right)\)
When solar radiation is not measured, it may be approximated by Hargreaves and Samani (1985) as shown in Figure B where:
Rs = solar radiation
Tmax = maximum temperature for the period
Tmin = minimum temperature for the period
Ra = extraterrestrial radiation for the latitude and time of year, in same units as Rs
Kr = calibration coefficient set to 0.18 for all of North Carolina as per NC State recommendations
\(R_s=K_r\times\left(T_{max}-T_{min}\right)^{0.5}\times R_a\)
Calculation of ETo for all stations was performed using the software package RefET (Allen, 2003).
Crop Coefficients. Crop coefficients are generated using FAO-56 guidance (Allen et al., 1998). A single crop coefficient approach was used (incorporating both crop transpiration and wet soil evaporation). Development days for "initial", "development", "mid", and "late" were taken from Table 11 of Allen et al., and associated crop coefficient (Kc) values for those stages were taken from Table 12 of the same publication. Figure 4 illustrates the crop stages used in Allen et al. (1998).
Crop evapotranspiration (ETc) is shown in Figure C.
\({\rm ET}_c=K_c\times{\rm ET}_o\)
Units of ETc and ETo in the tool are in inches.
Effective Precipitation. Effective precipitation is the depth of precipitation stored in the root zone and thus available for plant use. It is less than total precipitation due to canopy interception, deep percolation (below root zone), and runoff. The tool uses the method of the USDA Soil Conservation Service (1970) to estimate monthly effective precipitation. The estimate is a function of the monthly precipitation, monthly ETc, root zone depth, and the plant-available water-holding capacity of the soil. In the tool, the effective root zone depth is assumed to be 1.0 feet, the plant-available water-holding capacity is assumed to be 2.0 inches per foot, and the allowable depletion of plant available water in the root zone is assumed to be 66 percent for field crops.
Irrigation System Efficiency
The last component in determining the monthly gross irrigation requirement (GIR) is irrigation system efficiency, shown in Figure D, where:
ETc = crop ET
Pe = effective precipitation
Eirr = irrigation system efficiency
\(GIR=\frac{{\rm ET}_c-P_e}{E_{irr}}\)
The GIR is the amount required to be supplied from the pond for full irrigation. Irrigation efficiency has several definitions and is really a combination of the irrigation system performance and irrigation management. Irrigation efficiency in this case is based upon the irrigation system only and may be treated as irrigation system uniformity and droplet evaporation losses. The irrigation water demand imposed upon the pond for any given month is a weighted demand based upon the acreage for the selected crops. If two crops are double-cropped, those two crops are assumed to be planted to the same acreage and the acreage is not double-counted. Table 2 shows default irrigation system efficiencies used by the tool.
| System | Efficiency (%) |
|---|---|
| Drip | 90 |
| Center Pivot and Linear Move | 80 |
| Solid Set Sprinkler | 70 |
| Traveling Gun | 75 |
Livestock Water Requirements
Livestock water requirements are also included as part of the water demand within the tool. It should be noted that the water requirements are associated with livestock that would receive drinking water from a pond source. This would be most likely for grazing animals with troughs and tanks receiving water from the proposed pond.
Daily water requirements for various types of livestock are presented in Table 3 as adapted from Midwest Plan Service (1983). Although water consumption would normally change with time of year, only averages are used.
| Animal Type | Use (gal/head/day) |
|---|---|
| Beef cattle | 15 |
| Beef cow | 20 |
| Beef cow/calf pair | 30 |
| Goats | 2 |
| Horses | 8 |
| Milking cow | 35 |
| Milking cow/calf pair | 45 |
| Dry cow | 15 |
| Sheep and lambs | 2 |
The monthly livestock water demand is computed as in Figure E where:
LWU = monthly livestock water use, acre-feet
gpdj = daily water use for livestock type j
headj = number of head for livestock type j
m,n are counters equal to the number of livestock types and number of days per month. Total water demand is simply the sum of irrigation and livestock water demand.
\(LWU=3.07\times{10}^{-6}\sum\limits_{i=1}^{n}\sum\limits_{j=1}^{m}\left({\rm gpd}_j\times{\rm head}_j\right)\)
Pond Water Supply
Pond water supply is estimated from contributing watershed area and an estimate of monthly runoff depth. Cumulative curves of water demand and water supply are used to determine required storage volume of the proposed pond.
Runoff Estimation
The tool estimates monthly pond runoff by one of two methods: a "simple" method and a "curve number" method ("cover-type" in spreadsheet). Required inputs depend upon the selected method, but both methods require input of watershed area contributing to the proposed pond. A conceptual illustration of a watershed and pond is shown in Figure 5.
Simple Method. The simple method is based upon Figure 11 in Agricultural Handbook 590 (USDA–NRCS, 1982). This figure provides the approximate size of drainage area in acres required to produce an acre-foot of annual runoff as map contours. The figure value (contour-based) is implemented in the tool by a "double" index lookup based upon latitude and longitude of the rainfall station assigned to the selected county. The tool uses monthly precipitation proportions of annual rainfall to distribute the annual runoff estimate on a monthly basis. Mathematically, the monthly runoff (inches) is shown in Figure F where:
ROi = monthly runoff, in.
Pi = average monthly precipitation, in.
Pann = annual runoff, in.
Ac(AcFt)-1 = acres per acre foot of runoff from USDA–NRCS (1982)
\({\rm RO}_i=\frac{P_i}{P_{ann}}\times\frac{1}{{Ac\left(AcFt\right)}^{-1}}\times 12\)
Curve Number (NRCS Cover-type) Method. The excess rainfall method uses watershed cover and soil hydrologic group to compute excess runoff using the NRCS TR-55 method (USDA Conservation Engineering Division, 1986). The tool uses precipitation events equal to the mean monthly precipitation divided by the mean number of rainfall events equal to or greater than 0.5 inches rather than design short-duration storms and thus should be used with caution. Specifically, the precipitation depth used in the NRCS method is shown in Figure G where:
Pi,e = depth of average event e, in month i, in.
Pi = avg. total precipitation for month i, in.
e ≥ 0.5 in = avg. number of events in month i having rainfall ≥ 0.5 in.
\(P_{i,\ e}=\frac{P_i}{int\left(e_{\geq0.5\ in.}\right)}\)
Monthly runoff (excess precipitation, Q) is shown in Figure H where:
Qi = depth of runoff for month I, in.
Pi,e = depth of average precipitation event for month I, in.
S = (1000 ÷ CN) - 10, where CN is weighted curve number based upon area of selected cover type, and the hydrologic soil group, and
ei = integer of the avg. number of rainfall events having rainfall ≥ 0.5 in. for month i. The spreadsheet uses a rounding function so that the integer is not biased low.
\(Q_i=\frac{\left(P_{i,\ e}-0.2S\right)^2}{P_{i,e}+0.8S}\times\ e_i\)
Required Pond Capacity
The required pond capacity is determined using a hierarchy of analyses. The first estimate is made using a mass curve (or Rippl diagram) (Linsley, Franzini, Freyberg, and Tchobanoglous, 1992). In reservoir sizing, the mass curve analysis is normally done over a period of years that include a drought period. For this tool, no annual carryover storage is assumed and the analysis is used to determine the required storage to carry over months. The mass curve method uses plots of cumulative supply (runoff) and cumulative demand to determine required storage to carry over water storage for those months in which demand exceeds supply. The largest difference between cumulative demand and cumulative supply is the first estimate of required storage (Figure 6). If cumulative demand never exceeds cumulative supply, there still may be a water supply deficit in one or more months, and the total deficit over the year is considered. If no month has a shortage (supply from runoff minus total demand), there still is a need to store the runoff and the maximum monthly deficit is considered. The estimate for required storage, therefore, is the maximum of the largest difference in mass curves, the total deficit for the year, or the largest monthly demand. Pond evaporation and seepage are not included as demands by the tool. Also, if annual demand exceeds annual supply (runoff), no amount of storage will fulfill the demand and the solution obtained from the mass curve analysis is not real.
The mass curve analysis is implemented in the spreadsheet tool by identifying the maximum monthly difference in cumulative supply and cumulative demand (the maximum negative number of cumulative supply minus cumulative demand). If there is no negative number of cumulative supply minus cumulative demand, then the summation of monthly deficits is considered. If no month has a deficit (negative value of supply minus demand), the required storage is then selected as the maximum monthly total demand in the spreadsheet.
A summary table of rainfall, runoff, irrigation and livestock demands, deficits, and cumulative runoff and cumulative demand are generated by the tool. Required storage and any warning notes are generated at the bottom of the summary table. See the examples section for an example of the summary output table. A plot of mass curves of supply and demand is also generated and can be accessed from the home page.
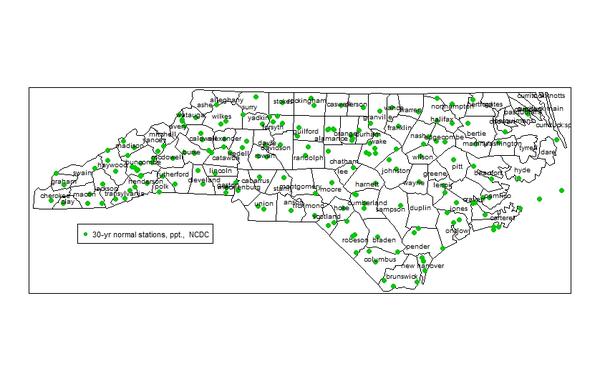
Figure 1. Thirty-year normal rainfall stations.
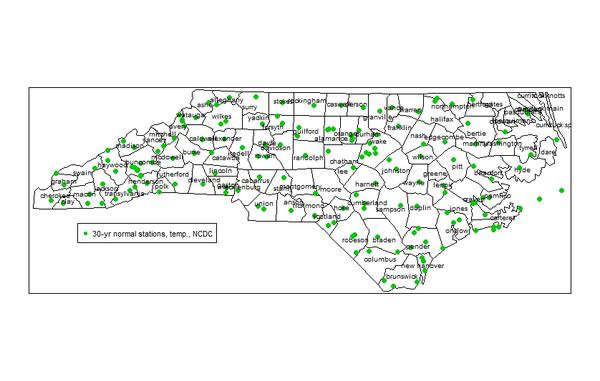
Figure 2. Thirty-year normal temperature stations.
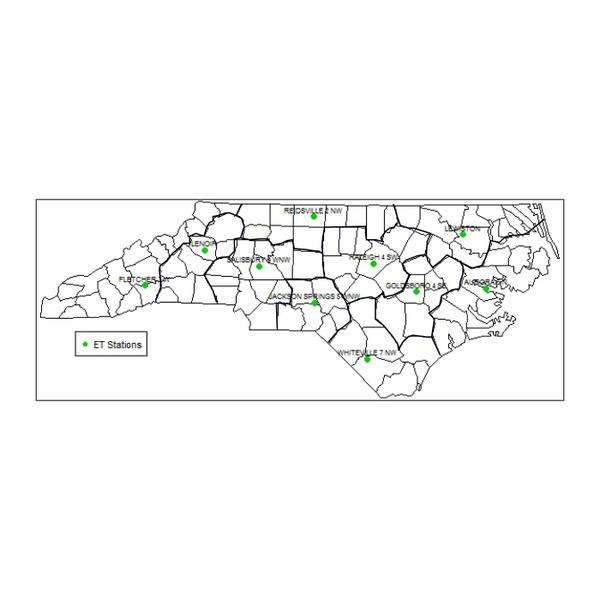
Figure 3. Thirty-year normal temperature stations used for ETo generation. Bold lines are boundaries used for ETo regions.
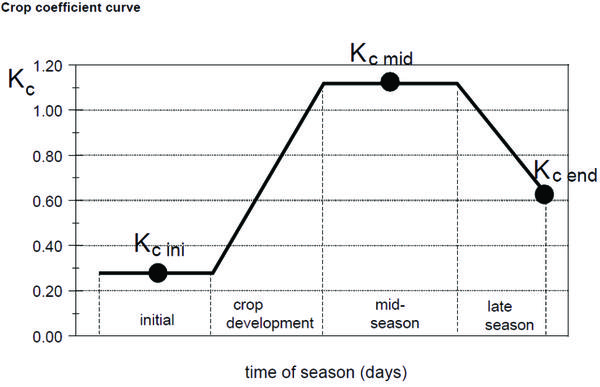
Figure 4. Crop curve development (from Allen et al., 1998).
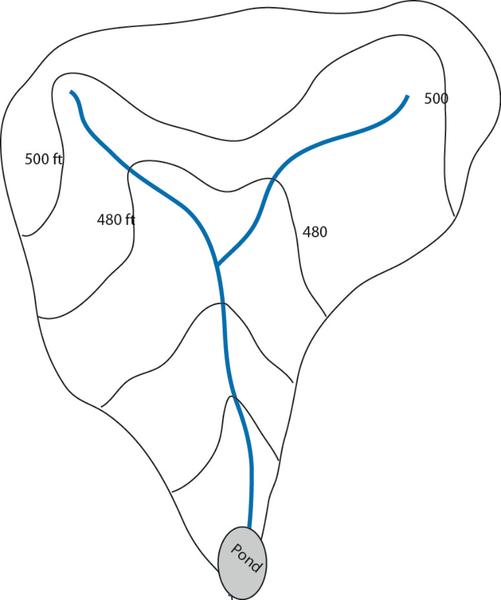
Figure 5. Conceptual watershed with pond.
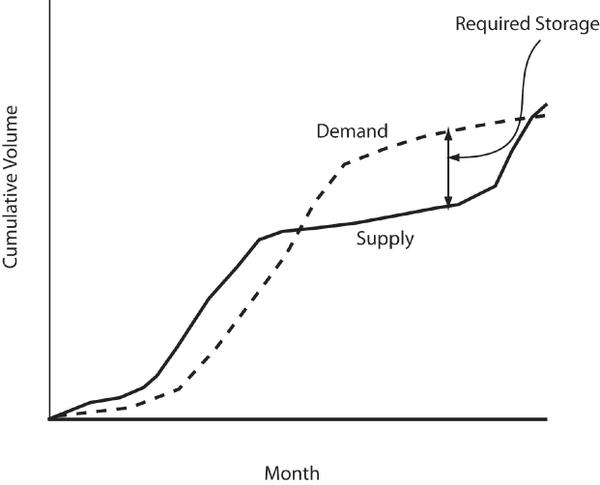
Figure 6. Example mass curve plots.
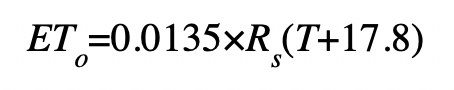
Figure A. Hargreaves equation.
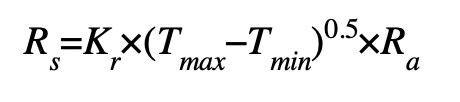
Figure B. Hargreaves and Samani when radiation is not measured.

Figure C. Crop evapotranspiration formula.
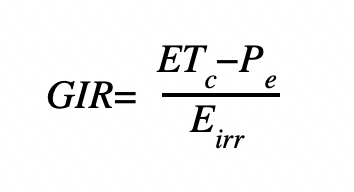
Figure D. Irrigation system efficiency formula.
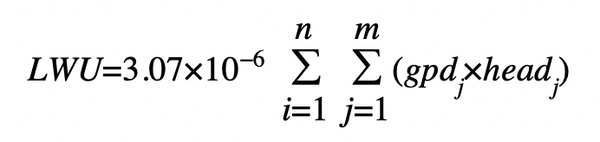
Figure E. Monthly livestock water demand formula.
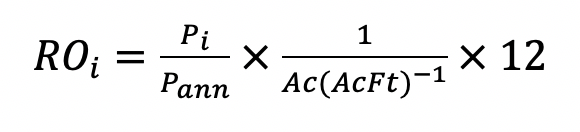
Figure F. Monthly runoff formula.
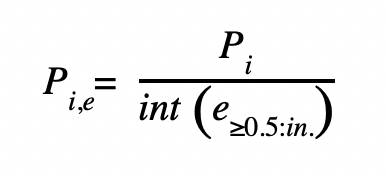
Figure G. Precipitation depth formula.
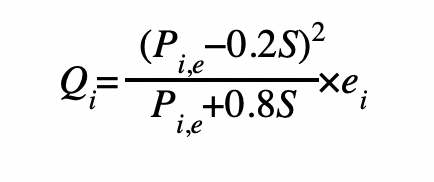
Figure H. Monthly runoff formula.
Pond Operation
A pond operation page is included in the spreadsheet model. The user may change pond capacity and beginning storage to see the effects of these on satisfying demand. Normally the required storage returned from the summary output page is the first pond capacity selected. The operation model estimates monthly beginning and ending storage and monthly spills and deficits. As the order of operations has an effect, two options are allowed: "inflow first" and "demand first". The inflow first is the more conservative option (would result in greater required storage) as runoff is first added to the previous month storage subject to pond capacity, and therefore any spill would occur before demand was satisfied. The "demand first" assumes that demand is first met by pond storage, then any residual demand is met by runoff, and spill would only occur if the balance of storage was above pond capacity after first fulfilling demand. See the following "Examples" section for an illustration of the operation page.
Examples
The home page of the spreadsheet tool is shown in Figure 7. Access to all input and output information is gained by clicking on the labeled buttons. In the following examples, only crop demand and associated storage requirements are developed, as crop irrigation water demand normally far exceeds grazing livestock water demand.
Example 1. Irrigation water needs and required pond capacity are desired for 40 acres of corn planted April 15 and irrigated by a traveling gun system in Rowan County. The contributing watershed to the location of a planned pond site is 320 acres. The "simple method" runoff estimation method is selected. Figure 8 depicts the "Location, Crop, and Irrigation System" input screen with the example conditions.
Selecting the summary output page from the home page yields the results shown in Figure 9. The estimated required pond size for this scenario is about 27 acre-feet. The note below the table indicates that the water supply is adequate. The deficit values in red in June and July (months 6 and 7) indicate that the runoff from those months would be inadequate to supply the crop irrigation water needs without pond storage in a normal year. Crop gross irrigation water demand (including accounting for irrigation system inefficiency) is greatest in July (8.0 inches) and totals about 19 inches over the season. Note that this is a full gross irrigation requirement, and near optimal yields may be obtained with less water if applied during critical water use periods. Selecting "irrigation requirements only" provides detail on the components used to estimate gross irrigation water requirements (GIR), including reference ET (ETo), rainfall (ppt.), crop coefficient (kc), effective precipitation (Pe), and net irrigation requirement (NIR). Figure 10 shows results for "irrigation requirements only" for Example 1 obtained by selecting that option from the home page.
Example 2. For the same location given in Example 1, a grower desires to know the reliability of a pond of 20 acre-foot capacity for irrigating field corn and soybeans with a center pivot system in a corn-winter wheat-soybean crop rotation. He has fields that are in alternate years of the rotation that total 120 acres. The planting date for corn is the same as in Example 1 (April 15), and for soybean the date is June 1.
Selecting "Pond Operation" from the home page and selecting the more conservative "inflow first" option, and a starting pond storage of 15 acre-feet going into the season, provides results shown in Figure 11. The left side of the figure is similar to the summary output page that reports required storage (in this case 89 acre-feet), and the right side of the figure shows results based on the inputs provided by the user in the blue-colored operation input cells. Shortages occur from June through September (months 6 through9), as would be expected since corn acreage has increased by 50 percent from Example 1 and 60 acres of soybeans had been added. July has the most irrigation water deficit with only about 30 percent of the full crop water demand being met. The deficit in August is small with about 90 percent of a full demand satisfied. Alternative pond capacities and beginning storage values can be explored to determine the input on pond reliability. Selecting a 90 acre-foot capacity pond with beginning storage at capacity, and selecting the "irrigation first mode", results in no shortages and so closely agrees with the results in the summary page that reports required storage as 89 acre-feet.
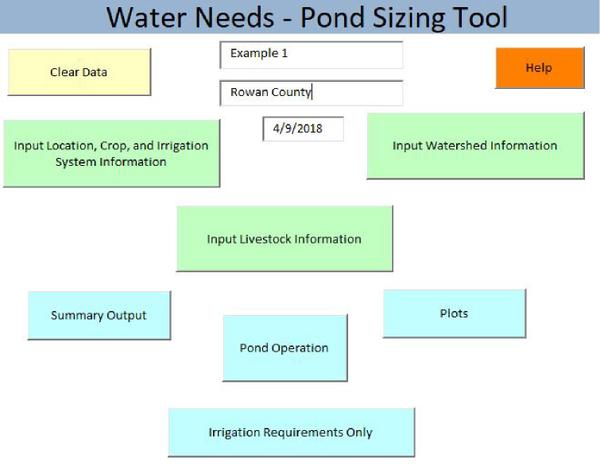
Figure 7. Home page of water needs assessment tool.
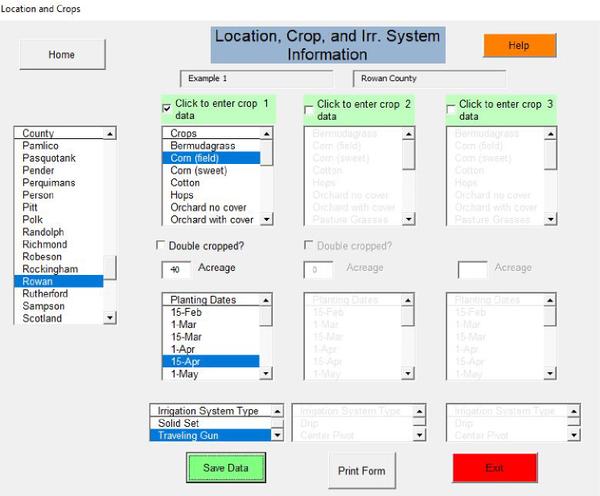
Figure 8. Input information for Example 1.
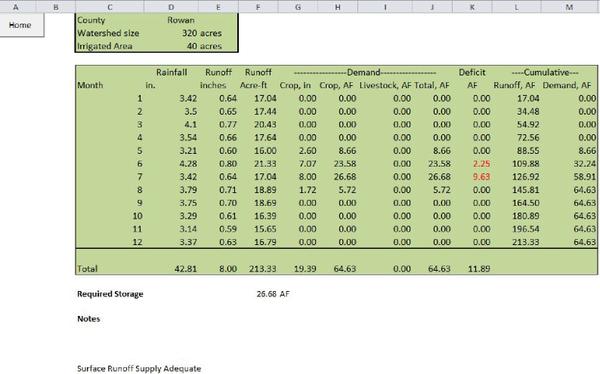
Figure 9. Summary output page for Example 1.
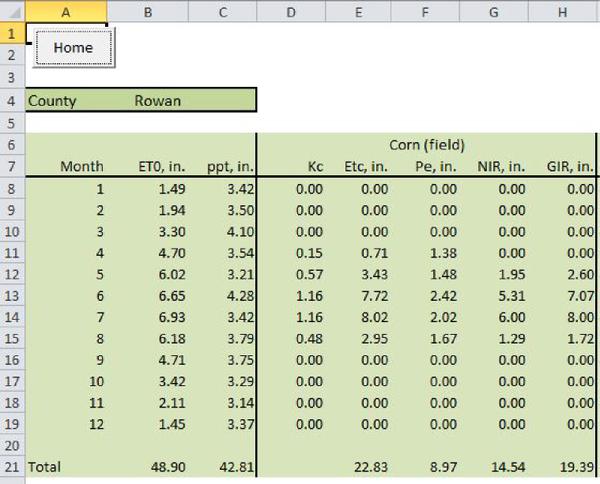
Figure 10. Irrigation requirements summary page for Example 1.
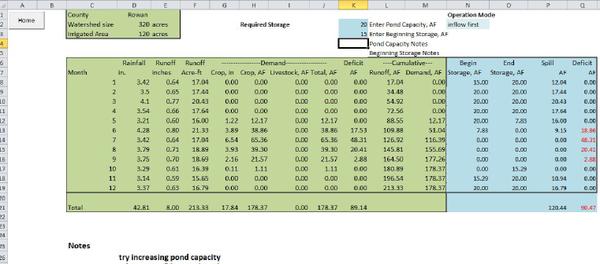
Figure 11. Pond operation output summary for Example 2.
References
Allen, R. 2003. Ref-ET: Reference Evapotranspiration Calculation Software. User's manual (Version 2.01.17 ed.). Moscow, ID: University of Idaho.
Allen, R., L. Pereira, D. Raes, and M. Smith. 1998. Crop Evapotranspiration—Guidelines for Computing Crop Water Requirements. FAO Irrigation and drainage paper no. 56 (Tech. Rep.). Rome: Food and Agriculture Organization of the United Nations.
Hargreaves, G., and Z. Samani. 1982. Estimating potential evaporation. J. Irrig. and Drain., 108 (IR3), 223-230.
Hargreaves, G., and Z. Samani. 1985, Nov. Reference crop evaporation from temperature. App. Engr. in Agric., 1(2), 96-99.
Linsley, R., J. Franzini, D. Freyberg, and G. Tchobanoglous. 1992. Water-Resources Engineering (4th ed.). Water Resources and Environmental Engineering series. Princeton, NJ: McGraw-Hill.
Midwest Plan Service. 1983. Structures and Environment Handbook (11th ed., revised 1987). Ames, IA: Iowa State University.
National Climatic Data Center. 2011. NOAA's 1981–2010 U.S. climate normals. Washington, DC: National Centers for Environmental Information, NOAA. Retrieved from https://www.ncdc.noaa.gov/data-access/land-based-station-data/land-based-datasets/climate-normals/1981-2010-normals-data.
U.S. Department of Agriculture, Natural Resources Conservation Service. 1982. Ponds—Planning, Design, Construction (rev. 1996 ed.). Agricultural Handbook 590. Washington, DC: USDA.
U.S. Department of Agriculture, Natural Resources Conservation Service. 2009, Sept. North Carolina irrigation guide (210-vi-NEH 652, IG Amend. NC1 ed.; Tech. Rep.). Raleigh: NCDA&CS.
U.S. Department of Agriculture, Conservation Engineering Division. 1986, June. Urban Hydrology for Small Watersheds (Tech. Rel. 55, 2nd. ed.). Washington, DC: USDA.
U.S. Department of Agriculture, Soil Conservation Service, Engineering Division. 1970. Irrigation Water Requirements (Tech. Rep. No. TR-21). Washington, DC: USDA.
Publication date: Sept. 26, 2018
Reviewed/Revised: July 18, 2023
AG-850
N.C. Cooperative Extension prohibits discrimination and harassment regardless of age, color, disability, family and marital status, gender identity, national origin, political beliefs, race, religion, sex (including pregnancy), sexual orientation and veteran status.