
Introduction
The diversity of production practices, coupled with the wide range in soil properties across North Carolina, results in considerable soybean yield variability annually. The state soybean yield average was 32 bu/A from 2002 to 2019, compared to a U.S. soybean yield average of 44 bu/A during that same period, according to the United States Department of Agriculture’s National Agricultural Statistics Service (USDA-NASS). More concerning than the absolute differences in average soybean yield in North Carolina is a comparison to the rate of yield increase across the United States. North Carolina is increasing yields annually at 0.1 bu/A compared to the U.S. at 0.4 bu/A over the past 20 years (Figure 1). Considerable effort should be devoted to better understanding of yield limitations in this state and the management practices that would result in increased soybean yield statewide.
The North Carolina Soybean Yield Contest (SYC) has been conducted for decades to recognize growers who are achieving high yield and to identify the management practices associated with these yields (see N.C. Soybean Yield Contest results). From 2002 to 2019, the average SYC yield was 65 bu/A; this is 102% higher than the North Carolina average soybean yield (32 bu/A) during that period (Figure 1). The goal of this publication is to identify the management strategies in the North Carolina SYC that have been the strongest predictors of high soybean yield and extend this information to all North Carolina soybean producers in an effort to increase soybean yields across the state.
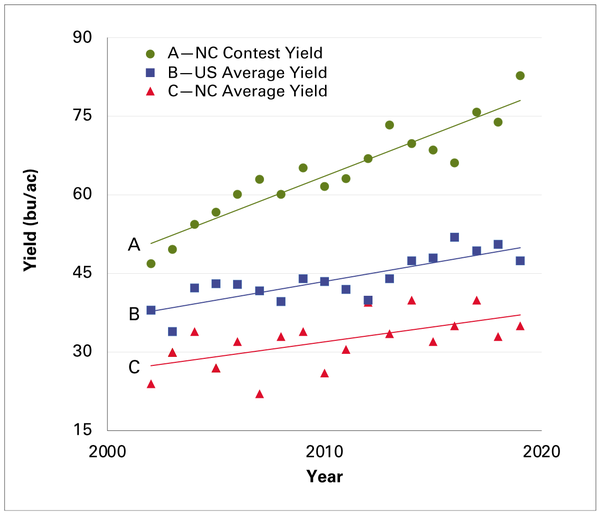
Figure 1. Comparison of soybean yield increases over the past 20 years in North Carolina between contest entries, average, U.S. yield, and average North Carolina yield.
Source: USDA-NASS
Data Description and Analysis
The North Carolina SYC is conducted annually to recognize high-yielding producers across the state and to gather data on management practices or strategies employed by these producers. A producer can enter an unlimited number of entries annually. The area entered must be a minimum of 3.0 contiguous acres located entirely in North Carolina. Field measurement and yield determination are conducted under the supervision of a North Carolina Cooperative Extension agent. Yield is calculated using the verified weight of the contest entry area, the sample moisture, and the estimated sample foreign matter of harvested soybeans, corrected to 13% moisture and 1% foreign matter. Management information for each entry is required upon contest submission.
The database used in our analysis consisted of 877 individual entries from the North Carolina SYC from an 18-year period between 2002 and 2019 (Table 1). During this period, 238 entries were from the coastal plain region, 234 from the piedmont region, and 405 from the tidewater region. The number of annual entries ranged from 9 to 107, with an average of 48 entries per year (Table 1). Over the 18-year period, entries were received from 58 counties despite very low average yield in many of them (Figure 2).
|
|
Year |
||||||||||||||||||
|
2002 |
2003 |
2004 |
2005 |
2006 |
2007 |
2008 |
2009 |
2010 |
2011 |
2012 |
2013 |
2014 |
2015 |
2016 |
2017 |
2018 |
2019 |
2002–2019 |
|
|
Number of Entries |
9 |
38 |
62 |
40 |
56 |
38 |
52 |
42 |
57 |
39 |
66 |
48 |
107 |
42 |
52 |
63 |
24 |
42 |
877 |
|
Average Yield (bu/A) |
47 |
50 |
54 |
57 |
61 |
63 |
60 |
65 |
62 |
63 |
67 |
73 |
70 |
69 |
66 |
76 |
74 |
83 |
65 |
|
High Yield (bu/A) |
76 |
73 |
75 |
80 |
93 |
85 |
79 |
83 |
89 |
86 |
92 |
91 |
85 |
93 |
88 |
107 |
104 |
109 |
109 |
|
Low Yield (bu/A) |
33 |
31 |
39 |
35 |
35 |
36 |
28 |
42 |
29 |
46 |
49 |
58 |
40 |
44 |
38 |
49 |
36 |
55 |
28 |
Our analysis focused on evaluating the management practices that may influence soybean yield. The practices we evaluated included: maturity group (MG), planting date, seeding rate (lbs soybean seed/A), row spacing (in), fungicide seed treatment (Y/N), seed applied inoculant (Y/N), foliar fungicide use (number of applications), herbicide use (number of applications), foliar insecticide use (number of applications), use of irrigation (Y/N), and tillage (Y/N).
Basic descriptive summary statistics were used in addition to frequency of adoption of management practices by year to understand the range in variation associated with different variables (Figures 3a–3k). For the analysis, data were pooled over years to provide a more robust understanding of the most influential management practices on soybean yield across the state. However, we realize that the adoption of various management practices has changed throughout the period evaluated in this analysis (Figures 3a–3k); therefore, we selected the models that minimized the impact of year as a confounding effect.
Three different statistical procedures were used to identify management practices with the strongest influence on yield. First, a mixed, multilevel model with all 11 management practices was used to quantify the effects of different management practices on soybean yield variability. Modeling was done for data pooled across regions, then for individual regions, to determine if there were any major differences in practices contributing to yield within a region. Next, we performed a series of statistical procedures with variable selection features commonly used to analyze unstructured data. Each of the 11 management practices was ranked in descending order according to the frequency in which it was identified as statistically significant across the 9 models. Finally, conditional inference trees were used to better explore interactions among the 11 management variables. Conditional inference tree analysis was carried out for data pooled across the entire state and for the three specified geographic regions. For a more detailed description of the statistical analysis used, please refer to the Agronomy Journal article “Production Practices that Maximize Soybean Yield: What We Have Learned from the North Carolina Soybean Yield Contest.”
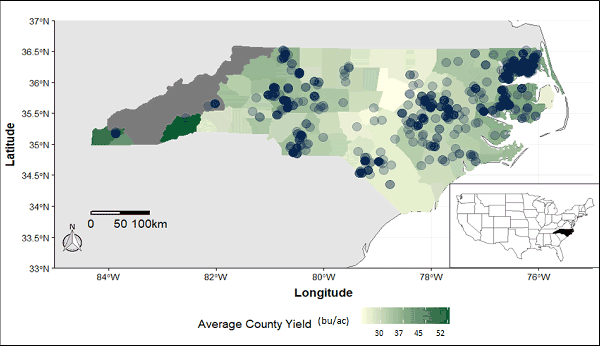
Figure 2. North Carolina Soybean Yield Contest entry density by county overlaid on average soybean yield in those counties from 2002 to 2019.
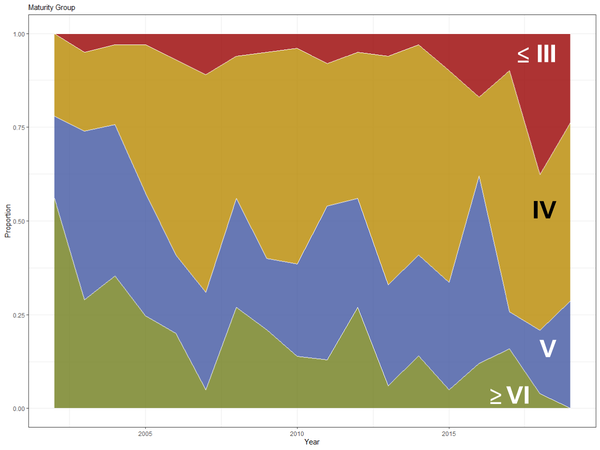
Figure 3a. Frequency of adoption of various soybean maturity groups (MGs) from 2002 to 2019 in the North Carolina Soybean Yield Contest.
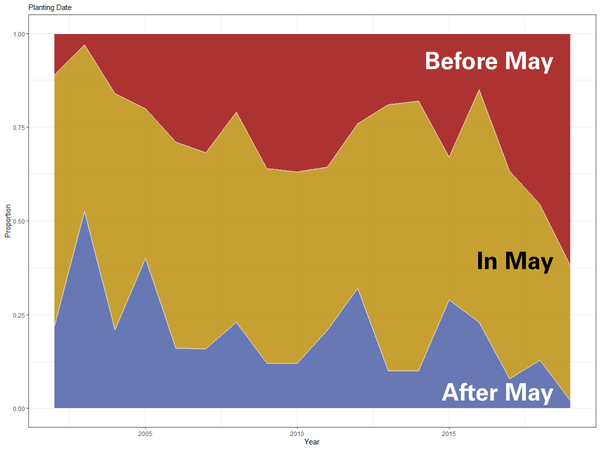
Figure 3b. Frequency of various soybean planting dates used from 2002 to 2019 in the North Carolina Soybean Yield Contest.
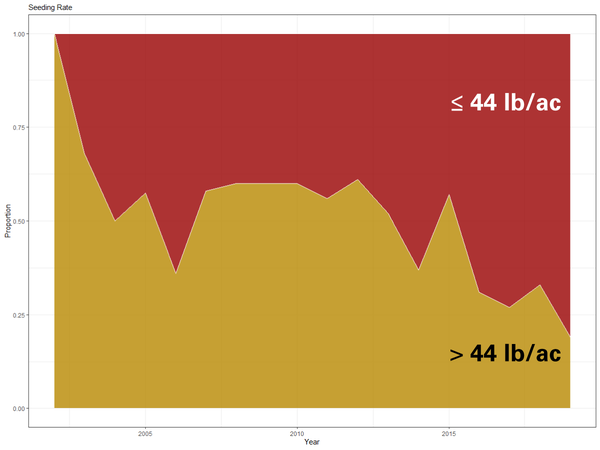
Figure 3c. Frequency of various soybean seeding rates used from 2002 to 2019 in the North Carolina Soybean Yield Contest.
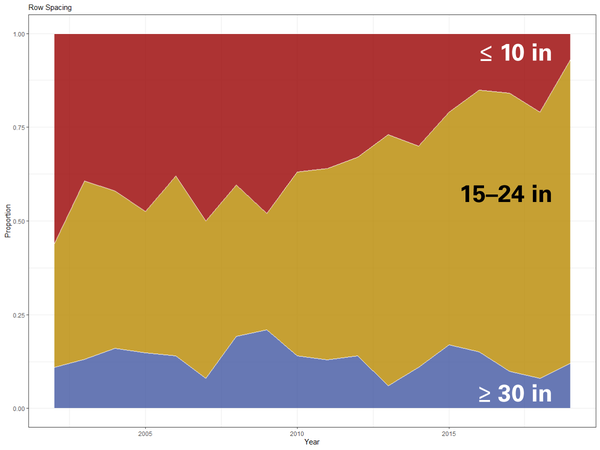
Figure 3d. Frequency of various soybean row spacing used from 2002 to 2019 in the North Carolina Soybean Yield Contest.
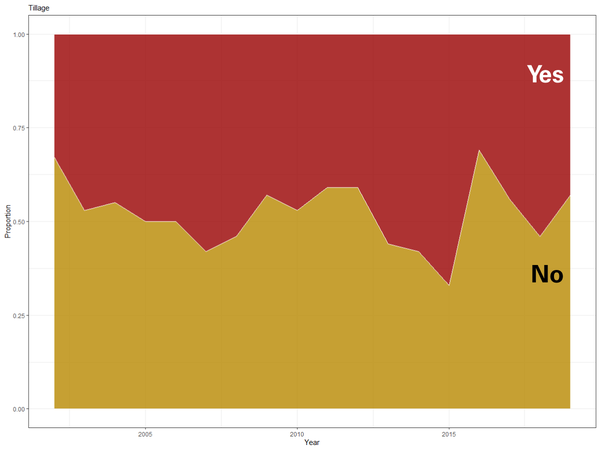
Figure 3e. Frequency of adoption of various tillage practices used from 2002 to 2019 in the North Carolina Soybean Yield Contest.
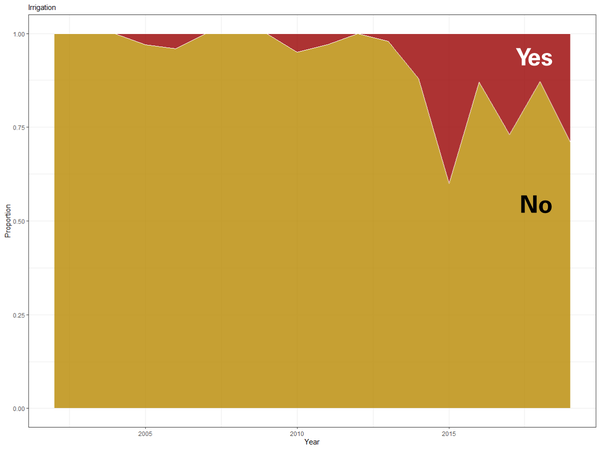
Figure 3f. Frequency of irrigation used from 2002 to 2019 in the North Carolina Soybean Yield Contest.
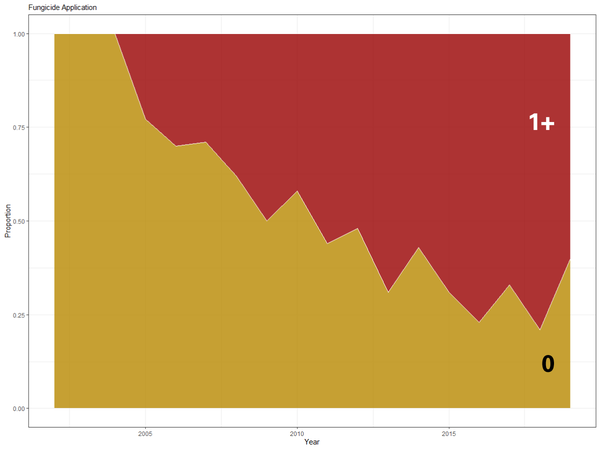
Figure 3g. Frequency of adoption of foliar fungicide applications from 2002 to 2019 in the North Carolina Soybean Yield Contest.
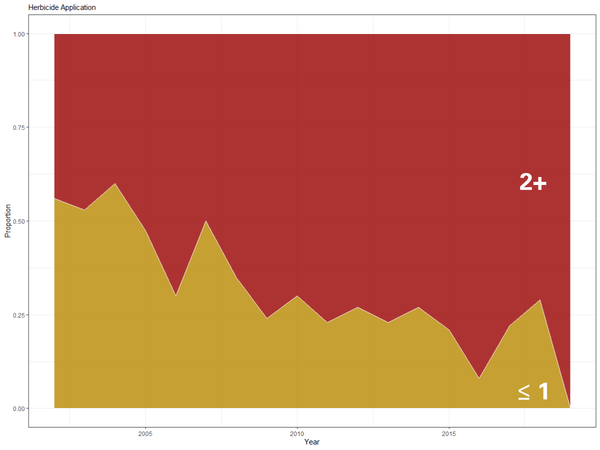
Figure 3h. Frequency of adoption of herbicide applications from 2002 to 2019 in the North Carolina Soybean Yield Contest.
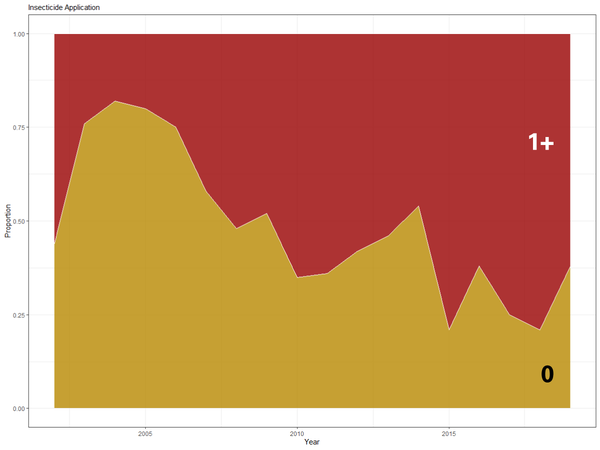
Figure 3i. Frequency of adoption of foliar insecticide applications from 2002 to 2019 in the North Carolina Soybean Yield Contest.
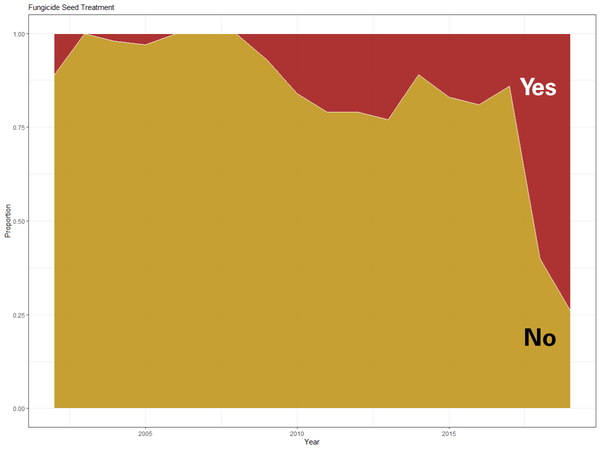
Figure 3j. Frequency of adoption of fungicidal seed treatments from 2002 to 2019 in the North Carolina Soybean Yield Contest.
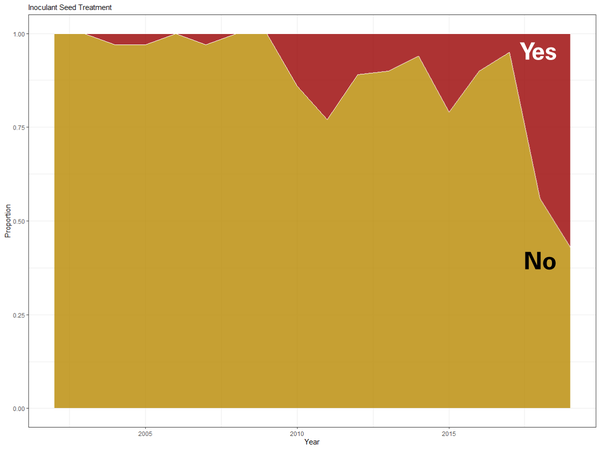
Figure 3k. Frequency of adoption of inoculant seed treatments from 2002 to 2019 in the North Carolina Soybean Yield Contest.
How to Interpret a Conditional Inference Tree
Conditional inference trees have been used for analyzing large data sets in agricultural studies because they provide a scientifically valid method to identify and rank factors and their interactions while allowing for useful interpretation of the results. The application of conditional inference trees to analyze a nonuniform data set is described in detail in the Agronomy Journal article, but a brief explanation follows.
The conditional inference algorithm performs a statistical test to determine the association between the input variables (management practices) and the response variable (yield). In step one, the algorithm selects the input variable with the strongest association to the response variable and applies a binary split to the data set. The process is repeated until the splits become too small for meaningful interpretation.
The result of the procedure is a graph that looks like a tree. Each node on the tree is a split of the data set. The node at the top of the tree is the variable that has the strongest association with yield (positive to the left; negative to the right) in the full data set. The process splits the data into two groups so that the yields of two groups are statistically different from each other. As you move down the tree, each node is a further split of the data using the variable that has the strongest association with yield in that group. The number of observations in a group decreases as you move down the tree.
Results and Discussion
Key Management Strategies to Increase Soybean Yield: Statewide Analysis (Figure 4)
- Maturity group: Over the 18-year period analyzed in this data set, growers entered soybean varieties from MG2 to MG8, and this distribution by MG has evolved over time (Figure 3a). In 2006, 56% of entries were ≧MG6 varieties, whereas by 2019, 0% of entries were ≧MG6. This downtrend in the usage of later-maturing varieties over time coincides with the increase in use of earlier-maturing varieties across the state. In 2002, 0% of entries were ≤MG3 varieties, whereas by 2019, 24% of entries were ≤MG3 varieties.
Maturity group was the most significant predictor of yield in the statewide analysis (Figure 4). In the conditional tree analysis, planting an MG≤4 resulted in an 18 bu/A yield advantage compared to planting an MG>4. After accounting for the impact of year, region, and interactions between the two, the highest yields were associated with MG3 (67 bu/A), followed by MG4 (64 bu/A) (Figure 8a). Yields continued to decline as MG increased, with the MG8 entries having the lowest yields (47 bu/A).
In parts of North Carolina, declines in specialty crop acres and subsequently simplified rotations have resulted in more intensively managed soybeans in the state, allowing for use of earlier-maturing varieties due to labor and equipment availability for earlier harvest. Other incentives for using earlier-maturing varieties have included the ability to harvest prior to fall hurricanes and the recognized yield benefits. Previous research (see Genetic Improvement of U.S. Soybean in Maturity Groups II, III, and IV) has indicated that the yield advantage from the genetic gain of earlier-maturing varieties (MG2, MG3, and MG4) is particularly pronounced in high-yielding environments. Recent small-plot research conducted in North Carolina has verified that MG3 and MG4 varieties maximize yield in high-yield situations (see “PFP21: Soybean Maturity Group”).
Our analysis indicated that shifting some acres to an earlier-maturing variety would be the most robust management change that would lead to potential soybean yield increases in the state, while recognizing that with inconsistent annual weather patterns, planting a range of MGs across planting dates is advisable. Risks are associated with producing earlier-maturing varieties in North Carolina, including seed quality declines, soybean green stem, and crop loss due to hurricanes. - Foliar fungicide use: From 2002 to 2007, a fungicide was applied to less than 30% of SYC entries (Figure 3g). Foliar fungicide use increased sharply in the SYC; by 2015 and until 2019, ≥60% of entries were managed with a foliar fungicide (Figure 3g).
Foliar fungicide use was the second strongest predictor of soybean yield, and provided considerable yield protection regardless of MG. In the conditional tree analysis, when MG≤4 was entered, foliar fungicide use provided an 11 bu/A yield protection; when MG>4 was entered, foliar fungicide use provided a 9 bu/A yield protection (Figure 4). After accounting for the impact of year, region, and interactions between the two, foliar fungicide use provided a 5.4 bu/A yield protection compared to acreage in which foliar fungicides was not used (Figure 8b).
Disease pressure is influenced by a range of factors, including environment, rotations, and varietal resistance. Soybean disease symptomatology can be both readily observable and also difficult to detect depending on the disease, which complicates management. In North Carolina, the most commonly encountered foliar diseases include frogeye leaf spot (Cercospora sojina) and Cercospora leaf blight (Cercospora kikuchii). Foliar fungicide applications are an option for effectively managing some foliar diseases in soybeans.
The results from our analysis indicate that the use of foliar fungicides is consistently associated with high soybean yields, presumably attributed to the reduction of yield loss from foliar diseases. Opportunities exist for more frequent scouting and subsequent management of foliar diseases in soybeans as a mechanism to protect soybean yield. Fungicide resistance is already present for some soybean diseases encountered in the Southeast (see “Widespread Occurrence of Quinone Outside Inhibitor Fungicide-Resistant Isolates of Cercospora Sojina, Causal Agent of Frogeye Leaf Spot of Soybean, in the United States”)To slow development of fungicide resistance while effectively managing foliar diseases, producers should use an integrated approach to managing foliar diseases. Such an approach should include cultural management, selection of resistant varieties when possible, scouting for foliar diseases, and rotating fungicides that use different chemical modes of action. - Planting date: Of the 877 SYC entries, 27% were planted prior to May, 54% were planted in May, and 19% were planted after May (Figure 3b), with the earliest planting date across the 18-year period being April 2 and the latest being July 14. This wide range of planting dates is reflective of soybean planting in North Carolina annually due to crop rotations used in this state.
Over the 18-year period, the trend showed a linear decline in soybean yield as the planting date was delayed (Figure 8c). In the conditional inference tree analysis, advantages from planting earlier were associated with yield increases of 11 bu/A and 5 bu/A with and without fungicide use, respectively, when earlier-maturing varieties were used (Figure 4). Recent small-plot research conducted in North Carolina also indicates that in high-yield environments, yield for earlier-maturing varieties declines as planting date is delayed (see "PFP21: Soybean Planting Date").
Despite annual differences that can occur due to variation in weather, earlier soybean planting dates have been recognized across the U.S. as an opportunity for increasing soybean yields (see "The Best Soybean Planting Date"). Recent analyses show that from 2006 to 2017, planting soybeans 12 days earlier across the U.S. could have resulted in 10% greater soybean yield (see “Identifying Optimal Soybean Planting Dates Across the U.S.”). The same study indicated that Southeast producers could have planted soybeans 30 days earlier than is typical (May 30 to June 8) to realize some of these yield benefits. Planting earlier allows for more vegetative growth, leading to increased node accumulation, and can align flowering with the longest days of the year to maximize photosynthesis and yield potential.
The optimal planting dates for soybeans in North Carolina have been historically identified as May 1 to June 10 (see “Planting Decisions” from the North Carolina Soybean Production Guide). Yet from 2016 to 2020, only 62% of soybeans in the state were planted by June 10 (USDA-NASS). It has been documented that in the Southeast, each day of delay in planting after mid-June reduces soybean yield by 0.5 bu/A (see “Seeding Rates for Full-Season and Double-Crop Soybean”). Previous analyses indicate that in other areas of the southern U.S., yield declines from delayed planting beginning as early as May 27 (see the Agronomy Journal article “A Regional Analysis of the Response of Soybean Yield to Planting Date”). Despite this information, the soybean planting window in North Carolina is wide and typically continues into mid-July due to drought or early-season tropical moisture. The soybean acres in North Carolina that could benefit from earlier planting are the full-season soybeans planted into June. From 2016 to 2020, only 52% of soybean acres were planted by late May (USDA-NASS); however, during this same period, double-crop acres accounted for only 14% to 35% of total soybean acres (USDA-NASS). Most soybean producers in the Southeast prioritize the establishment of other crops in their rotations before planting soybeans. Of the crops commonly planted in Southeast rotations, soybeans are the least sensitive to cold conditions early in the season; opportunities exist for planting soybeans prior to, or simultaneously with, other crops in producers’ rotations (see “Planting Soybeans with Cool Weather on the Horizon”). One of the concerns with earlier-than-typical soybean planting in North Carolina would be frost injury on seedlings; however, this is not typically observed until temperatures drop below 28°F for four or more hours (see the video Soybean Emergence and Germination Common Issues). The robustness of soybeans to withstand some cold conditions, coupled with the results from this analysis, could provide incentives for North Carolina producers to consider planting soybeans before their other crops to avoid pushing soybean planting past the period for optimal yield. - Seeding rate: Soybean seeding rate was reported by producers in lbs/A, which was a common mechanism of reporting seeding rate when the contest began, rather than using population, which is more common now. Producers lowered their soybean seeding rates over the 18-year duration of this analysis, with 100% of producers planting >47 lbs soybean seed/A in 2002 and only 19% of producers planting >47 lbs soybean seed/A in 2019 (Figure 3c). This reduction in seeding rate coincides with the drastic decline in use of a drill for soybean planting in North Carolina, when vacuum and precision planters became more commonly used planting mechanisms. The use of lower seeding rates has also been driven by higher seed cost and extensive data in research experiments indicating that lower seeding rates often optimize profit (see the Agronomy Journal article “Defining Optimal Soybean Seeding Rates and Associated Risk Across North America”).
Soybean yield declined as seeding rate increased across the 877 entries (Figure 8d). In the conditional inference tree analysis, seeding rate was an important predictor of yield for MG≤4 varieties, with the application of a fungicide at planting dates after May 12, with a 7 bu/A yield advantage from seeding 47 lbs soybean seed/A or less compared to higher seeding rates (Figure 4).
North Carolina producers are at maximum yield potential if they achieve final populations of 75,000 and 90,000 plants/A in soybeans planted in May and June, respectively (see “Planting Decisions” in the North Carolina Soybean Production Guide). A recent national analysis of 211 field sites suggested that lower soybean seeding rates could be used in higher-yielding environments such as those typically encountered in an SYC (see the Agronomy Journal article “Defining Optimal Soybean Seeding Rates and Associated Risk Across North America”). The ability of the soybean plant to compensate at low populations is likely a result of breeding efforts that have resulted in higher yield potential per plant (see “Soybean Plant Population Density”). As soybean seed price increases, producers may become more interested in reducing seeding rates as long as it does not compromise soybean yield. Results from our analysis indicate that soybean seeding rates may be lowered in some circumstances, which could result in similar or higher soybean yield and subsequently higher economic returns. - Herbicide use: At the beginning of the 18-year period in this data set (2002), 56% of entries used ≤1 herbicide application to manage weeds; by 2019, 0% of entries used ≤1 herbicide application (Figure 3h). The trend of entries with ≤1 herbicide application declined after 2005 when Palmer amaranth was confirmed to be glyphosate-resistant in the state (see the Journal of Cotton Science article “Weed Science: Distribution of Glyphosate-Resistant Palmer Amaranth (Amaranthus palmerii) in Georgia and North Carolina During 2005 and 2006”). Interestingly, during the 2002–2005 period, herbicide use had the most significant impact on yield compared to other periods in this analysis, which is likely indicative of the challenges growers encountered with managing herbicide-resistant weeds with single herbicide applications. More frequent herbicide applications resulted in higher soybean yields (Figure 4 and Figure 8e). Our analysis indicates that a multifaceted approach to chemical weed management is often necessary to protect soybean yield.
Key Management Strategies to Increase Soybean Yield: Coastal Plain (Figure 5)
- Maturity group: Similar to the statewide analysis, using earlier-maturing varieties was the strongest predictor of high soybean yield in the coastal plain, but the yield benefits observed were shifted slightly later in maturity. In the coastal plain region, using a MG≤5 variety yielded 69 bu/A compared to using a later-maturing variety, which averaged 53 bu/A.
- Foliar fungicide use: The second strongest predictor of high soybean yield in the coastal plain when earlier-maturing varieties (MG≤5) were grown was the use of a foliar fungicide, which provided an 11 bu/A yield advantage over entries in which a foliar fungicide was not used.
- Herbicide use: For later-maturing varieties (MG>5), using more than one herbicide application provided an 8 bu/A yield advantage in the coastal plain compared to entries submitted with ≤1 herbicide application.
- Fungicidal seed treatment: In high-yielding situations in the coastal plain in which earlier-maturing varieties were used and foliar diseases were managed, a fungicidal seed treatment provided a 9 bu/A yield advantage.
- Seeding rate: Entries that did not receive a fungicidal seed treatment that were planted with less than 40 lbs soybean seed/A had a 9 bu/A advantage over entries planted with more than 40 lbs soybean seed/A.
Key Management Strategies to Increase Soybean Yield: Piedmont (Figure 6)
- Maturity group: Consistent with the statewide analysis, the strongest predictor of soybean yield in the piedmont was MG, with MG≤4 providing a 19 bu/A yield advantage over later-maturing varieties.
- Foliar fungicide use: Regardless of MG, foliar fungicide use was a strong predictor of high soybean yield in the piedmont.
- Irrigation: For earlier-maturing varieties, irrigation was key to reaching the highest yield levels in the piedmont, with irrigated entries averaging 92 bu/A and nonirrigated entries averaging 77 bu/A.
- Herbicide use: Herbicide use was a significant predictor of yield in the piedmont only with later-maturing varieties that did not receive a foliar fungicide. In this group, using more than one herbicide application provided a 6 bu/A yield advantage in the piedmont compared to entries submitted with ≤1 herbicide application.
- Planting date: In the highest-yielding situations in the piedmont, there was an advantage to planting prior to mid-May.
Key Management Strategies to Increase Soybean Yield: Tidewater (Figure 7)
- Planting date: In the tidewater region, planting on or before May 23 was the most important predictor of soybean yield. Many producers in this region have already transitioned to earlier-maturing varieties (with 72% of the entries from this region using an MG≤4 variety), which is likely why MG didn’t show up as the most significant predictor in this region. In higher-yielding situations in which a foliar fungicide was used, there were yield advantages to planting earlier than May 1.
- Foliar fungicide use: Similar to the statewide yield contest analysis, foliar fungicide was the second strongest predictor of high soybean yield, regardless of planting date in this region.
- Maturity group: The highest-yielding scenarios in the tidewater region were MG≤3 planted earlier than mid-May.
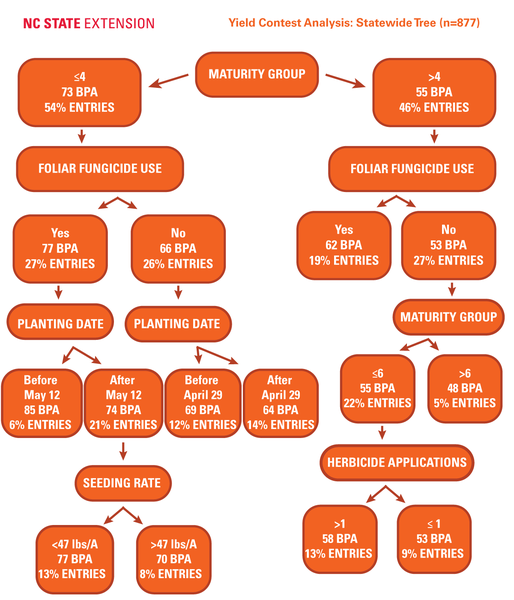
Figure 4. Conditional inference tree for management impact on soybean yield across 877 statewide entries.
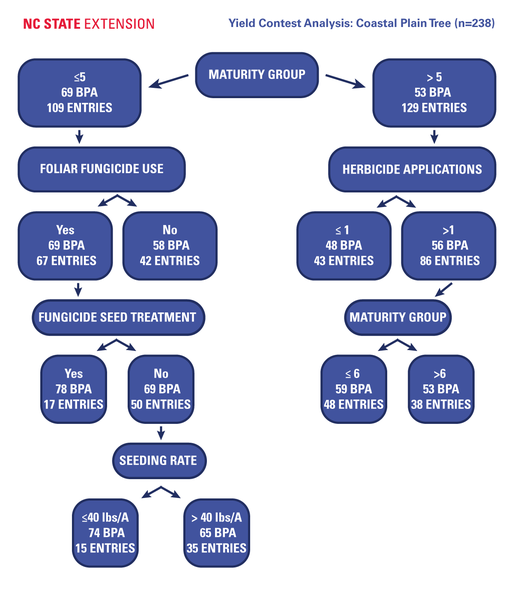
Figure 5. Conditional inference tree for management impact on soybean yield across the 238 SYC coastal plain entries.
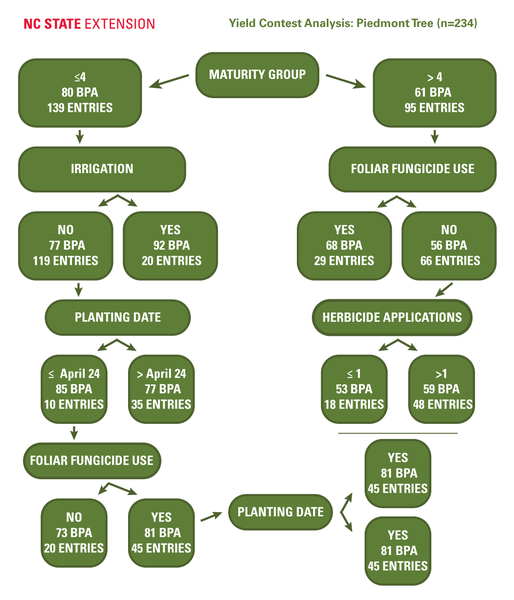
Figure 6. Conditional inference tree for management impact on soybean yield across the 234 SYC piedmont entries.
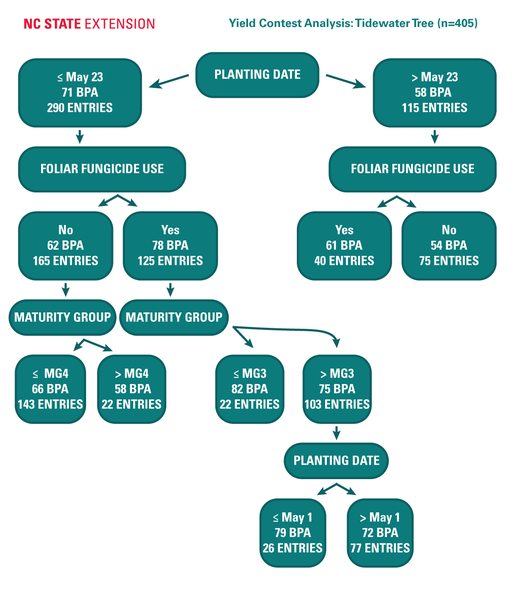
Figure 7. Conditional inference tree for management impact on soybean yield across the 405 SYC tidewater entries.
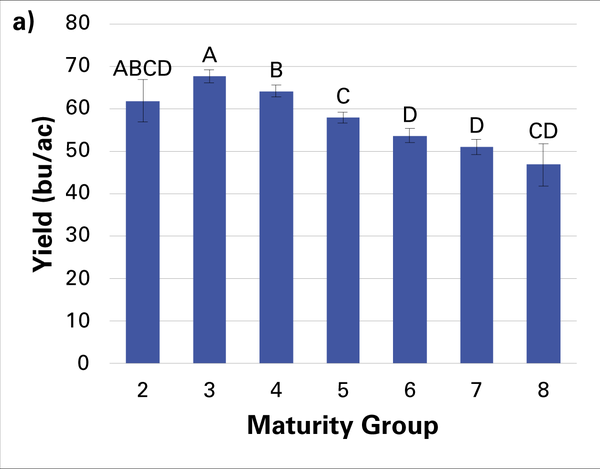
Figure 8a. The impact of soybean maturity group on soybean yield from 2002 to 2019 in the North Carolina Soybean Yield Contest.
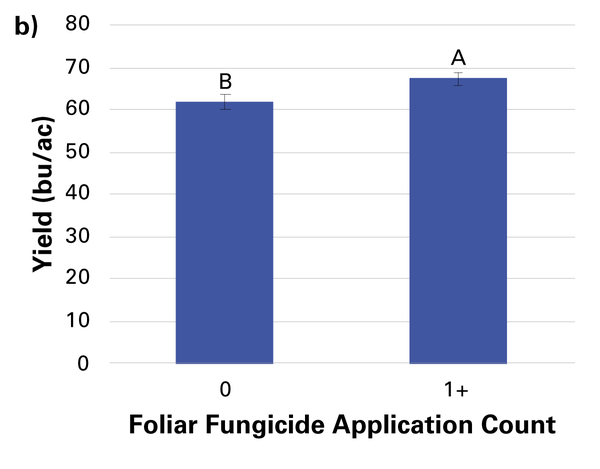
Figure 8b. The impact of foliar fungicide used on soybean yield from 2002 to 2019 in the North Carolina Soybean Yield Contest.
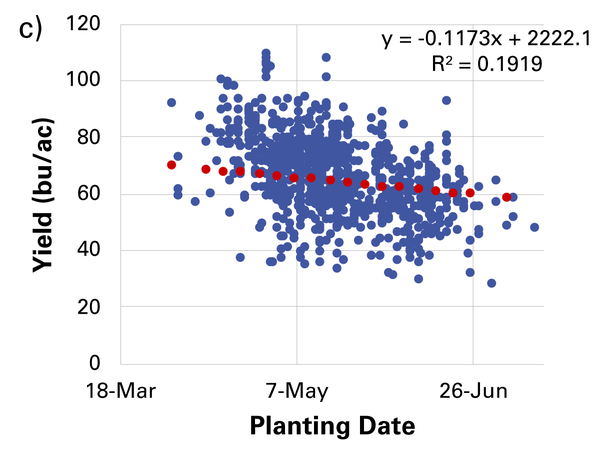
Figure 8c. The impact of soybean planting date on soybean yield from 2002 to 2019 in the North Carolina Soybean Yield Contest.
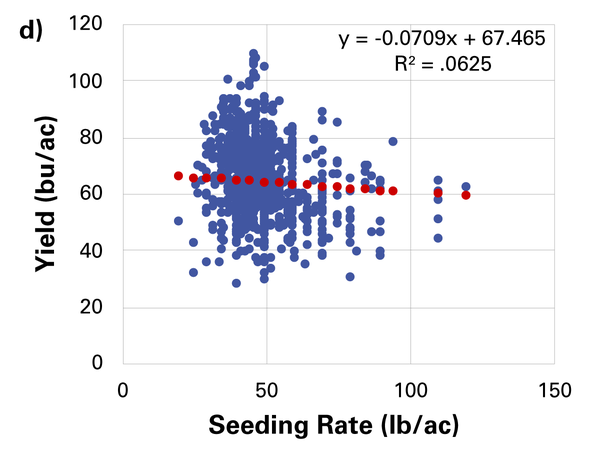
Figure 8d. The impact of soybean seeding rate on soybean yield from 2002 to 2019 in the North Carolina Soybean Yield Contest.
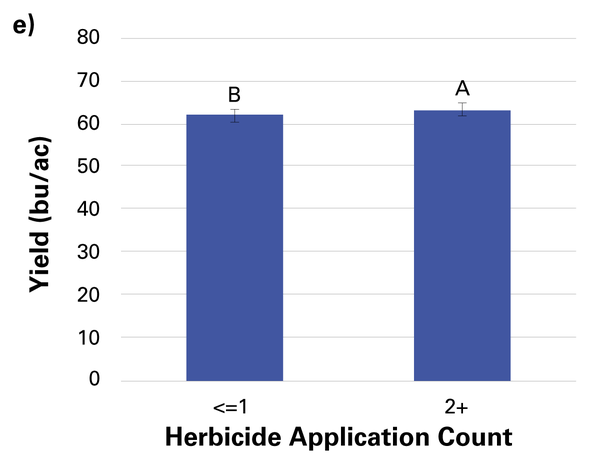
Figure 8e. The impact of number of herbicide applications on soybean yield from 2002 to 2019 in the North Carolina Soybean Yield Contest.
Management Strategies That Did Not Impact Soybean Yield
- Tillage: Fifty-one percent of entries were no-till, and 49% of entries had at least one tillage pass (Figure 3e). Tillage was not a strong predictor of yield, indicating that even in high-yield situations, producers can successfully grow soybeans in a range of tillage scenarios in North Carolina.
- Inoculant: There was minimal use of a seed inoculant in the SYC until 2017 (Figure 3k). In 2018 and 2019, use increased to 44% and 57%, respectively. The use of seed-applied inoculant was not a strong predictor of soybean yield in our analysis. There may be circumstances in which inoculating soybeans is necessary to ensure N-fixation; however, recent research across multiple states showed that both seed-applied and soil-applied inoculants did not impact soybean yield in fields where soybean has been grown recently (see “Soybean Yield, Biological N2 Fixation and Seed Composition Responses to Additional Inoculation in the United States”). These conditions would infrequently be encountered in fields entered into an SYC. NC State Extension continues to recommend that soybean inoculation is necessary only in fields where soybeans have not been grown for four to five years (see “Planting Decisions” in the North Carolina Soybean Production Guide).
- Foliar insecticide use: Foliar insecticide use did not change drastically over the 18-year period in this analysis. A foliar insecticide application was made in 50% of the SYC entries from 2002 to 2019 (Figure 3i). Foliar insecticide use did not impact soybean yield in statewide analysis. The standard management practice in North Carolina is to use thresholds to trigger foliar insecticide applications. Presumably, fields entered into the SYC were scouted and sprayed with an insecticide as merited based on thresholds, and the fields that were not sprayed did not meet thresholds, thus explaining the lack of impact on soybean yield from foliar insecticide use.
- Row spacing: Of the 877 SYC entries, 32% had drilled row spacing (≤10 in), 55% had row spacing of 15 to 24 in, and 13% had wide row spacing of ≥30 in (Figure 3d). Row spacing use shifted drastically over the period evaluated in our analysis. In 2002, 56% of entries used row spacing of ≤10 in; by 2019, only 7% of entries used row spacing of ≤10 in. The majority of the shift in row spacing across entries was from declining use of drilled row spacing (≤10 in) coupled with increasing adoption of row spacing of 15 to 24 in (Figure 3). SYC entries using wide row spacing (30 in) were consistently low (6% to 21%) across the 18-year period (Figure 3d).
Row spacing did not impact yield in our analysis. This is consistent with a recent analysis of management practices on soybean yield in 3,568 producer fields in the Upper Midwest, which determined no influence of row spacing on soybean yield (see Benchmarking Soybean Production Systems in the North Central US). Recent analyses across the U.S. show that row spacing typically has minimal impact on soybean yield when other optimum production practices are employed—for example, on-time planting, effective weed management, and no limiting soil moisture (see "How to Pick the Right Soybean Row Spacing").
In contrast, small-plot research in North Carolina has often shown yield advantages from narrow (15 in) versus wider (30 in) row spacing, but this may be due to the use of later planting dates in these plots (see “Planting Decisions” in the North Carolina Soybean Production Guide). Producers entering the SYC are typically using earlier-than-average soybean planting dates, which may negate the positive impact of narrower row spacing on yield observed in recent small-plot research. Also in producer fields, wheel-track damage from pest management can lead to 1% to 5% yield declines in narrow rows not typically observed in small-plot research due to differing methods of pest management between producer fields and these plots (see “Wheel Traffic to Narrow-Row Reproductive-Stage Soybean Lowers Yield”).
Our analysis did not show a soybean yield advantage from the use of a particular row spacing; however, in an average soybean field in North Carolina where planting dates may be later and weed control may be used less than fields entered into the SYC, benefits from 15-in row spacing may be more aligned with the benefits documented in small-plot research in North Carolina and other U.S. regions. A more important potential benefit of investing in a narrower row planter for soybean planting in the Southeast would be to facilitate soybean planting simultaneously with row crops to ensure soybeans are planted early enough to maximize yield.
Implications for North Carolina Soybean Production
Planting date and MG were identified as consistently impacting yield across the state in our analysis. Producers in North Carolina can modify their production practices for these two management factors without any additional economic investment. There are rotational limitations to shifting planting date and MG use in this state. However, if producers were to realize some of the yield benefits from adjusting these fundamental soybean production practices, it could provide incentive for them to reexamine the priority of rotating soybeans or using custom harvesters. Use of foliar fungicides and herbicides was also often identified as an important predictor of soybean yield. Use of foliar fungicides and robust weed management programs have also been identified as strong predictors of yield in other U.S. regions. Soybean producers should try to evaluate production practices identified both in our analysis and in small-plot research that have been consistently associated with high soybean yields. While we focused on above-average yielding soybean production systems, important inferences can be made about how production practices significantly contribute to yield in this state.
Acknowledgements
This publication is modified from the May 2021 article “Production Practices that Maximize Soybean Yield: What We Have Learned from the North Carolina Soybean Yield Contest” by Rachel A. Vann, Katherine Drake-Stowe, Greg S. Buol, and E. Jim Dunphy in Agronomy Journal, volume 113, number 6: pages 3399—3417.
Publication date: Jan. 5, 2022
AG-835
Other Publications in North Carolina Soybean Production Guide
- The Soybean Plant
- Soybean Production and Marketing in North Carolina
- Rotational Considerations
- Variety Selection
- Planting Decisions
- Fertilization and Nutrient Management
- Weed Management
- Disease and Nematode Management
- Insect Management
- Key Management Strategies to Increase North Carolina Soybean Yield: What We Have Learned From 877 Soybean Yield Contest Entries
- Harvesting, Drying, and Storage
- Soybean Facts
Recommendations for the use of agricultural chemicals are included in this publication as a convenience to the reader. The use of brand names and any mention or listing of commercial products or services in this publication does not imply endorsement by NC State University or N.C. A&T State University nor discrimination against similar products or services not mentioned. Individuals who use agricultural chemicals are responsible for ensuring that the intended use complies with current regulations and conforms to the product label. Be sure to obtain current information about usage regulations and examine a current product label before applying any chemical. For assistance, contact your local N.C. Cooperative Extension county center.
N.C. Cooperative Extension prohibits discrimination and harassment regardless of age, color, disability, family and marital status, gender identity, national origin, political beliefs, race, religion, sex (including pregnancy), sexual orientation and veteran status.