
Technical Bulletin 335
January 2014
J. C. Burns, Professor, Departments of Crop Science and Animal Science, North Carolina State University; Collaborator, U.S. Department of Agriculture—Agricultural Research Service
D. S. Fisher, Statistician, Syngenta Biotechnology, Inc, Research Triangle Park, NC; Former Research Leader, U.S. Department of Agriculture—Agricultural Research Service, Watkinsville, GA
E. S. Leonard, Research Analyst, Department of Crop Science, North Carolina State University and U.S. Department of Agriculture—Agricultural Research Service
The research reported in this publication was funded by the North Carolina Agricultural Research Service (NCARS) and by the United States Department of Agricultural, Agricultural Research Service (USDA-ARS), as part of a joint forage-animal research program. Mention of trade names, proprietary products, or specific equipment does not constitute a guarantee or warranty by either NCARS or USDA-ARS and does not imply its approval to the exclusion of other products that may be suitable.
Cover photographs courtesy of the NCARS and USDA–ARS.
Contents
Abstract
Glossary of Forage Names
Introduction
I. Evaluation of Nutritive Value and Quality of Perennial Warm-Season Grasses
Experiment 1. Comparison of Bermudagrass, Yellow Bluestem, and Coastal Panicgrass: Nutritive Value, Quality, and Masticate Characteristics
Experiment 2. Plant Morphology and Cultivar within Morphologies: Effects on Dry Matter Intake, Digestibility, Mastication, and Preference
Experiment 3. Switchgrass and Caucasian Bluestem Hays Harvested in the P.M. and A.M.: Changes in Nutritive Value, Dry Matter Intake, Digestibility, and Preference
Experiment 4. Warm-Season and Cool-Season Grasses with Similar Concentrations of Neutral Detergent Fiber: Dry Matter Intake, Digestibility, and Digesta Kinetics
II. Evaluation of Maturity Influences on Quality of Perennial Warm-Season Grasses
Experiment 5. Increasing Maturity of Initial-Growth Switchgrass: Dry Matter Intake, Digestibility, and Chewing Behavior
Experiment 6. Increasing Maturity of Initial-Growth Switchgrass: Dry Matter Intake, Digestibility, and Digesta Kinetics
Experiment 7. Switchgrass and Tall Fescue Harvested at Similar Physiological Growth Stages: Changes in Dry Matter Intake and Masticate Characteristics
Experiment 8. Maturity Changes in Initial-Growth Switchgrass and Flaccidgrass: Nutritive Value and Quality
Experiment 9. Increasing Maturity of Flaccidgrass: Nutritive Value and Quality
Experiment 10. Advancing Maturity of Switchgrass and Flaccidgrass: Trends in Nutritive Value and Quality when Fed Fresh Daily
Experiment 11. Initial and Regrowth Flaccidgrass and Switchgrass: Nutritive Value and Quality
Experiment 12. Initial-Growth Flaccidgrass Cut after Heading: Changes in Nutritive Value and Quality
Experiment 13. Eastern Gamagrass Cut at Three Maturities: Changes in Nutritive Value and Quality
III. Evaluation of Increased Ad Libitum Feeding on Forage Quality
Experiment 14. Increasing the Level of Ad Libitum Feeding of Vegetative and Headed Switchgrass Hay: Dry Matter Intake and Digestibility
Experiment 15. Increasing the Level of Ad Libitum Feeding of Flaccidgrass Hay: Dry Matter Intake and Digestibility
IV. Evaluation Among a Legume and Cool-Season and Warm-Season Grasses
Experiment 16. Alfalfa, Warm-Season and Cool-Season Grasses: Differences in Nutritive Value and Quality
Experiment 17. Alfalfa: Crude Protein Source in Switchgrass Hay Diets
V. Evaluation of Preservation Methods on Nutritive Value and Quality of Perennial Grasses
Experiment 18. Flaccidgrass: The Influence of Drying Methods on its Nutritive Value and Quality
Appendices
I. General Procedures of Experimentation
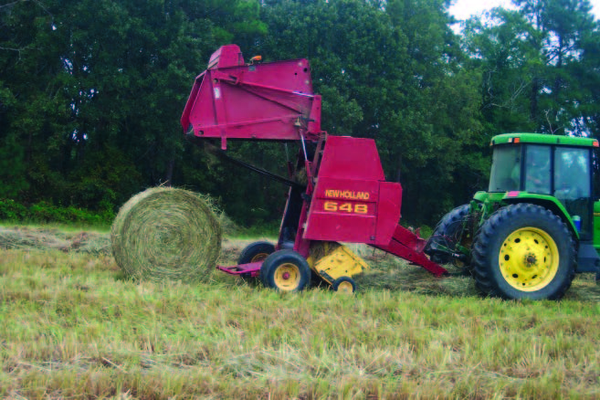
GP-1. Hay Handling
GP-2. Dry Matter Intake and Apparent Whole Tract Digestibility
GP-3. Masticate Collection and Processing and Chewing Behavior
GP-4. Preference Experiments
GP-5. Particle Size Determination
GP-6. Digesta Kinetics
GP-7. Laboratory Analyses
GP-8. Statistical Analysis
II. References and Recent Related Publications
References
Recent Related Publications
Abstract
This bulletin brings together 18 independent experiments that address aspects of nutritive value (chemical composition) and quality (animal responses) of perennial warm-season forages preserved as hay. Although each experiment was conducted independently, those with commonality have been grouped and appear under five different headings. Our focus in this bulletin is on warm-season grasses. Some experiments have also been included, however, that included forages other than warm-season grasses (tall fescue, orchardgrass, and alfalfa) in the comparisons.
Our intent in producing this bulletin is to make available original research data and associated methodology in a summarized format for future reference. A brief Results and Discussion section has been included for each experiment followed by a brief Summary and Conclusions of the major findings. Consequently, the interested reader is directed to the Summary and Conclusion section at the end of each experiment for an assessment of the findings that has not been reported elsewhere.
Glossary of Forage Names
| Cool-season grasses: | ||
|---|---|---|
| Common name | Scientific Name | Experiment |
| Orchardgrass | Dactylis glomerata L. | 16 |
|
Tall fescue |
Festuca arundinacea Schreb. or Lolium arundinacea (Schreb.) Darbysh |
4, 7, 16 |
| Warm-season grasses: | ||
|---|---|---|
| Common name | Scientific Name | Experiment |
| Bermudagrass | Cynodon dactylon (L.) Pers. | 1, 2, 4, 16 |
| Caucasian bluestem | Bothriochloa bladhi (Retz.) S.T. Blake | 3 |
| Coastal panicgrass | Panicum amarum var. amarulum | 1 |
| Eastern gamagrass | Tripsacum dactyloides (L.) L. | 13 |
| Flaccidgrass | Pennisetum flaccidum Griseb. | 8, 9, 10, 11, 12, 15, 18 |
| Switchgrass (SG) | Panicum virgatum L. | 2, 3, 4, 5, 6, 7, 8, 10, 11, 14, 17 |
| Yellow bluestem | Bothriochloa ischaemum var. ischaemum | 1 |
| Legume: | ||
|---|---|---|
| Common name | Scientific Name | Experiment |
| Alfalfa | Medicago sativa L. | 16, 17 |
Introduction
The U.S. Mid-Atlantic Region encompasses the North‒South transition zone (which includes the region bounded on the north from the Atlantic coast west across southern Indiana, central Missouri, and west to southeastern Kansas, and on the south from northeastern Oklahoma back east to the Atlantic coast, crossing central Arkansas and the northern portions of Mississippi, Alabama, Georgia, and South Carolina). Cool-season grasses are better adapted north of the transition zone, and warm-season grasses are better adapted south of the transition zone. Both cool- and warm-season perennial grasses, however, are productive in the transition zone and can be incorporated in pasture and haying systems.
Tall fescue has been the predominant perennial cool-season grass grown throughout the transition zone, with orchardgrass as a distant second, although both have been utilized for pasture and conserved as hay. Both grasses are most productive in the spring (April through early June), and their growth begins to decline in late June with the onset of elevated temperatures and variable periods of drought. Growth resumes in mid-September with the onset of cool nights and fall rainfall. Fall growth of tall fescue is vegetative and may be used by grazing animals through November (and periodically in winter), or it may be stockpiled for late fall and winter grazing.
Coastal bermudagrass has been the dominant perennial warm-season grass grown across the Upper South and the transition zone, providing forage during the summer. It is extremely productive when well fertilized, serving both as a pasture and hay species. One of its limiting attributes is its relatively modest nutritive value, resulting in only moderate animal average daily gain but with excellent carrying capacity (heavy stocking rates). Coastal and other more recent bermudagrass releases initiate growth in mid-April and are very productive from June until late August, when nighttime temperatures fall below 55°F. Growth after August declines rapidly until winter dormancy begins at first frost.
In this technical bulletin, we present results from several experiments designed to evaluate various introduced or native perennial warm-season grasses that have potential for grazing systems or when preserved as feed (hay, baleage, silage) for beef- or dairy-cattle production systems in the Upper South. Some experiments included aspects of tall fescue and orchardgrass that allowed us to further address their nutritive value and quality. Our main focus in this bulletin, however, is to provide a record of the original data obtained from 18 different experiments designed to evaluate aspects of selected perennial warm-season grasses that might contribute to improved animal daily performance. These grasses may contribute to animal performance during periods of summer stress (elevated temperatures and periods of drought resulting in dry soils) and as a feed source during the winter. Only the main points have been highlighted in the Results and Discussion sections and in the Summary and Conclusions sections. The general procedures used in conducting the research presented in this bulletin are described in the Appendices. Throughout the bulletin, “nutritive value” refers to laboratory estimates of dry matter disappearance and the chemical composition of the forage, such as crude protein and fiber characteristics. The use of the term “quality” refers to animal responses, such as dry matter intake, dry matter digestibility, and animal preference.
I. Evaluation of Nutritive Value and Quality of Perennial Warm-Season Grasses
Experiment 1. Comparison of Bermudagrass, Yellow Bluestem and Coastal Panicgrass: Nutritive Value, Quality, and Masticate Characteristics
The Upper South extends into the U.S. North‒South transition zone in which neither perennial cool-season grasses nor perennial warm-season grasses are most productive. When both types of grasses are grown in a single grazing system, however, they can provide productive pastures or sources of hay, or both, during the growing season. Bermudagrass has been one of the dominant perennial warm-season grasses for the Upper South. However, while productive, the nutritive value of bermudagrass is only moderate. Consequently, it is of interest to determine the potential of other perennial warm-season grasses for the Upper South.
Our objective in this study was to compare the quality of the improved bermudagrass cultivar Tifton 44 with yellow bluestem and coastal panicgrass as potential warm-season grasses for the region.
Material and Methods
Well-established stands of Tifton 44 bermudagrass, WW Spar yellow bluestem, and Atlantic Coastal panicgrass provided the experimental hays. The fields of the three hays were burned in late February to remove all growth from the previous fall. The fields were subsequently top-dressed with 70 pounds of nitrogen per acre in late March. Two maturities each of bermudagrass and yellow bluestem along with one maturity of coastal panicgrass were evaluated. Treatments were as follows:
Tifton 44 bermudagrass:
- Vegetative, cut June 7
- Heading, cut August 24
WW Spar yellow bluestem:
- Vegetative, cut June 5
- Heading, cut July 20
Atlantic Coastal panicgrass
- Vegetative, cut June 29
Each treatment was flail-chopped to an approximate 3-inch stubble, blown into a self-unloading wagon, and transported to a bulk-drying barn located at the NC State University Forage-Animal Metabolism Unit in Raleigh, NC. The forage was unloaded and forced-air dried overnight with an air inlet temperature of 165°F to approximately 90% dry matter. The following day the hay was baled with a conventional square baler and the bales stored on wooden pallets in an experimental-hay storage barn until fed. Because the hay had been flail-chopped (reduced to 3 to 6 inches) no further processing was needed prior to feeding (Appendix GP-1).
Two experiments were conducted consisting of an intake and digestibility experiment (Experiment 1A) and a mastication experiment (Experiment 1B). Dry matter intake and digestibility measurements in Experiment 1A were obtained using British-bred steers in a randomized complete block with four steer (replicates) per treatment. Twenty steers (weight ranged from 442 to 611 pounds; mean weight = 520 ± 59 pounds) were blocked by weight into four groups of five steers each and randomly assigned within block to the five hay treatments. Intake and digestibility estimates were obtained according to standard procedures (Appendix GP-2).
In Experiment 1B, four esophageally cannulated steers were used in a randomized complete block design. The steers were fed each of the hays over two days with chewing behavior assessed using standard procedures (Appendix GP-3). The collected whole masticate was split and one part used for nutritive value estimates and the other part sieved to determine median particle size and the particle-size classes of large, medium, and small. Fecal samples were also sieved similarly for each treatment (Appendix GP-5).
All as-fed hay, weighback, and whole masticate samples were analyzed for nutritive value and fecal samples for chemical composition according to standard procedures (Appendix GP-7). The data were analyzed statistically according to the experimental design (Appendix GP-8).
Results and Discussion
Experiment 1A
The intake by steers of vegetative bermudagrass was greater than the mean intake of vegetative yellow bluestem plus panicgrass (Table 1.1). The average digestible intake of hemicellulose was also greater for vegetative bermudagrass than for vegetative yellow bluestem plus panicgrass. Vegetative yellow bluestem had greater dry matter intake than panicgrass, as well as greater dry matter digestibility and digestibility of neutral detergent fiber and its fiber constituents. This resulted in greater digestible intakes of dry matter and neutral detergent fiber and its fiber constituents. In general, vegetative panicgrass was inferior in feed quality to bermudagrass, including dry matter intake and in both digestibility of dry matter and fiber fractions as well as the digestible intakes of dry matter and fiber fractions.
Increasing maturity (vegetative vs. heading) decreased dry matter intake and resulted in decreased digestible intakes of dry matter and neutral detergent fiber and its constituent fiber fractions for both bermudagrass and yellow bluestem. In the case of yellow bluestem, dry matter intake was not significantly reduced by maturity, Nevertheless, yellow bluestem’s lesser dry matter intake and the lesser digestibility of dry matter and neutral detergent fiber of the heading hay resulted in lesser digestible intakes of dry matter, neutral detergent fiber, and hemicellulose, indicating reduced forage quality.
The as-fed hays reflected the animal responses, with vegetative bermudagrass inferior in in vitro dry matter disappearance and constituent fiber fractions compared with the mean of vegetative yellow bluestem plus panicgrass (Table 1.2). Yellow bluestem generally had greater nutritive value than panicgrass. As expected, both bermudagrass and yellow bluestem had lesser nutritive value (lesser in vitro dry matter disappearance and crude protein, and greater fiber) when heading compared with the vegetative stage. Difference values (weighback concentration minus as-fed concentration) indicate that some selective consumption occurred, which results in greater neutral detergent fiber in the weighback than in the as-fed hay. The difference values for bermudagrass were generally less than the mean of yellow bluestem plus panicgrass. Also, selectivity was greater for panicgrass than for yellow bluestem, and greater selectivity was noted for heading hay than for the vegetative hays.
Experiment 1B
The masticate from the three vegetative hays and the two heading hays differed in dry matter concentrations as well as in nutritive value, but chewing during ingestion generally resulted in similar median particle size and similar proportions of large, medium, and small particles (Table 1.3). The dry matter concentrations among the vegetative hays were least for panicgrass, indicating greater saliva incorporation during mastication. The nutritive value of the bermudagrass masticate was less than the mean nutritive value of yellow bluestem plus panicgrass, being lesser in in vitro dry matter disappearance and crude protein and greater in neutral detergent fiber. Yellow bluestem masticate was greater in nutritive value than panicgrass masticate. The maturity effect, whether bermudagrass or yellow bluestem, reduced the nutritive value of the masticate.
Steers chewed vegetative bermudagrass hay similarly to the average of the vegetative yellow bluestem plus panicgrass. Steers chewed panicgrass more per minute compared with yellow bluestem (Table 1.4), which is consistent with the reduced dry matter concentrations noted for panicgrass (Table 1.3). After heading, steers altered their chewing behavior with bermudagrass, having fewer chews per minute and more chews per gram of dry matter, in vitro dry matter disappearance, and neutral detergent fiber. Stage of growth did not alter steers’ chewing behavior with yellow bluestem. This may be, in part, attributed to a greater degree of selective consumption, which would result in masticate dry matter of greater nutritive value. The chews required per bolus and time spent chewing each bolus was similar among masticates of all hays. However, the compositional differences of the hays altered the fecal composition (Table 1.5).
In general, feces from steers fed bermudagrass hay were lesser in crude protein and greater in neutral detergent fiber and its constituent fiber fractions than feces from steers fed yellow bluestem hay. Further, feces from steers fed yellow bluestem hay were generally greater in concentrations of crude protein and lesser in neutral detergent fiber and constituent fiber fractions than feces from steers fed panicgrass hay. For both bermudagrass and yellow bluestem, increasing the hay’s maturity generally decreased crude protein and increased the fiber concentrations in the steers’ feces.
Summary and Conclusion
- When cut in the vegetative stage, hays of bermudagrass and yellow bluestem were greater in forage quality than coastal panicgrass hay.
- Hays of bermudagrass cut when heading were lesser in quality compared to the vegetative stage, but dry matter intake and digestibility of yellow bluestem was not significantly altered by maturity, although digestible dry matter intake was reduced.
- The diet steers selected when fed vegetative hays was generally greatest in nutritive value for yellow bluestem and least for bermudagrass.
- Steers generally chewed the three vegetative hays similarly. But for hays cut when heading, bermudagrass resulted in fewer chews per minute and more chews per gram of dry matter, in vitro dry matter disappearance, and neutral detergent fiber.
- Concentrations of fecal crude protein and fiber fractions differed among the hays, whether vegetative or heading.
- All three hays cut when vegetative can be used in animal production systems, with yellow bluestem having quality characteristics that would support acceptable animal performance.
| Grass | DMI (lb/100 lb2) |
Digestibilities1 | Digestible Intakes | ||||||||
|---|---|---|---|---|---|---|---|---|---|---|---|
| DM (%) |
NDF (%) |
ADF (%) |
HEMI (%) |
CELL (%) |
DM (lb/100 lb2) |
NDF (lb/100 lb2) |
ADF (lb/100 lb2) |
HEMI (lb/100 lb2) |
CELL (lb/100 lb2) |
||
| Vegetative (VT): | |||||||||||
| Bermudagrass (BG) | 2.733 | 57.4 | 58.5 | 54.0 | 62.4 | 64.2 | 1.57 | 1.19 | 0.52 | 0.66 | 0.51 |
| Yellow bluestem (YB) | 2.85 | 67.1 | 69.7 | 66.3 | 73.2 | 74.5 | 1.91 | 1.40 | 0.67 | 0.72 | 0.64 |
| Coastal panicgrass (PG) | 1.21 | 48.0 | 50.5 | 41.9 | 59.1 | 56.0 | 0.62 | 0.49 | 0.23 | 0.27 | 0.24 |
| Headed (HD): | |||||||||||
| BG | 1.31 | 49.8 | 48.9 | 44.8 | 53.0 | 53.2 | 0.65 | 0.51 | 0.23 | 0.27 | 0.22 |
| YB | 2.36 | 59.8 | 62.2 | 59.5 | 65.5 | 69.1 | 1.41 | 1.07 | 0.58 | 0.49 | 0.57 |
| Significance (P): | |||||||||||
| Grass | <0.01 | 0.09 | 0.07 | 0.14 | 0.02 | 0.05 | <0.01 | <0.01 | <0.01 | <0.01 | <0.01 |
| VT: | |||||||||||
| BG vs. (YB+PG) | 0.02 | 0.97 | 0.79 | 0.99 | 0.41 | 0.86 | 0.07 | 0.06 | 0.27 | 0.01 | 0.19 |
| YB vs. PG | <0.01 | 0.02 | 0.02 | 0.03 | 0.02 | 0.02 | <0.01 | <0.01 | <0.01 | <0.01 | <0.01 |
| Maturity: | |||||||||||
| BG: VT vs. HD | <0.01 | 0.29 | 0.20 | 0.37 | 0.09 | 0.13 | <0.01 | <0.01 | <0.01 | <0.01 | <0.01 |
| YB: VT vs. HD | 0.12 | 0.30 | 0.31 | 0.50 | 0.16 | 0.44 | 0.01 | 0.03 | 0.22 | <0.01 | 0.25 |
| MSD4 | 0.60 | 17.0 | 17.3 | 25.0 | 11.9 | 16.4 | 0.35 | 0.27 | 0.15 | 0.13 | 0.12 |
1 NDF = neutral detergent fiber; ADF = acid detergent fiber; HEMI = hemicellulose; CELL = cellulose. ↲
2 Body weight basis. ↲
3 Each value is the mean of four steers. ↲
4 MSD = minimum significant difference from the Waller-Duncan k-ratio (k = 100) t-test and can be used to compare any two grasses. ↲
| Grass | IVDMD | CP | NDF | Fiber Fractions | ||||||
|---|---|---|---|---|---|---|---|---|---|---|
| AF2 (%) |
DV3 (%) |
AF (%) |
DV (%) |
AF (%) |
DV (%) |
ADF (%) |
HEMI (%) |
CELL (%) |
Lignin (%) |
|
| Vegetative (VT): | ||||||||||
| Bermudagrass (BG) | 53.54 | -0.3 | 10.3 | -0.4 | 74.6 | 0.7 | 35.6 | 39.0 | 29.1 | 5.52 |
| Yellow bluestem (YB) | 65.9 | -1.4 | 10.3 | 0.1 | 70.7 | 1.0 | 35.9 | 34.8 | 30.3 | 4.92 |
| Coastal panicgrass (PG) | 56.5 | -11.4 | 7.7 | -2.7 | 77.4 | 5.5 | 41.7 | 35.7 | 34.2 | 6.71 |
| Headed (HD): | ||||||||||
| BG | 42.9 | 6.9 | 6.9 | -0.8 | 79.3 | 1.0 | 40.3 | 39.0 | 31.1 | 8.41 |
| YB | 60.1 | -5.0 | 9.6 | -1.7 | 73.6 | 4.2 | 41.9 | 31.7 | 35.1 | 5.95 |
| Significance (P): | ||||||||||
| Grass | <0.01 | <0.01 | <0.01 | 0.01 | <0.01 | <0.01 | <0.01 | <0.01 | <0.01 | <0.01 |
| VT: | ||||||||||
| BG vs. (YB+PG) | <0.01 | <0.01 | <0.01 | 0.13 | 0.47 | 0.01 | <0.01 | <0.01 | <0.01 | 0.44 |
| YB vs. PG | <0.01 | <0.01 | <0.01 | <0.01 | <0.01 | <0.01 | <0.01 | 0.35 | <0.01 | <0.01 |
| Maturity: | ||||||||||
| BG: VT vs. HD | <0.01 | <0.01 | <0.01 | 0.59 | <0.01 | 0.76 | <0.01 | 0.99 | <0.01 | <0.01 |
| YB: VT vs. HD | <0.01 | 0.06 | 0.03 | 0.01 | <0.01 | 0.01 | <0.01 | 0.01 | <0.01 | 0.03 |
| MSD5 | 2.0 | 3.5 | 0.6 | 1.4 | 1.6 | 2.0 | 1.1 | 1.3 | 0.5 | 0.9 |
1 CP = crude protein; NDF = neutral detergent fiber; ADF = acid detergent fiber; HEMI = hemicellulose; CELL = cellulose. ↲
2 AF = as fed. ↲
3 DV = difference value (weighback concentration minus AF concentration). ↲
4 Each value is the mean of four steers. ↲
5 MSD = minimum significant difference from the Waller-Duncan k-ratio (k = 100) t-test and can be used to compare any two grasses. ↲
| Grass | DM (%) |
Nutritive value1 | Particle size2 | |||||
|---|---|---|---|---|---|---|---|---|
| IVDMD (%) |
CP (%) |
NDF (%) |
MPS (mm) | Large (%) |
Medium (%) |
Small (%) |
||
| Vegetative (VT): | ||||||||
| Bermudagrass (BG) | 17.33 | 61.1 | 8.9 | 72.7 | 1.3 | 34.9 | 55.2 | 9.9 |
| Yellow bluestem (YB) | 17.6 | 69.5 | 9.3 | 68.8 | 1.3 | 34.9 | 54.7 | 10.4 |
| Coastal panicgrass (PG) | 15.8 | 67.3 | 8.3 | 74.0 | 1.5 | 42.3 | 46.7 | 11.0 |
| Headed (HD): | ||||||||
| BG | 14.3 | 52.5 | 6.7 | 74.6 | 1.2 | 26.9 | 56.2 | 16.9 |
| YB | 15.3 | 65.9 | 8.5 | 72.5 | 1.4 | 39.0 | 49.5 | 11.5 |
| Significance (P): | ||||||||
| Grass | 0.01 | <0.01 | <0.01 | <0.01 | 0.41 | 0.41 | 0.33 | 0.16 |
| VT: | ||||||||
| BG vs. (YB+PG) | 0.66 | <0.01 | 0.80 | 0.03 | 0.60 | 0.60 | 0.33 | 0.72 |
| YB vs. PG | 0.05 | 0.05 | 0.01 | <0.01 | 0.31 | 0.37 | 0.15 | 0.82 |
| Maturity: | ||||||||
| BG: VT vs. HD | 0.01 | <0.01 | <0.01 | 0.01 | 0.35 | 0.33 | 0.85 | 0.03 |
| YB: VT vs. HD | 0.02 | <0.01 | 0.02 | <0.01 | 0.58 | 0.61 | 0.34 | 0.70 |
| MSD4 | 2.0 | 1.9 | 0.7 | 1.2 | 0.5 | 21.9 | 14.2 | 7.3 |
1 IVDMD = in vitro dry matter disappearance; CP = crude protein; NDF = neutral detergent fiber. ↲
2 MPS = median particle size; Large = ≥ 1.7 mm; Medium = <1.7 and ≥ 0.5 mm; Small = < 0.5 mm. ↲
3 Each value is the mean of four steers. ↲
4 MSD = minimum significant difference from the Waller-Duncan k-ratio (k = 100) t-test and can be used to compare any two grasses. ↲
| Grass | Chews | Bolus | ||||
|---|---|---|---|---|---|---|
| No. (per min) |
DM1 (per gram) |
IVDMD1 (per gram) |
NDF1 (per gram) |
minutes (per bolus) |
chews (per bolus) |
|
| Vegetative (VT): | ||||||
| Bermudagrass (BG) | 682 | 2.01 | 3.29 | 2.76 | 0.32 | 21.6 |
| Yellow bluestem (YB) | 68 | 2.11 | 3.04 | 3.07 | 0.37 | 25.6 |
| Coastal panicgrass (PG) | 71 | 3.31 | 4.89 | 4.49 | 0.35 | 24.3 |
| Headed (HD): | ||||||
| BG | 65 | 4.21 | 7.95 | 5.66 | 0.35 | 22.1 |
| YB | 69 | 3.22 | 4.88 | 4.45 | 0.39 | 26.7 |
| Significance (P): | ||||||
| Grass | <0.01 | 0.08 | 0.01 | 0.11 | 0.50 | 0.29 |
| VT: | ||||||
| BG vs. (YB+PG) | 0.08 | 0.32 | 0.51 | 0.30 | 0.29 | 0.17 |
| YB vs. PG | 0.03 | 0.15 | 0.13 | 0.22 | 0.53 | 0.63 |
| Maturity: | ||||||
| BG: VT vs. HD | 0.01 | 0.01 | <0.01 | 0.02 | 0.51 | 0.85 |
| YB: VT vs. HD | 0.69 | 0.18 | 0.14 | 0.23 | 0.66 | 0.67 |
| MSD3 | 2.2 | 1.9 | 2.6 | 2.8 | 0.1 | 7.2 |
1 DM = dry matter; IVDMD = in vitro dry matter disappearance; NDF = neutral detergent fiber. ↲
2 Each value is the mean of four steers. ↲
3 MSD = minimum significant difference from the Waller-Duncan k-ratio (k = 100) t-test and can be used to compare any two grasses. ↲
| Grass | CP (%) |
NDF (%) |
Fiber constituents | |||
|---|---|---|---|---|---|---|
| ADF (%) |
HEMI (%) |
CELL (%) |
Lignin (%) |
|||
| Vegetative (VT): | ||||||
| Bermudagrass (BG) | 10.02 | 73.0 | 38.0 | 35.0 | 24.5 | 10.4 |
| Yellow bluestem (YB) | 12.4 | 64.4 | 36.5 | 27.9 | 23.6 | 10.6 |
| Coastal panicgrass (PG) | 9.4 | 71.7 | 43.0 | 28.8 | 27.8 | 12.6 |
| Headed (HD): | ||||||
| BG | 7.9 | 81.4 | 44.2 | 37.1 | 29.0 | 13.2 |
| YB | 11.6 | 68.8 | 42.0 | 26.8 | 26.9 | 12.3 |
| Significance (P): | ||||||
| Grass | <0.01 | <0.01 | <0.01 | <0.01 | <0.01 | <0.01 |
| VT: | ||||||
| BG vs. (YB+PG) | 0.02 | <0.01 | <0.01 | <0.01 | 0.04 | <0.01 |
| YB vs. PG | <0.01 | <0.01 | <0.01 | 0.49 | <0.01 | <0.01 |
| Maturity: | ||||||
| BG: VT vs. HD | <0.01 | <0.01 | <0.01 | 0.10 | <0.01 | <0.01 |
| YB: VT vs. HD | 0.03 | 0.01 | <0.01 | 0.41 | <0.01 | <0.01 |
| MSD3 | 0.7 | 2.9 | 0.8 | 2.5 | 1.2 | 0.7 |
1 CP = crude protein; NDF = neutral detergent fiber; ADF = acid detergent fiber; HEMI = hemicellulose; CELL = cellulose. ↲
2 Each value is the mean of four steers. ↲
3 MSD = minimum significant difference from the Waller-Duncan k-ratio (k = 100) t-test and can be used to compare any two grasses. ↲
Experiment 2. Plant Morphology and Cultivar within Morphologies: Effects on Dry Matter Intake, Digestibility, Mastication, and Preference
Confusion often exists when using forages that differ in morphology, anatomy, and nutritive value as to the impact of these factors on animal intake, digestibility, and subsequent performance. Our objective in this experiment was to evaluate the impact of two representative cultivars from two forage species on subsequent animal responses. The responses were evaluated by estimating dry matter intake, digestibility, masticate characteristics, and animal preference among the forages.
Material and Methods
Well-established stands of Coastal and Tifton 44 bermudagrasses and Alamo and Kanlow switchgrasses provided the experimental hays. The fields were burned in mid-February to remove growth from the previous season, the spring growth was removed, and the fields were top-dressed with 80 pounds of nitrogen per acre for the subsequent growth of the experimental hays. The hays were cut with a mower conditioner, tedded daily, and allowed to field cure. Thereafter, the hays were baled with a conventional square baler, transported to the experimental-hay storage barn at the NC State University Forage-Animal Metabolism Unit in Raleigh, NC, and placed on wooden pallets until fed. The bermudagrasses were cut August 24 when fully headed, and the switchgrasses were cut July 13 in the late vegetative to early boot stages. The following four treatments were evaluated:
-
Coastal bermudagrass, cut when 100% headed, mean height of 23 inches
-
Tifton bermudagrass, cut when 100% headed, mean height of 23 inches
-
Alamo switchgrass, cut in the late vegetative to early boot stage, mean height of 75 inches
-
Kanlow switchgrass, cut in the late vegetative to early boot stage, mean height of 75 inches
Three experiments were conducted consisting of an intake and digestibility experiment (Experiment 2A), a mastication experiment (Experiment 2B), and a preference experiment (Experiment 2C). The hays were evaluated for dry matter intake and dry matter digestibility in Experiment 2A using steers in a 4 × 4 Latin square design. Four steers of uniform weight (mean = 594 ± 36 pounds) were assigned at random to the four treatments in period one. The hays were processed prior to feeding and the experiment was conducted using standard procedures (Appendices GP-1 and GP-2), and steers were fed at an average of 13.0% excess.
Experiment 2B was conducted with esophageally fistulated steers also in a 4 × 4 Latin square design. Four steers of similar weight (mean = 830 pounds) were randomly assigned to each of the four treatments to initiate period one. The experiment was conducted according to standard procedures (Appendix GP-3).
The same steers used in Experiment 2B, noted above, were also used in Experiment 2C, in which a series of preference evaluations were conducted. Each experiment was conducted in a randomized complete block design with four animal replicates according to standard procedures (Appendix GP-8). Six preference evaluations were conducted as listed below:
-
Comparison between Coastal and Tifton 44 bermudagrass
-
Comparison between Alamo and Kanlow switchgrass
-
Comparison among all four grasses
-
Comparison among varying proportions of Coastal and Tifton 44 bermudagrasses
-
Comparison among a narrow range of proportions of Coastal and Tifton 44 bermudagrasses
-
Comparison among varying proportions of Alamo and Kanlow
All as-fed, weighback, and masticate samples were analyzed for nutritive value and fecal samples for chemical composition according to standard procedures (Appendix GP-7). The data were analyzed statistically according to the experimental design (Appendix GP-8).
Results and Discussion
Experiment 2A
The four hays evaluated in this experiment represent a wide range in morphology. Bermudagrass is leafy with fine leaves, fine stems, and heading below 24 inches. On the other hand, switchgrass is robust with much larger (longer and wider) leaves and much thicker stems, with the boot stage occurring when the plant is about 75 inches tall.
Dry matter intake of the four hays differed with the bermudagrasses similar but greater than the two switchgrasses, which were consumed similarly (Table 2.1). Steers digested the dry matter, neutral detergent fiber, and hemicellulose of the hays similarly, averaging 50.3% for dry matter, 50.7% for neutral detergent fiber, and 55.9% for hemicellulose. The digestibilities of acid detergent fiber and cellulose differed, being greater for switchgrass compared with bermudagrass but similar between cultivars within species. Digestible intakes of all five variables reflect that dry matter intake was greater for the bermudagrasses, which were similar, compared with the switchgrasses (Table 2.1). Within the switchgrasses, Alamo had greater digestible dry matter and digestible hemicellulose than Kanlow.
The as-fed hays closely reflect the animal response data, with the bermudagrasses similar but differing in in vitro true dry matter disappearance, crude protein, neutral detergent fiber, and constituent fiber fractions compared with the two switchgrasses (Table 2.2). The noted exception was lignin. Within the two switchgrass cultivars, Kanlow had greater concentrations of neutral detergent fiber, acid detergent fiber, cellulose, and lignin compared with Alamo. These differences, however, were not of sufficient magnitude to alter either dry matter intake or dry matter digestibility between the two cultivars.
Some selective consumption occurred, as noted by difference values (weighback concentration minus as-fed concentration), being more prevalent for switchgrass compared to the bermudagrasses and was not different between cultivars within species (Table 2.2).
Fecal composition generally reflects numeric differences in digestibility between bermudagrasses and switchgrasses. This resulted in bermudagrass being greater than switchgrass in fecal crude protein, neutral detergent fiber, hemicellulose and lignin, but lesser in acid detergent fiber and cellulose (Table 2.3).
Experiment 2B
The whole masticate revealed differences in characteristics between bermudagrasses and switchgrasses, with only a few differences noted between cultivars within species (Table 2.4). Coastal masticate had a greater concentration of dry matter than Tifton 44, indicating differences in chewing or salivation (or both), whereas Alamo switchgrass had larger particle sizes in the masticate than Kanlow. When we examined the proportion of large, medium, and small particle-size classes and their nutritive value, we found differences between bermudagrasses and switchgrasses. Switchgrasses had a greater proportion of large particles with greater in vitro true dry matter disappearance and neutral detergent fiber concentrations. Switchgrasses had a lesser proportion of medium particles with lesser in vitro true dry matter disappearance of the particles, but with neutral detergent fiber similar, and similar proportions of small particles but with greater in vitro true dry matter disappearance. The two bermudagrasses were generally similar in proportion of particle-size classes and their nutritive value. The two switchgrass cultivars differed, however, with Alamo masticate having a greater proportion of large particles with greater in vitro true dry matter disappearance. Alamo also had a lesser proportion of medium particles but with greater in vitro true dry matter disappearance and similar proportions of small particles, but again with greater in vitro true dry matter disappearance. The neutral detergent fiber concentrations were similar between Alamo and Kanlow for all particle-size classes.
Experiment 2C
When given a choice, steers in this experiment preferred Coastal over Tifton 44 bermudagrass, Alamo over Kanlow switchgrass, and bermudagrass (Coastal plus Tifton) over switchgrass (Alamo plus Kanlow) (Table 2.5). Offering preferred and nonpreferred hays in decreasing and increasing mixtures showed that as the proportion of preferred hays decreased, steer preference for that mixture decreased. This was noted for both bermudagrass and switchgrass (Table 2.6). When the mixture ranges for bermudagrass were narrow, the resulting preference was variable and no preference was evident (Table 2.6, narrow range).
Summary and Conclusions
- Steers readily consumed all four hays, but dry matter intake was greater for the bermudagrasses compared with the switchgrasses.
-
Steers consumed both bermudagrasses similarly and both switchgrasses similarly.
-
Dry matter digestibilities of all four hays were similar—both within species and between species.
-
Digestible intakes of the two bermudagrasses were similar.
-
Digestible intakes of the two switchgrasses differed, with Alamo having numerically greater dry matter intake and dry matter digestibility compared with Kanlow, resulting in greater digestible dry matter intake.
-
Preference, as indicated by short-term dry matter intake, favored Coastal over Tifton 44 bermudagrass, Alamo over Kanlow switchgrass, and bermudagrass over switchgrass.
| Grass | DMI (lb/100 lb2) |
Digestibilities | Digestible Intakes | ||||||||
|---|---|---|---|---|---|---|---|---|---|---|---|
| DM (%) |
NDF (%) |
ADF (%) |
HEMI (%) |
CELL (%) |
DM (lb/100 lb2) |
NDF (lb/100 lb2) |
ADF (lb/100 lb2) |
HEMI (lb/100 lb2) |
CELL (lb/100 lb2) |
||
| Bermudagrass (BG): | |||||||||||
| Coastal (CB) | 2.163 | 50.1 | 48.6 | 41.5 | 55.5 | 48.6 | 1.08 | 0.81 | 0.35 | 0.46 | 0.31 |
| Tifton 44 (TB) | 2.13 | 48.4 | 47.5 | 42.3 | 52.6 | 50.2 | 1.03 | 0.79 | 0.35 | 0.43 | 0.32 |
| Switchgrass (SG): | |||||||||||
| Alamo (ASG) | 1.38 | 53.9 | 55.1 | 51.8 | 59.5 | 59.3 | 0.74 | 0.58 | 0.31 | 0.27 | 0.29 |
| Kanlow (KSG) | 1.19 | 48.7 | 51.4 | 48.1 | 55.8 | 55.2 | 0.58 | 0.49 | 0.27 | 0.22 | 0.25 |
| Significance (P): | |||||||||||
| Grass | <0.01 | 0.23 | 0.17 | 0.05 | 0.30 | 0.07 | <0.01 | <0.01 | 0.07 | <0.01 | 0.06 |
| BG vs. SG | <0.01 | 0.30 | 0.06 | 0.01 | 0.16 | 0.02 | <0.01 | <0.01 | 0.02 | <0.01 | 0.02 |
| CB vs. TB | 0.76 | 0.55 | 0.74 | 0.79 | 0.41 | 0.65 | 0.34 | 0.55 | 0.83 | 0.12 | 0.60 |
| ASG vs. KSG | 0.10 | 0.09 | 0.28 | 0.30 | 0.30 | 0.27 | 0.03 | 0.10 | 0.19 | 0.04 | 0.13 |
1 NDF = neutral detergent fiber; ADF = acid detergent fiber; HEMI = hemicellulose; CELL = cellulose. ↲
2 Body weight basis. ↲
3 Each value is the mean of four steers. ↲
| Grass | IVTD | CP | NDF | Fiber Fractions | ||||||
|---|---|---|---|---|---|---|---|---|---|---|
| AF (%) |
DV2 (%) |
AF (%) |
DV2 (%) |
AF (%) |
DV2 (%) |
ADF (%) |
HEMI (%) |
CELL (%) |
Lignin (%) |
|
| Bermudagrass (BG): | ||||||||||
| Coastal (CB) | 57.13 | -0.8 | 9.1 | -0.3 | 77.3 | -0.1 | 38.7 | 38.6 | 29.4 | 8.7 |
| Tifton 44 (TB) | 56.7 | -1.0 | 9.5 | 0.1 | 77.8 | 0.3 | 39.3 | 38.4 | 30.1 | 8.6 |
| Switchgrass (SG): | ||||||||||
| Alamo (ASG) | 61.5 | -5.1 | 5.3 | -1.4 | 77.9 | 4.2 | 44.7 | 33.1 | 36.0 | 7.9 |
| Kanlow (KSG) | 60.2 | -8.4 | 4.8 | -1.8 | 80.6 | 3.9 | 47.7 | 32.9 | 38.2 | 8.6 |
| Significance (P): | ||||||||||
| Grass | 0.03 | 0.03 | <0.01 | 0.07 | <0.01 | 0.01 | <0.01 | <0.01 | <0.01 | 0.08 |
| BG vs. SG | 0.01 | 0.01 | <0.01 | 0.01 | <0.01 | <0.01 | <0.01 | <0.01 | <0.01 | 0.07 |
| CB vs. TB | 0.77 | 0.94 | 0.16 | 0.55 | 0.33 | 0.64 | 0.22 | 0.67 | 0.07 | 0.66 |
| ASG vs. KSG | 0.35 | 0.17 | 0.07 | 0.55 | <0.01 | 0.77 | <0.01 | 0.63 | <0.01 | 0.05 |
1 CP = crude protein; NDF = neutral detergent fiber; ADF = acid detergent fiber; HEMI = hemicellulose; CELL = cellulose. ↲
2 DV = difference value (weighback concentration minus AF concentration). ↲
3 Each value is the mean of four samples. ↲
| Grass | CP (%) |
NDF (%) |
Fiber Fractions | |||
|---|---|---|---|---|---|---|
| ADF (%) |
HEMI (%) |
CELL (%) |
Lignin (%) |
|||
| Bermudagrass (BG): | ||||||
| Coastal (CB) | 7.42 | 79.9 | 44.8 | 35.1 | 30.1 | 13.5 |
| Tifton 44(TB) | 7.9 | 78.8 | 43.5 | 35.3 | 29.1 | 13.1 |
| Switchgrass (SG): | ||||||
| Alamo (ASG) | 7.3 | 74.9 | 45.5 | 29.4 | 31.2 | 12.5 |
| Kanlow (KSG) | 6.6 | 75.6 | 46.6 | 29.0 | 32.5 | 12.1 |
| Significance (P): | ||||||
| Grass | 0.04 | 0.02 | 0.02 | <0.01 | 0.03 | 0.11 |
| BG vs. SG | 0.03 | <0.01 | 0.01 | <0.01 | 0.01 | 0.03 |
| CB vs. TB | 0.23 | 0.42 | 0.13 | 0.81 | 0.30 | 0.43 |
| ASG vs. KSG | 0.05 | 0.61 | 0.16 | 0.52 | 0.18 | 0.42 |
1 CP = crude protein; NDF = neutral detergent fiber; ADF = acid detergent fiber; HEMI = hemicellulose; CELL = cellulose. ↲
2 Each value is the mean of four steers. ↲
| Grass | Whole Masticate | Particle-size Classes | ||||||||||||
|---|---|---|---|---|---|---|---|---|---|---|---|---|---|---|
| Large | Medium | Small | ||||||||||||
| DM (%) |
MPS (mm) |
IVTD (%) |
CP (%) |
NDF (%) |
Prop (%) |
IVTD (%) |
NDF (%) |
Prop (%) |
IVTD (%) |
NDF (%) |
Prop (%) |
IVTD (%) |
NDF (%) |
|
| Bermudagrass (BG): | ||||||||||||||
| Coastal (CB) | 19.23 | 1.3 | 61.6 | 8.5 | 67.8 | 32.7 | 59.1 | 67.4 | 57.6 | 62.9 | 67.6 | 9.7 | 68.2 | 62.4 |
| Tifton 44 (TB) | 16.5 | 1.3 | 61.5 | 9.1 | 70.7 | 32.8 | 60.1 | 69.7 | 55.3 | 62.5 | 69.6 | 11.9 | 65.4 | 65.6 |
| Switchgrass (SG): | ||||||||||||||
| Alamo (ASG) | 15.8 | 1.8 | 67.6 | 5.0 | 71.0 | 57.9 | 66.6 | 71.2 | 33.1 | 70.9 | 67.3 | 9.0 | 78.3 | 61.9 |
| Kanlow (KSG) | 15.0 | 1.6 | 63.8 | 5.0 | 73.3 | 49.0 | 60.8 | 74.1 | 41.1 | 66.9 | 70.8 | 9.9 | 74.4 | 64.3 |
| Significance (P): | ||||||||||||||
| Grass | <0.01 | <0.01 | 0.04 | <0.01 | 0.26 | <0.01 | 0.03 | 0.05 | <0.01 | <0.01 | 0.20 | 0.30 | <0.01 | 0.54 |
| BG vs. SG | <0.01 | <0.01 | 0.01 | <0.01 | 0.14 | <0.01 | 0.02 | 0.02 | <0.01 | <0.01 | 0.70 | 0.22 | <0.01 | 0.66 |
| CB vs. TB | <0.01 | 0.83 | 0.98 | 0.13 | 0.28 | 0.96 | 0.63 | 0.25 | 0.16 | 0.79 | 0.27 | 0.18 | 0.08 | 0.28 |
| ASG vs. KSG | 0.16 | 0.01 | 0.07 | 0.86 | 0.38 | 0.02 | 0.02 | 0.15 | <0.01 | 0.04 | 0.07 | 0.51 | 0.03 | 0.41 |
1 IVTD = in vitro true dry matter disappearance; CP = crude protein; NDF = neutral detergent fiber. ↲
2 Prop = proportion of DM; Large = > 1.7mm; Medium = ≤1.7mm and >0.5mm; Small < 0.5 mm. ↲
3 Each value is the mean of four steers. ↲
| Grass | Bermudagrass (BG) | Switchgrass (SG) | BG and SG | ||||||
|---|---|---|---|---|---|---|---|---|---|
| DMI1 (g) |
Time (min) |
Rate (g/min) |
DMI (g) |
Time (min) |
Rate (g/min) |
DMI (g) |
Time (min) |
Rate (g/min) |
|
| Bermudagrass (BG): | |||||||||
| Coastal (CB) | 10122 | 16.8 | 60.5 | 495 | 8.2 | 88.9 | |||
| Tifton 44 (TB) | 225 | 5.2 | 45.3 | 293 | 4.6 | 66.3 | |||
| Switchgrass (SG): | |||||||||
| Alamo (ASG) | 585 | 23.2 | 24.6 | 140 | 8.2 | 20.3 | |||
| Kanlow (KSG) | 120 | 3.0 | 38.7 | 45 | 1.1 | 22.1 | |||
| Significance (P): | |||||||||
| Grass | 0.04 | 0.25 | 0.14 | ||||||
| CB vs. TB | 0.03 | 0.08 | 0.13 | 0.17 | 0.37 | 0.49 | |||
| ASG vs. KSG | 0.02 | <0.01 | 0.13 | 0.51 | 0.09 | 0.96 | |||
| (CB+TB) vs. (ASG+KSG) | 0.01 | 0.52 | 0.03 | ||||||
1DMI = dry matter intake. ↲
2 Each value is the mean of four steers. ↲
| Cultivar Proportions | Bermudagrass (CB:TB)1 | Switchgrass (ASG:KSG)2 | ||||
|---|---|---|---|---|---|---|
| DMI3 (g) |
Time (min) |
Rate (g/min) |
DMI (g) |
Time (min) |
Rate (g/min) |
|
| Wide range: | ||||||
| 80:20 | 6794 | 11.6 | 56.3 | 2295 | 22.1 | 101.9 |
| 60:40 | 657 | 12.3 | 50.0 | 855 | 9.5 | 107.5 |
| 40:60 | 162 | 3.7 | 102.3 | 720 | 6.0 | 212.5 |
| 20:80 | 155 | 2.6 | 50.6 | 270 | 2.9 | 136.5 |
| Significance (P): | 0.06 | 0.05 | 0.64 | 0.01 | 0.03 | 0.34 |
| MSD5 | 545 | 8.8 | 130.9 | 1077 | 12.6 | 172.3 |
| Narrow range: | ||||||
| 65:35 | 565 | 7.1 | 96.9 | |||
| 55:45 | 267 | 6.0 | 59.8 | |||
| 45:55 | 453 | 11.6 | 39.0 | |||
| 35:65 | 270 | 5.2 | 77.8 | |||
| Significance (P): | 0.29 | 0.40 | 0.55 | |||
| MSD | 458 | 10.5 | 111.7 | |||
1 Bermudagrass cultivars are Coastal (CB) and Tifton 44 (TB), and mixture (80:20) represents 80% CB and 20% TB. ↲
2 Switchgrass cultivars are Alamo (ASG) and Kanlow (KSG), and mixture (80:20) represents 80% ASG and 20% KSG. ↲
3 DMI = dry matter intake. ↲
4 Each value is the mean of four steers. ↲
5 MSD = minimum significant difference from the Waller-Duncan k-ratio (k = 100) t-test and can be used to compare any two treatments. ↲
Experiment 3. Switchgrass and Caucasian Bluestem Hays Harvested in the P.M. and A.M.: Changes in Nutritive Value, Dry Matter Intake, Digestibility, and Preference
Ruminants selectively consume their diet when selectivity can be exercised based on feed allocation and presentation. In grazing experiments, ruminants will generally select a diet greater in green leaf and lesser in stem. This preferential consumption also occurs in confinement when possible. Further, ruminants select certain forages over others, and selectivity can be associated with plant factors such as soluble sugar status. Our objective in this study was to compare animal preferences between switchgrass and Caucasian bluestem and to determine if hays cut in the p.m., with potentially greater water-soluble carbohydrate concentrations, would be preferred over hay cut in the a.m., with lesser water-soluble carbohydrate concentrations.
Materials and Methods
Well-established fields of Alamo switchgrass and Caucasian bluestem provided the experimental hays. Both fields were burned in late February to remove all fall carryover growth. The switchgrass was top-dressed with 70 pounds of nitrogen per acre in mid-March, and Caucasian bluestem was top-dressed with 70 pounds of nitrogen per acre in early April. The initial growth of both species was removed as hay (switchgrass cut June 17 and Caucasian bluestem cut July 5), and fields were top-dressed again with 70 pounds of nitrogen per acre in preparation for the production of the experimental hays. Harvests were made in August, with one taken in the p.m. and a.m. for switchgrass and two harvests (H) taken in the p.m. and a.m. for Caucasian bluestem, resulting in the following six treatments:
Switchgrass:
- Vegetative regrowth, cut in the p.m. (after 5:30) on August 7
- Vegetative regrowth, cut in the a.m. (before 8:00) on August 8
Caucasian bluestem:
- Vegetative regrowth, cut in the p.m. (after 5:30) on August 7 (H-1)
- Vegetative regrowth, cut in the a.m. (before 8:00) on August 8 (H-1)
- Vegetative regrowth, cut in the p.m. (after 5:30) on August 9 (H-2)
- Vegetative regrowth, cut in the a.m. (before 8:00) on August 10 (H-2)
Each treatment was mowed with a conventional mower conditioner set to 4 inches for switchgrass and 3 inches for bluestem. The hays were field cured, being tedded daily and baled with a conventional square baler, and the bales were stored on wooden pallets in an experimental hay storage barn at the NC State University Forage-Animal Metabolism Unit in Raleigh, NC, until feeding. Prior to feeding, the hays were processed according to standard procedures (Appendix GP-1).
Four separate experiments were conducted. Two experiments estimated preference, one with sheep (Experiment 3A) and the other with goats (Experiment 3B), both evaluating all six hays. A third experiment (Experiment 3C) evaluated dry matter intake and digestibility of four of the six hays and was conducted with steers. The fourth was a mastication experiment (Experiment 3D) evaluating the same four hays, using esophageally fistulated steers fitted with esophageal cannulas.
The two preference experiments, using all six hays, were conducted concurrently using standard procedures (Appendix GP-4). In Experiment 3A, eight Katahdin ewe sheep were standardized on a common hay, and the six with most uniform intakes were selected (mean weight = 162.7 ± 3.9 pounds). In Experiment 3B, eight Boer/Spanish crossbred doe goats were standardized on a common hay, and the six with the most uniform intakes were selected (mean weight = 64.2 ± 1.0 pounds). The sheep and goat response data were analyzed using a form of multiple dimensional scaling (Appendix GP-4) and appropriate statistical analyses (Appendix GP-8).
The evaluation of intake and digestibility in Experiment 3C was conducted with steers in a randomized complete block design with four steers (replicates) per treatment. The 16 steers were blocked by weight into four groups of four (mean = 602 ± 38 pounds), and steers within each group were assigned at random to the four hay treatments. The intake and digestibility experiment was conducted according to standard procedure with steers fed at 12.5% excess (Appendix GP-2). During the digestibility phase, chewing behavior was monitored using specially designed halters with hard-wired linkage to a computer (Appendix GP-3).
The four hays evaluated for intake and digestibility were also evaluated for mastication characteristics in Experiment 3D. The experiment was conducted with six esophageally cannulated steers in a randomized complete block design. The steers were randomly assigned to a random sequence of the four experimental hays. The six steers (replicates) were fed two hays on day one and another two on day two to complete the experiment. The mastication phase was conducted according to standard procedures (Appendix GP-3).
All as-fed, weighback, and masticate samples, as appropriate, were analyzed for nutritive value constituents, including total nonstructural carbohydrates and its constituent fractions (Appendix GP-7). Chemical analyses were also conducted on fecal samples (Appendix GP-7). The data were analyzed statistically according to the experimental design (Appendix GP-8).
Results and Discussion
Preference Experiments
Experiment 3A
When provided a choice, sheep preferred switchgrass over bluestem with no preference for a.m. or p.m. cut hay as noted by dry matter intake (Figure 3.1) and intake rate (Table 3.1). Further, within the bluestem hays, sheep preferred Harvest 1 hay (H-1) over Harvest 2 hay (H-2), although the harvests were cut only one day apart. Examination of the total nonstructural carbohydrate concentrations indicates greater concentrations in switchgrass than in bluestem, but no difference between a.m. and p.m. harvests or between H-1 and H-2 within bluestem.
The lack of difference in total nonstructural carbohydrates between the a.m. and p.m. harvests explains, in part, the similarity in dry matter intake and the generally more favorable nutritive value (greater total nonstructural carbohydrates, in vitro true dry matter disappearance, and crude protein, and lesser neutral detergent fiber, cellulose, and lignin) explaining the animals’ greater preference for switchgrass compared with bluestem (Figure 3.1 and Table 3.1). In addition, selective consumption was evident as noted by the difference value (weighback concentration minus as-fed concentration), with greater selectivity indicated by the difference value for switchgrass (Table 3.1). Although some species by time-of-cut interactions were noted for some variables, the interactions resulted from either nonparallel trends or, if crossovers occurred, the shifts were considered of little biological importance. Assessment of chewing behavior revealed little difference among treatments with steers averaging 50,942 chews during 24 hours (data not shown). Only the number of chews per pound of neutral detergent fiber intake differed, with switchgrass and bluestem similar at 7,072, but p.m. chews averaged greater (P = 0.04) at 7,660 compared with 6,483 chews in the a.m.
Experiment 3B
When provided a choice, goats also preferred switchgrass over bluestem, with no preference for a.m. or p.m. cut hay as noted by dry matter intake (Figure 3.1) and intake rate (Table 3.2). Within the bluestem hays, however, goats consumed more a.m. hay than p.m. hay, and also preferred H-1 hays over H-2 hays. Although total nonstructural carbohydrate concentrations were greater in the p.m. harvested hays, the differences were apparently not of sufficient concentration to alter dry matter intake rate. The species by time-of-cut interaction was significant for dry matter intake rate and is attributed to the very low dry matter intake rate noted for the H-2 p.m. hay (Table 3.2). Although not significant, this decline was also noted with sheep (Table 3.1) and indicates a general lack of preference for this hay.
Some general relationships between dry matter intake rate and hay composition were evident and were similar for both sheep and goats. Respective correlations (r) noted between (1) dry matter intake rate and in vitro true dry matter disappearance were r = 0.99 (P < 0.01) and r = 0.87 (P = 0.02), (2) dry matter intake rate and difference value for in vitro true dry matter disappearance were r = -0.98 (P < 0.01) and r = -0.95 (P < 0.01), (3) dry matter intake rate and neutral detergent fiber were r = -0.99 (P < 0.01) and r = -0.81 (P = 0.05), and (4) dry matter intake rate and acid detergent fiber were r = -0.98 (P < 0.01) and r = -0.74 (P = 0.09). The association between dry matter intake rate and total nonstructural carbohydrates was much weaker, with r = 0.64 (P = 0.17) for sheep and r = 0.31 (P = 0.55) for goats.
Both sheep and goats were fed random bales from within the same bulk stack of each treatment. Although average nutritive value composition is expected to be similar among the bales, it is presented for each experiment for completeness.
Intake, Digestibility and Mastication
Experiment 3C
In our conventional assessment of dry matter intake, steers consumed more bluestem compared with switchgrass (H-1), but digestibilities of dry matter and neutral detergent fiber and constituent fiber fractions were similar (Table 3.3). Because of greater dry matter intake of bluestem, the digestible intakes of all its fractions were also greater. Dry matter intake of a.m. cut hay was greater compared with the p.m. cut, but time of cut did not alter estimates of digestibility of their digestible intakes.
Composition of the as-fed hay reveals that switchgrass was greater in total nonstructural carbohydrates and general nutritive value than bluestem (Table 3.4), and difference values indicate that selective consumption occurred, being greater for switchgrass than for bluestem. This behavior may account, in part, for the lesser dry matter intake of switchgrass compared with bluestem (Table 3.5).
Experiment 3D
Examination of masticate characteristics indicates that steers selected a diet with nutritive value that favored switchgrass, being greater in total nonstructural carbohydrates and in vitro true dry matter disappearance and lesser in neutral detergent fiber than bluestem, with little difference noted in time of cut (Table 3.5).
Summary and Conclusions
- In concurrent preference experiments, both sheep and goats preferred switchgrass over Caucasian bluestem.
-
Harvesting in the p.m. compared with a.m. did not greatly alter total nonstructural carbohydrate concentrations of either grasses, and consequently preference was also not altered by harvest time.
-
In an intake trial with steers, Caucasian bluestem was consumed in greater quantities than switchgrass and dry matter digestibilities were similar.
-
Selective consumption occurred, but masticate of switchgrass was generally of greater nutritive value than masticate of Caucasian bluestem.
-
Both switchgrass and Caucasian bluestem hays can serve as desirable feed in ruminant production systems if harvested at the appropriate growth stage.
| Treatment | Time | DMI (g/min) |
Carbohydrates | IVDMD | CP | NDF | Fiber Fractions | |||||||||
|---|---|---|---|---|---|---|---|---|---|---|---|---|---|---|---|---|
| Species | TNC (%) |
Starch (%) |
DI/Poly (%) |
Mono (%) |
AF2 (%) |
DV3 (%) |
AF (%) |
DV (%) |
AF (%) |
DV (%) |
ADF (%) |
HEMI (%) |
CELL (%) |
Lignin (%) |
||
| Switchgrass (SG): | ||||||||||||||||
| a.m. | 4.624 | 8.97 | 1.57 | 3.63 | 3.77 | 65.9 | -5.1 | 8.6 | -2.4 | 70.1 | 3.3 | 38.2 | 31.9 | 33.7 | 4.27 | |
| p.m. | 4.74 | 9.19 | 1.53 | 3.38 | 4.28 | 65.8 | -5.5 | 8.3 | -2.1 | 69.6 | 4.0 | 67.4 | 32.2 | 33.1 | 4.22 | |
| Bluestem (BS): | ||||||||||||||||
| Harvest (H1) | a.m. | 1.50 | 8.54 | 1.72 | 2.13 | 4.69 | 62.8 | -2.1 | 8.7 | -0.7 | 73.7 | 1.6 | 42.5 | 31.2 | 36.8 | 5.29 |
| p.m. | 2.07 | 8.15 | 1.76 | 1.72 | 4.67 | 63.5 | -2.3 | 8.4 | -0.7 | 73.2 | 1.5 | 42.1 | 31.2 | 36.6 | 5.15 | |
| Harvest (H2) | a.m. | 1.77 | 8.21 | 1.76 | 2.22 | 4.23 | 63.2 | -2.8 | 7.9 | -1.1 | 73.5 | 2.0 | 42.1 | 31.4 | 36.6 | 5.20 |
| p.m. | 0.55 | 8.77 | 1.76 | 2.29 | 4.72 | 61.4 | -0.7 | 8.2 | -0.3 | 74.7 | 0.5 | 42.9 | 31.8 | 37.4 | 5.57 | |
| Significance (P): | ||||||||||||||||
| Treatment | <0.01 | <0.01 | <0.01 | <0.01 | <0.01 | <0.01 | <0.01 | <0.01 | <0.01 | <0.01 | <0.01 | <0.01 | <0.01 | <0.01 | <0.01 | |
| SG vs. BS | <0.01 | <0.01 | <0.01 | <0.01 | <0.01 | <0.01 | <0.01 | 0.16 | <0.01 | <0.01 | <0.01 | <0.01 | <0.01 | <0.01 | <0.01 | |
| a.m. vs. p.m. | 0.24 | 0.21 | 0.96 | <0.01 | <0.01 | 0.08 | 0.10 | 0.40 | 0.03 | 0.72 | 0.20 | 0.39 | 0.03 | 0.86 | 0.15 | |
| BS: a.m. vs. p.m. | 0.09 | 0.51 | 0.43 | 0.03 | 0.05 | 0.06 | 0.01 | 0.02 | 0.05 | 0.04 | 0.01 | 0.49 | 0.11 | 0.15 | 0.03 | |
| BS: H1 vs. H2 | <0.01 | 0.22 | 0.36 | <0.01 | 0.08 | <0.01 | 0.28 | <0.01 | 0.93 | <0.01 | 0.35 | 0.43 | <0.01 | 0.08 | 0.01 | |
| Species x Time | 0.17 | 0.53 | 0.20 | 0.54 | 0.18 | 0.41 | 0.04 | <0.01 | 0.62 | <0.01 | 0.01 | 0.02 | 0.71 | 0.01 | 0.08 | |
| MSD5 | 0.48 | 0.32 | 0.07 | 0.19 | 0.31 | 0.7 | 0.6 | 0.3 | 0.6 | 0.4 | 1.0 | 0.6 | 0.3 | 0.5 | 0.14 | |
1 IVDMD = in vitro dry matter disappearance; CP = crude protein; NDF = neutral detergent fiber; TNC = total nonstructural carbohydrates; DI/Poly = disaccharides and polysaccharides; Mono = monosaccharide; ADF = acid detergent fiber; HEMI = hemicellulose; CELL = cellulose. ↲
2 AF = as fed. ↲
3 DV = difference value (weighback concentration minus AF concentration). ↲
4 Each value is the mean of six sheep. ↲
5 MSD = minimum significant difference from the Waller-Duncan k-ratio (k = 100) t-test and can be used to compare any two treatments. ↲
| Treatment | DMI (g/min) |
Carbohydrates | IVTD | CP | NDF | Fiber Fractions | ||||||||||
|---|---|---|---|---|---|---|---|---|---|---|---|---|---|---|---|---|
| Species | Time | TNC (%) |
Starch (%) |
DI/Poly (%) |
Mono (%) |
AF2 (%) |
DV3 (%) |
AF (%) |
DV (%) |
AF (%) |
DV (%) |
ADF (%) |
HEMI (%) |
CELL (%) |
Lignin (%) |
|
| Switchgrass (SG): | ||||||||||||||||
| a.m. | 2.014 | 8.99 | 1.59 | 3.81 | 3.59 | 65.9 | -4.2 | 8.4 | -1.9 | 70.1 | 2.8 | 38.5 | 31.6 | 33.6 | 4.3 | |
| p.m. | 2.35 | 9.15 | 1.58 | 3.58 | 3.99 | 65.1 | -4.1 | 8.2 | -2.1 | 70.5 | 2.4 | 38.8 | 31.7 | 33.9 | 4.5 | |
| Bluestem (BS): | ||||||||||||||||
| Harvest (H1) | a.m. | 1.44 | 8.52 | 1.76 | 2.14 | 4.62 | 62.7 | -2.3 | 8.5 | -1.0 | 73.9 | 1.7 | 43.1 | 30.8 | 36.9 | 5.3 |
| p.m. | 1.59 | 8.61 | 1.79 | 2.03 | 4.79 | 63.1 | -3.0 | 8.6 | -1.1 | 73.4 | 2.2 | 42.1 | 31.3 | 36.3 | 5.2 | |
| Harvest (H2) | a.m. | 1.21 | 8.35 | 1.83 | 2.29 | 4.23 | 62.3 | -2.5 | 7.6 | -0.9 | 74.1 | 1.8 | 43.0 | 31.1 | 37.2 | 5.4 |
| p.m. | 0.45 | 8.99 | 1.77 | 2.69 | 4.53 | 61.8 | -1.5 | 8.1 | -0.7 | 73.9 | 1.1 | 42.2 | 31.7 | 36.7 | 5.4 | |
| Significance (P): | ||||||||||||||||
| Treatment | <0.01 | <0.01 | <0.01 | <0.01 | <0.01 | <0.01 | 0.01 | <0.01 | <0.01 | <0.01 | 0.42 | <0.01 | <0.01 | <0.01 | <0.01 | |
| SG vs. BS | <0.01 | <0.01 | <0.01 | <0.01 | <0.01 | <0.01 | <0.01 | 0.38 | <0.01 | <0.01 | 0.10 | <0.01 | <0.01 | <0.01 | <0.01 | |
| a.m. vs. p.m. | 0.46 | <0.01 | 0.60 | 0.82 | 0.01 | 0.49 | 0.74 | 0.08 | 0.63 | 0.81 | 0.59 | 0.33 | 0.01 | 0.54 | 0.80 | |
| BS: a.m. vs. p.m. | 0.05 | <0.01 | 0.61 | 0.32 | 0.06 | 0.94 | 0.76 | 0.01 | 0.93 | 0.51 | 0.78 | 0.16 | <0.01 | 0.29 | 0.72 | |
| BS: H1 vs. H2 | <0.01 | 0.24 | 0.52 | 0.01 | 0.01 | 0.10 | 0.24 | <0.01 | 0.28 | 0.45 | 0.39 | 0.92 | 0.05 | 0.49 | 0.41 | |
| Species x Time | 0.02 | 0.22 | 0.89 | 0.16 | 0.42 | 0.39 | 0.95 | 0.03 | 0.41 | 0.43 | 0.79 | 0.28 | 0.12 | 0.32 | 0.34 | |
| MSD5 | 0.41 | 0.25 | 0.10 | 0.39 | 0.32 | 1.3 | 1.8 | 0.3 | 0.6 | 1.4 | 2.4 | 1.7 | 0.5 | 1.3 | 0.4 | |
1 IVTD = in vitro true dry matter disappearance; CP = crude protein; NDF = neutral detergent fiber; TNC = total non-structural carbohydrates; DI/Poly = disaccharides and polysaccharides; Mono = monosaccharide; ADF = acid detergent fiber; HEMI = hemicellulose; CELL = cellulose. ↲
2 AF = as-fed. ↲
3 DV = difference value (weighback concentration minus AF concentration). ↲
4 Each value is the mean of six goats. ↲
5 MSD = minimum significant difference from the Waller-Duncan k-ratio (k = 100) t-test and can be used to compare any two treatments. ↲
| Treatment | DMI (lb/100 lb2) |
Digestibilities1 | Digestible Intakes | |||||||||
|---|---|---|---|---|---|---|---|---|---|---|---|---|
| Species | Time | DM (%) |
NDF (%) |
ADF (%) |
HEMI (%) |
CELL (%) |
DM (lb/100 lb2) |
NDF (lb/100 lb2) |
ADF (lb/100 lb2) |
HEMI (lb/100 lb2) |
CELL (lb/100 lb2) |
|
| Switchgrass (SG): | a.m. | 1.963 | 58.5 | 58.3 | 57.1 | 59.5 | 63.5 | 1.15 | 0.79 | 0.41 | 0.38 | 0.41 |
| p.m. | 1.93 | 57.3 | 55.7 | 55.3 | 56.2 | 61.5 | 1.10 | 0.74 | 0.40 | 0.35 | 0.39 | |
| Bluestem (BS): | a.m. | 2.32 | 57.3 | 57.7 | 56.3 | 59.4 | 65.0 | 1.33 | 0.96 | 0.53 | 0.43 | 0.53 |
| p.m. | 1.99 | 60.2 | 61.5 | 60.5 | 62.7 | 68.2 | 1.20 | 0.89 | 0.51 | 0.38 | 0.50 | |
| Significance (P): | ||||||||||||
| Treatment | 0.03 | 0.31 | 0.19 | 0.23 | 0.21 | 0.09 | 0.06 | 0.02 | 0.01 | 0.07 | <0.01 | |
| SG vs. BS | 0.03 | 0.47 | 0.16 | 0.23 | 0.14 | 0.03 | 0.02 | <0.01 | <0.01 | 0.05 | <0.01 | |
| a.m. vs. p.m. | 0.05 | 0.50 | 0.71 | 0.51 | 0.99 | 0.75 | 0.12 | 0.19 | 0.43 | 0.07 | 0.28 | |
| Species x Time | 0.10 | 0.11 | 0.10 | 0.11 | 0.13 | 0.15 | 0.45 | 0.85 | 0.98 | 0.72 | 0.75 | |
| MSD4 | 0.3 | 4.5 | 6.3 | 6.4 | 7.4 | 5.8 | 0.18 | 0.14 | 0.08 | 0.07 | 0.07 | |
1 NDF = neutral detergent fiber; ADF = acid detergent fiber; HEMI = hemicellulose; CELL = cellulose. ↲
2 Body weight basis. ↲
3 Each value is the mean of four steers. ↲
4 MSD = minimum significant difference from the Waller-Duncan k-ratio (k = 100) t-test and can be used to compare any two treatments. ↲
| Treatment | Carbohydrates | IVTD | CP | NDF | Fiber Fractions | ||||||||||
|---|---|---|---|---|---|---|---|---|---|---|---|---|---|---|---|
| Species | Time | TNC (%) |
Starch (%) |
DI/Poly (%) |
Mono (%) |
AF (%) |
DV2 (%) |
AF (%) |
DV (%) |
AF (%) |
DV (%) |
ADF (%) |
HEMI (%) |
CELL (%) |
Lignin (%) |
| Switchgrass (SG): | a.m. | 9.533 | 1.83 | 3.63 | 4.07 | 66.3 | -8.4 | 9.6 | -3.8 | 70.1 | 4.9 | 37.9 | 32.2 | 33.6 | 3.89 |
| p.m. | 9.47 | 1.81 | 4.37 | 3.29 | 67.2 | -7.9 | 9.0 | -3.7 | 70.1 | 5.3 | 38.2 | 31.9 | 34.0 | 3.87 | |
| Bluestem (BS): | a.m. | 9.30 | 2.22 | 2.21 | 4.87 | 62.3 | 0.2 | 8.7 | -0.5 | 71.8 | 2.3 | 40.7 | 31.1 | 35.6 | 4.79 |
| p.m. | 8.49 | 2.14 | 2.12 | 4.23 | 63.8 | -4.5 | 8.0 | -0.3 | 72.8 | 2.2 | 42.2 | 30.6 | 37.0 | 4.75 | |
| Significance (P): | |||||||||||||||
| Treatment | 0.02 | <0.01 | <0.01 | <0.01 | 0.01 | 0.02 | <0.01 | <0.01 | <0.01 | <0.01 | <0.01 | <0.01 | <0.01 | <0.01 | |
| SG vs. BS | 0.01 | <0.01 | <0.01 | <0.01 | <0.01 | 0.01 | <0.01 | <0.01 | <0.01 | <0.01 | <0.01 | <0.01 | <0.01 | <0.01 | |
| a.m. vs. p.m. | 0.06 | 0.34 | 0.10 | <0.01 | 0.15 | 0.25 | <0.01 | 0.65 | 0.17 | 0.72 | 0.01 | 0.04 | 0.01 | 0.70 | |
| Species x Time | 0.10 | 0.59 | 0.04 | 0.41 | 0.67 | 0.16 | 0.81 | 0.77 | 0.24 | 0.60 | 0.05 | 0.56 | 0.05 | 0.91 | |
| MSD4 | 0.67 | 0.15 | 0.52 | 0.24 | 2.5 | 5.7 | 0.47 | 0.6 | 1.1 | 1.7 | 0.7 | 0.5 | 0.7 | 0.21 | |
1 IVTD = in vitro true dry matter disappearance; CP = crude protein; NDF = neutral detergent fiber; TNC = total non-structural carbohydrates; DI/Poly= disaccharides and polysaccharides; Mono = monosaccharide; ADF = acid detergent fiber; HEMI = hemicellulose; CELL = cellulose. ↲
2 DV = difference value (weighback concentration minus AF concentration). ↲
3 Each value is the mean of four samples. ↲
4 MSD = minimum significant difference from the Waller-Duncan k-ratio (k = 100) t-test and can be used to compare any two treatments. ↲
| Treatment | DM (%) |
Carbohydrates1 | Nutritive value2 | ||||||
|---|---|---|---|---|---|---|---|---|---|
| Species | Time | TNC (%) |
Starch (%) |
DI/Poly (%) |
Mono (%) |
IVDMD (%) |
CP (%) |
NDF (%) |
|
| Switchgrass (SG): | a.m. | 17.63 | 9.53 | 1.94 | 3.42 | 4.17 | 74.2 | 9.7 | 65.7 |
| p.m. | 18.0 | 9.74 | 2.10 | 4.29 | 3.35 | 74.7 | 8.7 | 64.1 | |
| Bluestem (BS): | a.m. | 15.0 | 8.50 | 2.22 | 3.04 | 3.24 | 73.0 | 9.1 | 67.9 |
| p.m. | 14.5 | 7.37 | 2.05 | 2.41 | 2.91 | 72.8 | 8.8 | 66.7 | |
| Significance (P): | |||||||||
| Treatment: | 0.01 | <0.01 | 0.01 | <0.01 | <0.01 | <0.01 | <0.01 | <0.01 | |
| SG vs. BS | <0.01 | <0.01 | 0.03 | <0.01 | <0.01 | <0.01 | 0.12 | <0.01 | |
| a.m. vs. p.m. | 0.94 | 0.01 | 0.89 | 0.42 | <0.01 | 0.63 | <0.01 | 0.40 | |
| Species x Time | 0.52 | <0.01 | <0.01 | <0.01 | <0.01 | 0.21 | 0.03 | <0.01 | |
| MSD4 | 2.5 | 0.40 | 0.14 | 0.38 | 0.20 | 0.7 | 0.5 | 0.7 | |
1 TNC = total non-structural carbohydrates; DI/Poly = disaccharides and polysaccharides; Mono = monosaccharide. ↲
2 IVDMD = in vitro dry matter disappearance; CP = crude protein; NDF = neutral detergent fiber. ↲
3 Each value is the mean of six steers. ↲
4 MSD = minimum significant difference from the Waller-Duncan k-ratio (k = 100) t-test and can be used to compare any two treatments. ↲
Experiment 4. Warm-Season and Cool-Season Grasses with Similar Concentrations of Neutral Detergent Fiber: Dry Matter Intake, Digestibility, and Digesta Kinetics
In animal production systems, the neutral detergent fiber of the forage component in a ration is referenced frequently without regard to the neutral detergent fiber source. This assumes that neutral detergent fiber components in forages have similar characteristics regardless of the forage species. In this experiment, we compared the nutritive value and quality, as well as digesta kinetics, of three perennial grasses differing in morphology and physiology but with similar neutral detergent fiber concentrations.
Materials and Methods
Well-established stands of Coastal bermudagrass, Kanlow switchgrass, and Forager tall fescue provided the experimental hays as noted below:
-
Coastal bermudagrass, cut in late May, vegetative
-
Kanlow switchgrass regrowth, cut in early September, vegetative
-
Forager tall fescue, cut in mid-June, headed
The two perennial warm-season grasses—bermudagrass and switchgrass—represent extremes in morphology, with bermudagrass having fine stems with fine, short leaves and switchgrass having coarse, heavy stems with broad, long leaves. Tall fescue is a cool-season perennial grass differing in anatomical characteristics compared with bermudagrass and switchgrass. Cool-season grasses have inherently lesser neutral detergent fiber concentrations compared with warm-season grasses. In an attempt to equalize neutral detergent fiber concentrations, bermudagrass was cut in the late spring when vegetative and before neutral detergent fiber concentrations were elevated, a regrowth of switchgrass was cut while vegetative, and tall fescue was cut at a mature growth stage when neutral detergent fiber concentrations are generally greatest. This harvest strategy resulted in some confounding in maturity between tall fescue and the two warm-season grasses, but harvesting at different stages provided a way to equalize the neutral detergent fiber concentrations.
Switchgrass was flail-chopped (3- to 6-inch length) when harvested, forced-air dried in a bulk drying barn (145°F), and baled using a conventional square baler. Bermudagrass and tall fescue were field cured and square baled, and all hays were stored on wooden pallets in the experimental hay barn located at the NC State University Forage-Animal Metabolism Unit in Raleigh, NC. Hays were processed according to standard procedures (Appendix GP-1).
Two experiments were conducted consisting of estimates of dry matter intake and digestibility. In Experiment 4A, three Angus steers of similar weight (566 ± 19 pounds) were used and assigned at random to a treatment in period one of a 3 × 3 Latin square design. Intake and digestibility estimates were obtained according to standard procedures (Appendix GP-2). During the digestibility phase, external markers were administered orally to obtain estimates of digesta kinetics and fecal output. Cobalt was used to obtain estimates of the rate of passage and mean retention time of the liquid phase. Chromium, attached to the fiber, was used to obtain estimates of the rate of passage and mean retention time of the solid phase, as well as total fill and fecal output (Appendix GP-6). Steers were also fitted with halters during the five-day digestion period to monitor chewing behavior (Appendix GP-3). Fecal samples were retained and sieved for median particle size and for particle-size class determinations (Appendix GP-5).
Experiment 4B was conducted using three mature esophageally cannulated steers in two sequential 3 × 3 Latin square designs. The masticate was collected two times in the a.m. and two times in the p.m., representing four samples for each treatment within each period of each Latin square. Ten boluses were collected at each sampling. The number of chews per bolus was recorded and each bolus weighed. The boluses were combined, freeze-dried, and separated into two samples: one for whole masticate nutritive value determination and the other for particle size determination, including the proportion of large, medium, and small particles (Appendix GP-3).
All as-fed hay and weighback samples were analyzed for nutritive value and fecal samples for chemical composition according to standard procedures (Appendix GP-7). Masticate particle sizes were also analyzed for in vitro dry matter disappearance and neutral detergent fiber and used to calculate whole masticate concentrations. Data were analyzed statistically according to the experimental design (Appendix GP-8).
Results and Discussion
Experiment 4A
The three grasses evaluated were similar in neutral detergent fiber concentrations, averaging 68.3%, and were fed similarly at 12.3% excess or at 112% ad libitum (Table 4.1).
Steers consumed the hays differently, however, with tall fescue consumed least and bermudagrass and switchgrass consumed similarly. Digestibilities of dry matter, neutral detergent fiber, acid detergent fiber, and cellulose were similar among the hays, whereas hemicellulose was more digestible for tall fescue compared with the warm-season grasses. The difference in dry matter intake is reflected in digestible intakes, with tall fescue least in digestible intakes of dry matter and neutral detergent fiber and constituent fiber fractions, compared with the warm-season grasses. Further, bermudagrass had greater digestible dry matter and hemicellulose intakes than switchgrass.
The as-fed hays reveal that tall fescue nutritional value was similar to the means of the warm-season grasses in in vitro dry matter disappearance and neutral detergent fiber concentration but greater in crude protein, acid detergent fiber, cellulose, and lignin (Table 4.2). This similarity is associated with the tall fescue’s advanced stage of maturity at harvest. We harvested the fescue at this stage to increase its neutral detergent fiber concentration to be comparable to the warm-season grasses. Switchgrass had greater concentrations of in vitro dry matter disappearance, acid detergent fiber, and cellulose compared with bermudagrass. Some selective consumption was evident, as noted by difference values (weighback concentration minus as-fed concentration), with neutral detergent fiber concentrations being greater in the weighback for bermudagrass and switchgrass compared with tall fescue, indicating greater selectivity when steers were fed the warm-season grasses.
Experiment 4B
The whole masticate of tall fescue had greater saliva incorporated than the warm-season grasses, indicated by lesser dry matter concentration, and was lesser in median particle size and greater in in vitro dry matter disappearance but similar in neutral detergent fiber (Table 4.3). The switchgrass masticate had lesser dry matter than bermudagrass and was greater in nutritive value. The proportion of large particles in the masticate was similar between tall fescue and the mean of the warm-season grasses, but tall fescue had lesser percentage of medium particles and a similar proportion of small particles. The nutritive value of the particle-size classes generally favored tall fescue compared with the mean of the warm-season grasses. Also, switchgrass was of greater nutritive value compared with bermudagrass, which was least. Often tall fescue and switchgrass were similar in nutritive value as noted by the minimum significant difference.
Chewing behavior was examined, and steers chewed at a similar rate (71 chews per minute) for all three hays (Table 4.4). Examining chews per gram each of dry matter, in vitro dry matter disappearance, and neutral detergent fiber, we noted that tall fescue was greater for all three compared with the warm-season grasses and switchgrass was greater than bermudagrass. The minutes devoted to a bolus were greatest for tall fescue versus the warm-season grasses, and chews per bolus were similar. In general switchgrass required more time and more chews per bolus than bermudagrass.
Digesta kinetics reveals little difference in how the three forages were processed by the animal (Table 4.5). The noted exception was the mean retention time of the liquid phase, in which tall fescue was retained longer compared with the warm-season grasses and switchgrass was retained longer than bermudagrass. The minimum significant difference reveals no difference between tall fescue and switchgrass. Both the actual and predicted (based on marker) fecal output gave similar responses to the hay, indicating little difference among the species. Although the difference between bermudagrass and switchgrass in predicting fecal output approached significance (P = 0.06), the relationship between the actual and predicted fecal output was not well related, with an r = 0.24 (P = 0.44) (See Table 4.5).
Summary and Conclusions
- Tall fescue, bermudagrass, and switchgrass were harvested for hay at similar neutral detergent fiber concentrations, which required more mature tall fescue and less mature bermudagrass and switchgrass.
- Although neutral detergent fiber concentrations were similar, steers consumed less tall fescue than warm-season grasses but had similar dry matter digestibility.
- The digestibilities of neutral detergent fiber, acid detergent fiber, and cellulose were similar among hays.
- Digestible intakes reflect dry matter intake, with switchgrass having greatest dry matter intake and consequently greatest digestible intake of all fractions and with tall fescue least.
- Differences were noted among hays in the masticate characteristics of dry matter, median particle size, nutritive value, and in proportion of particle-size classes.
- Differences among hays also occurred in chewing behavior per unit of dry matter, in vitro dry matter disappearance, and neutral detergent fiber.
- The results from this study support the concept that these three hays, of similar neutral detergent fiber concentration, may give differing animal responses when fed as a proportion of the ration or as the sole ration.
| Grass | NDF (%) |
Intake | Digestibilities1 | Digestible Intakes | |||||||||
|---|---|---|---|---|---|---|---|---|---|---|---|---|---|
| ad Lib2 (%) |
DM (lb/100 lb3) |
DM (%) |
NDF (%) |
ADF (%) |
HEMI (%) |
CELL (%) |
DM (lb/100 lb3) |
NDF (lb/100 lb3) |
ADF (lb/100 lb3) |
HEMI (lb/100 lb3) |
CELL (lb/100 lb3) |
||
| Tall fescue (TF) | 69.44 | 112 | 1.83 | 66.9 | 73.7 | 66.8 | 80.3 | 76.0 | 1.23 | 0.94 | 0.42 | 0.52 | 0.40 |
| Bermudagrass (BG) | 67.9 | 113 | 2.39 | 70.0 | 70.2 | 69.6 | 73.4 | 76.6 | 1.67 | 1.16 | 0.48 | 0.68 | 0.46 |
| Switchgrass (SG) | 68.0 | 112 | 2.25 | 66.1 | 71.8 | 65.1 | 75.0 | 74.0 | 1.48 | 1.06 | 0.48 | 0.58 | 0.47 |
| Significance (P): | |||||||||||||
| Grass | 0.48 | 0.49 | 0.05 | 0.19 | 0.38 | 0.36 | 0.10 | 0.38 | 0.02 | 0.03 | 0.10 | 0.04 | 0.10 |
| TF vs. (BG+SG) | 0.28 | 0.89 | 0.03 | 0.43 | 0.25 | 0.81 | 0.05 | 0.64 | 0.01 | 0.02 | 0.05 | 0.03 | 0.05 |
| BG vs. SG | 0.96 | 0.29 | 0.27 | 0.11 | 0.50 | 0.20 | 0.45 | 0.23 | 0.05 | 0.07 | 0.98 | 0.05 | 0.48 |
| MSD5 | 3.6 | 3 | 0.40 | 5.0 | 6.4 | 7.9 | 6.5 | 5.1 | 0.20 | 0.12 | 0.06 | 0.09 | 0.07 |
1 ADF = acid detergent fiber; HEMI = hemicellulose; CELL = cellulose. ↲
2 ad Lib = ad libitum intake representing percentage of weighback fed in excess. ↲
3 Body weight basis. ↲
4 Each value is the mean of three steers. ↲
5 MSD = minimum significant difference from the Waller-Duncan k-ratio (k = 100) t-test and can be used to compare any two grasses. ↲
| Grass | IVDMD | NDF | CP | Fiber Fractions | ||||||
|---|---|---|---|---|---|---|---|---|---|---|
| AF (%) |
DV2 (%) |
AF (%) |
DV (%) |
AF (%) |
DV (%) |
ADF (%) |
HEMI (%) |
CELL (%) |
Lignin (%) |
|
| Tall fescue (TF) | 61.23 | -1.5 | 69.4 | -2.3 | 16.0 | 0.6 | 34.4 | 34.9 | 28.3 | 4.5 |
| Bermudagrass (BG) | 55.7 | 1.6 | 67.9 | 0.9 | 12.7 | -0.7 | 29.1 | 38.8 | 25.0 | 4.0 |
| Switchgrass (SG) | 62.3 | -2.3 | 68.0 | 3.9 | 13.4 | -2.4 | 33.4 | 34.5 | 28.9 | 3.8 |
| Significance (P): | ||||||||||
| Grass | 0.04 | 0.03 | 0.48 | 0.02 | 0.04 | 0.01 | 0.01 | 0.12 | 0.01 | 0.02 |
| TF vs. (BG+SG) | 0.11 | 0.1 | 0.28 | 0.01 | 0.02 | 0.01 | 0.01 | 0.25 | 0.02 | 0.01 |
| BG vs. SG | 0.02 | 0.02 | 0.96 | 0.04 | 0.32 | 0.01 | 0.01 | 0.07 | <0.01 | 0.20 |
| MSD4 | 4.2 | 2.3 | 3.6 | 2.7 | 2.0 | 0.9 | 1.6 | 4.6 | 1.1 | 0.3 |
1 CP = crude protein; ADF = acid detergent fiber; HEMI = hemicellulose; CELL = cellulose. ↲
2 DV = difference value (weighback concentration minus AF concentration). ↲
3 Each value is the mean of three steers. ↲
4 MSD = minimum significant difference from the Waller-Duncan k-ratio (k = 100) t-test and can be used to compare any two grasses. ↲
| Grass | Whole Masticate1 | Particle-size Classes2 | |||||||||||
|---|---|---|---|---|---|---|---|---|---|---|---|---|---|
| Large | Medium | Small | |||||||||||
| DM (%) |
MPS (mm) |
IVDMD (%) |
NDF (%) |
Prop (%) |
IVDMD (%) |
NDF (%) |
Prop (%) |
IVDMD (%) |
NDF (%) |
Prop (%) |
IVDMD (%) |
NDF (%) |
|
| Tall fescue (TF) | 17.13 | 1.4 | 67.1 | 68.1 | 38.6 | 66.3 | 69.3 | 51.4 | 67.3 | 67.8 | 10.0 | 68.1 | 64.5 |
| Bermudagrass (BG) | 21.8 | 1.2 | 61.4 | 68.2 | 23.1 | 60.3 | 68.9 | 67.3 | 61.6 | 68.0 | 9.6 | 63.4 | 65.7 |
| Switchgrass (SG) | 19.6 | 1.6 | 68.3 | 70.0 | 48.1 | 66.9 | 71.3 | 43.3 | 69.7 | 69.1 | 8.6 | 70.0 | 67.1 |
| Significance (P): | |||||||||||||
| Grass | <0.01 | <0.01 | <0.01 | 0.07 | <0.01 | <0.01 | 0.11 | <0.01 | <0.01 | 0.27 | 0.43 | <0.01 | 0.03 |
| TF vs. (BG+SG) | <0.01 | 0.71 | <0.01 | 0.16 | 0.14 | 0.01 | 0.12 | 0.01 | 0.13 | 0.33 | 0.37 | 0.17 | 0.02 |
| BG vs. SG | <0.01 | <0.01 | 0.01 | 0.05 | <0.01 | <0.01 | 0.13 | <0.01 | <0.01 | 0.19 | 0.35 | <0.01 | 0.10 |
| MSD4 | 0.9 | 0.1 | 1.4 | 1.9 | 4.9 | 1.9 | 2.1 | 2.8 | 2.7 | 2.0 | 2.7 | 2.3 | 1.8 |
1 DM = dry matter; MPS = median particle size; IVDMD = in vitro dry matter disappearance. ↲
2 Prop = proportion; Large = ≥ 1.7 mm; Medium = < 1.7 and ≥ 0.5 mm; Small = < 0.5mm. ↲
3 Each value is the mean of six steers. ↲
4 MSD = minimum significant difference from the Waller-Duncan k-ratio (k = 100) t-test and can be used to compare any two grasses. ↲
| Grass | Chews1 | Bolus | ||||
|---|---|---|---|---|---|---|
| No. (per min) |
DM (per gram) |
IVDMD (per gram) |
NDF (per gram) |
minutes (per bolus) |
chews (per bolus) |
|
| Tall fescue (TF) | 702 | 1.42 | 2.06 | 2.03 | 0.44 | 30.6 |
| Bermudagrass (BG) | 72 | 0.79 | 1.28 | 1.15 | 0.35 | 24.9 |
| Switchgrass (SG) | 71 | 1.20 | 1.75 | 1.71 | 0.41 | 29.2 |
| Significance (P): | ||||||
| Grass | 0.33 | <0.01 | <0.01 | <0.01 | 0.04 | 0.04 |
| TF vs. (BG+SG) | 0.16 | <0.01 | <0.01 | <0.01 | 0.04 | 0.06 |
| BG vs. SG | 0.67 | <0.01 | <0.01 | <0.01 | 0.06 | 0.05 |
| MSD3 | 2.6 | 0.19 | 0.23 | 0.25 | 0.07 | 4.5 |
1 DM = dry matter; IVDMD = in vitro dry matter disappearance. ↲
2 Each value is the mean of six steers. ↲
3 MSD = minimum significant difference from the Waller-Duncan k-ratio (k = 100)
t-test and can be used to compare any two grasses. ↲
| Grass | ROP | MRT | FILL (lb/100 lb2) |
Fecal Output | |||
|---|---|---|---|---|---|---|---|
| Liquid (% per hour) |
Solid (% per hour) |
Liquid (hours) |
Solid (hours) |
Actual (lb/100 lb2) |
Predicted (lb/100 lb2) |
||
| Tall fescue (TF) | 7.563 | 2.82 | 24.5 | 63.9 | 0.94 | 0.49 | 0.63 |
| Bermudagrass (BG) | 9.32 | 2.78 | 21.4 | 64.8 | 0.92 | 0.61 | 0.61 |
| Switchgrass (SG) | 8.69 | 2.85 | 23.9 | 65.7 | 0.94 | 0.51 | 0.64 |
| Significance (P): | |||||||
| Grass | 0.36 | 0.57 | 0.04 | 0.45 | 0.71 | 0.14 | 0.10 |
| TF vs. (BG+SG) | 0.22 | 0.95 | 0.04 | 0.31 | 0.75 | 0.15 | 0.29 |
| BG vs. SG | 0.57 | 0.34 | 0.03 | 0.51 | 0.50 | 0.11 | 0.06 |
| MSD4 | 3.09 | 0.19 | 1.9 | 3.8 | 0.10 | 0.13 | 0.03 |
1 ROP = rate of passage; MRT = mean retention time; FILL = gastrointestinal-tract dry matter. ↲
2 Body weight basis. ↲
3 Each value is the mean of three steers. ↲
4 MSD = minimum significant difference from the Waller-Duncan k-ratio (k = 100) t-test and can be used to compare any two grasses. ↲
Figure 3.1 Multidimensional scaling (Dim 1 and Dim 2 = dimension one and two) of preference determined in Experiment 3A by sheep and in Experiment 3B by goats with more preferred forage located closer to the upper right corner and less preferred forage closer to the lower left corner (BS = bluestem, SG = switchgrass, AM1 and PM1 = Harvest 1, and AM2 and PM2 = Harvest 2).
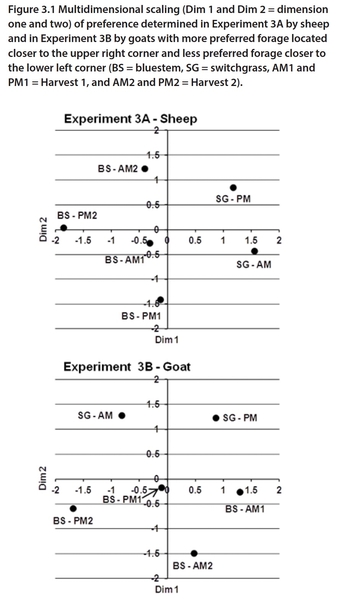
Figure 3.1 Multidimensional scaling (Dim 1 and Dim 2 = dimension one and two) of preference determined in Experiment 3A by sheep and in Experiment 3B by goats with more preferred forage located closer to the upper right corner and less preferred forage closer to the lower left corner.
II. Evaluation of Maturity Influences on Quality of Perennial Warm-Season Grasses
Experiment 5. Increasing Maturity of Initial-Growth Switchgrass: Dry Matter Intake, Digestibility, and Chewing Behavior
Switchgrass, a perennial warm-season grass adapted to the Upper South, has potential as a forage in ruminant production systems. Its use as a hay crop is feasible, but careful management is required if maximum quality is important. Initial growth is generally of desirable quality but declines rapidly with advancing maturity. Our objective in this experiment was to determine the changes in quality of initial-growth switchgrass with advancing physiological maturity—ranging from vegetative through late heading—when preserved as hay.
Materials and Methods
A well-established stand of Kanlow switchgrass provided the experimental hays. The field was burned in late February to remove carryover growth from the previous fall. The field was subsequently top-dressed with 70 pounds of nitrogen per acre in early March in preparation for the production of the experimental hays. Five sequential harvests were made beginning May 18, with forage in the vegetative stage through the boot stage as noted below:
- Vegetative, cut May 18, mean height of 40 inches
- Vegetative, cut May 31, mean height of 49 inches
- Late vegetative, cut June 22, mean height of 66 inches
- Early boot, cut July 5, mean height of 70 inches
- Boot, cut July 19, mean height of 66 inches
This range in maturity covers the period in which major changes in nutritive value occur. For purposes of estimating change, the first cut was taken May 18 and designated day 0, followed by May 31 (day 13), June 22 (day 35), July 5 (day 48), and July 19 (day 62).
Each treatment was flail-chopped to about 5 inches, blown into a self-unloading wagon, and transported to a bulk-drying barn located at the NC State University Forage-Animal Metabolism Unit in Raleigh, NC. The forage was unloaded and forced-air dried overnight at 165°F to approximately 90% dry matter. The following day, hay was baled from the dryer with a conventional square baler and the bales were stored on wooden pallets in an experimental-hay storage barn at the NC State University Forage-Animal Metabolism Unit in Raleigh, NC, until fed. Because the hay had been flail-chopped (reduced to 3 to 6 inches), no further processing was needed prior to feeding (Appendix GP-1).
Two experiments consisting of an intake and digestibility experiment (Experiment 5A) and a mastication experiment (Experiment 5B) were conducted. Five Angus steers of similar weight (mean = 540 ± 32.4 pounds) were used in Experiment 5A in a 5 × 5 Latin square design. The steers were assigned at random to a treatment in period one. Intake and digestibility estimates were obtained by standard procedures (Appendix GP-2). During the digestibility phase, external markers were administered orally to obtain estimates of digesta kinetics and fecal output. Cobalt was used to obtain estimates of rate of passage and mean retention time of the liquid phase. Chromium, attached to the fiber, was used to obtain estimates of the rate of passage and mean retention time of the solid phase as well as total fill and fecal output (Appendix GP-6).
In Experiment 5B, mastication characteristics were evaluated using five mature, esophageally cannulated Angus steers, also in a 5 × 5 Latin square design. The collected whole masticate was split, and one fraction evaluated for nutritive value and the other fraction, along with the fecal samples from the digestibility trial, sieved to determine median particle size and particle-size classes consisting of large, medium, and small (Appendix GP-5).
All as-fed hay, weighback, and masticate samples were analyzed for nutritive value and fecal samples for chemical composition according to standard procedures (Appendix GP-7). The data were analyzed statistically according to the experimental design (Appendix GP-8).
Results and Discussion
Experiment 5A
Switchgrass cut for hay in the vegetative stage (May 18) was greatest in dry matter intake, averaging 2.38 pounds per 100 pounds of body weight and having a dry matter digestibility of 59.2% (Table 5.1). This forage would support about 1.0 pound of daily gain when fed to a 600-pound steer. The strong influence of increasing maturity of switchgrass on forage quality is evident, as dry matter intake decreased quadratically and digestibilities of dry matter and fiber fractions decreased linearly through the boot stage (Table 5.1). The strong linear component was also evident for dry matter intake, but dry matter intake decreased at a declining rate by days 48 and 62 (Table 5.1). The digestible intakes of dry matter and neutral detergent fiber, as well as constituent fiber fractions, gave significant cubic declines with maturity, which we attributed to the decreased declining rate at the greater maturities. An estimate of steer response for any day during the 62 days of switchgrass growth is of interest and can be obtained by using the prediction equation of the form Y = a + b1X + b2X2. Here Y is the value for the variable of interest, a is the intercept, b1 and b2 are the coefficients representing linear and quadratic components, and X is the day selected (from 0 to 62) within the May 18 through July 19 cuts (Table 5.2). For example, for day 40 (40 days after the May 18 cut), the equation to estimate dry matter intake would be Y = 2.38 + (-0.042 × 40) + [0.00035 × (40)2)] or dry matter intake (Y) = 1.26 pounds per 100 pounds of body weight. The relationships among dry matter intake, dry matter digestibility, and digestible dry matter intake and neutral detergent fiber concentrations across maturities are more easily viewed when plotted in figure form (Figure 5.1).
The as-fed hays reflect the steer responses, with in vitro dry matter disappearance declining cubically, crude protein declining quadratically, and neutral detergent fiber increasing quadratically with advancing maturity (Table 5.3). The other fiber fractions, except lignin, likewise gave cubic increases.
Selective consumption was evident, as the difference values (weighback concentration minus as-fed concentration) had greater concentrations in neutral detergent fiber and lesser concentrations in both in vitro dry matter disappearance and crude protein. Selectivity was altered to some degree by maturity effects (linear increase for in vitro dry matter disappearance, quadratic change for neutral detergent fiber, and cubic response for crude protein).
Digesta kinetics indicated that both the rate of passage and mean retention times of both liquid and solid phases were altered by switchgrass maturity, whereas the predicted gastrointestinal-tract fill (FILL) was unaltered—averaging 104 pounds per 100 pounds of body weight (Table 5.4). The actual intake during the digestibility phase was generally lesser than obtained in the intake phase and consistent with the often observed reduced intake of crate-confined animals. Using the marker estimates of fecal output (Table 5.4) along with the masticate in vitro dry matter disappearance (Table 5.4), the dry matter intake was predicted and resulted in similar responses to increasing maturity, with actual dry matter intake decreasing cubically and predicted dry matter intake decreasing quadratically. This is consistent with the nutritive value changes and the quadratic response noted for the predicted digestible dry matter intake (Table 5.4).
The estimates of fecal output were similar between actual outputs measured in the digestibility phase compared with the marker estimate (Table 5.5). Both estimates declined with increasing maturity, with the actual values giving a linear decrease and the predicted giving a quadratic reduction. Median particle size and the proportion of large and medium particle sizes gave linear declines with increasing maturity, whereas the proportion of small particles increased linearly.
Experiment 5B
The whole masticate dry matter gave a cubic response to increased switchgrass maturity and is likely associated with chewing behavior, as median particle size of the masticate increased linearly (Table 5.6) and would likely be reflected in some degree of saliva incorporation. The in vitro dry matter disappearance and crude protein decreased in the masticate with increasing maturity, giving linear and cubic responses, respectively. The neutral detergent fiber concentration increased linearly, even though some selective consumption was practiced. Examining the masticate further, by separating the dry matter into particle-size classes, resulted in 48.4% large particles, 42.0% medium particles, and 8.8% small particles, with neither the large nor medium proportion of particles altered by maturity (Table 5.7). The proportion of small particles, however, increased linearly from the vegetative to the boot stage and was attributed to chewing behavior. The nutritive value within particle-size classes generally followed the same trend, with in vitro dry matter disappearance decreasing and neutral detergent fiber increasing with maturity.
Chewing behavior was evaluated, and the number of chews per minute averaged 63 and was not altered by maturity (Table 5.8). However, when based on a gram of dry matter, in vitro dry matter disappearance, crude protein, or neutral detergent fiber, chews increased linearly with increasing maturity, regardless of variable. When considering boluses, the minutes per bolus and chews per bolus declined until the June 22 cut hay, then increased, giving a quadratic response.
Summary and Conclusions
- Steers readily consumed switchgrass hays of all maturities.
- Switchgrass hay in the early vegetative stage had very acceptable quality when well fertilized, with steers consuming 2.38 pounds per 100 pounds of body weight—with a dry matter digestibility of 59.2% and a crude protein concentration of 10.1%.
- Delaying the cutting of switchgrass 35 days after the May 18 cut (to June 22) resulted in a rapid decline in hay quality, with dry matter intake averaging only 57% of the intake of hay cut on May 18. Although the switchgrass was still vegetative on June 22, appreciable stem elongation had occurred in 35 days.
- The early vegetative stages of Kanlow switchgrass conserved as hay can provide a nutrient source for growing ruminants. Delaying harvest of this robust grass through stem elongation, even though it is still in the mid to late vegetative stages, reduced hay quality to a maintenance-type diet.
| Date of Cut | Days of Growth1 | DMI (lb/100 lb3) |
Digestibilities2 | Digestible Intakes | ||||||||
|---|---|---|---|---|---|---|---|---|---|---|---|---|
| DM (%) |
NDF (%) |
ADF (%) |
HEMI (%) |
CELL (%) |
DM (lb/100 lb3) |
NDF (lb/100 lb3) |
ADF (lb/100 lb3) |
HEMI (lb/100 lb3) |
CELL (lb/100 lb3) |
|||
| May 18 | 0 | 2.384 | 59.2 | 60.1 | 57.5 | 62.9 | 66.5 | 1.41 | 1.01 | 0.50 | 0.51 | 0.49 |
| May 31 | 13 | 1.78 | 56.2 | 56.6 | 52.5 | 61.3 | 62.7 | 0.99 | 0.72 | 0.35 | 0.37 | 0.36 |
| June 22 | 35 | 1.35 | 54.0 | 53.1 | 50.1 | 56.9 | 58.6 | 0.73 | 0.54 | 0.29 | 0.26 | 0.28 |
| July 5 | 48 | 1.17 | 49.7 | 48.7 | 43.9 | 55.1 | 51.5 | 0.58 | 0.45 | 0.24 | 0.22 | 0.23 |
| July 19 | 62 | 1.08 | 45.1 | 44.1 | 39.0 | 50.9 | 48.0 | 0.49 | 0.38 | 0.19 | 0.19 | 0.19 |
| Significance (P): | ||||||||||||
| Date of Cut | <0.01 | <0.01 | <0.01 | <0.01 | 0.02 | <0.01 | <0.01 | <0.01 | <0.01 | <0.01 | <0.01 | |
| Linear | <0.01 | <0.01 | <0.01 | <0.01 | <0.01 | <0.01 | <0.01 | <0.01 | <0.01 | <0.01 | <0.01 | |
| Quadratic | <0.01 | 0.38 | 0.61 | 0.58 | 0.69 | 0.63 | <0.01 | <0.01 | <0.01 | <0.01 | <0.01 | |
| Cubic | 0.25 | 0.62 | 0.76 | 0.60 | 0.92 | 0.96 | 0.01 | 0.01 | 0.01 | 0.01 | 0.03 | |
| Lack of Fit | 0.50 | 0.63 | 0.76 | 0.50 | 0.79 | 0.48 | 0.07 | 0.25 | 0.21 | 0.46 | 0.22 | |
1 After May 18. ↲
2 NDF = neutral detergent fiber; ADF = acid detergent fiber; HEMI = hemicellulose; CELL = cellulose. ↲
3 Body weight basis. ↲
4 Each value is the mean of five steers. ↲
| Variable |
Intercept (a) |
Component1 | R2 | |
|---|---|---|---|---|
| Linear (b1) | Quadratic (b2) | |||
| In vivo response | ||||
| Intake (lb/100 lb body weight) | ||||
| Dry Matter (DM) | 2.38 | -0.042 | 0.0352 | 0.99 |
| Digestible DM | 1.30 | -0.014 | - | 0.93 |
| Digestibility (%) | ||||
| DM | 59.8 | -0.214 | - | 0.95 |
| CP | 59.6 | -0.519 | - | 0.99 |
| NDF | 60.6 | -0.249 | - | 0.98 |
| ADF | 57.8 | -0.282 | - | 0.96 |
| Hemicellulose | 67.2 | -0.300 | - | 0.97 |
| Cellulose | 63.6 | -0.188 | - | 0.98 |
| Constituents of digestible intake (lb/100 lb body weight) | ||||
| CP | 0.12 | -0.002 | - | 0.88 |
| NDF | 0.94 | -0.010 | - | 0.93 |
| ADF | 0.46 | -0.005 | - | 0.93 |
| Hemicellulose | 0.46 | -0.005 | - | 0.95 |
| Cellulose | 0.47 | -0.005 | - | 0.92 |
| Nutritive Value | ||||
| 48-hr DM disappearance | 62.11 | -0.394 | - | 0.98 |
| NDF concentration | 70.88 | -0.211 | -0.001 | 0.99 |
1 The greatest significant (P < 0.05) component of the equation is given. ↲
2 Multiply parameter by 10-2. ↲
| Date of Cut | Days of Growth | IVDMD | CP | NDF | Fiber Fractions | ||||||
|---|---|---|---|---|---|---|---|---|---|---|---|
| AF (%) |
DV2 (%) |
AF (%) |
DV (%) |
AF (%) |
DV (%) |
ADF (%) |
HEMI (%) |
CELL (%) |
Lignin (%) |
||
| May 18 | 0 | 61.73 | -2.9 | 10.1 | -1.7 | 71.3 | 3.0 | 36.9 | 34.3 | 31.5 | 4.4 |
| May 31 | 13 | 57.6 | -4.8 | 7.8 | -2.7 | 73.3 | 5.2 | 39.2 | 34.1 | 33.3 | 5.2 |
| June 22 | 35 | 47.0 | -4.6 | 5.8 | -2.4 | 76.7 | 4.9 | 43.3 | 33.4 | 36.2 | 6.5 |
| July 5 | 48 | 41.2 | -5.7 | 4.3 | -1.6 | 77.9 | 4.1 | 45.3 | 32.6 | 36.8 | 7.7 |
| July 19 | 62 | 38.9 | -5.7 | 3.5 | -1.3 | 78.3 | 3.1 | 44.6 | 33.7 | 36.1 | 7.5 |
| Significance (P): | |||||||||||
| Date of Cut | <0.01 | 0.23 | <0.01 | 0.01 | <0.01 | 0.05 | <0.01 | <0.01 | <0.01 | <0.01 | |
| Linear | <0.01 | 0.04 | <0.01 | 0.02 | <0.01 | 0.64 | <0.01 | <0.01 | <0.01 | <0.01 | |
| Quadratic | <0.01 | 0.53 | <0.01 | <0.01 | <0.01 | 0.01 | <0.01 | 0.01 | <0.01 | <0.01 | |
| Cubic | <0.01 | 0.59 | 0.16 | 0.05 | 0.15 | 0.21 | <0.01 | 0.02 | 0.01 | 0.01 | |
| Lack of Fit | 0.59 | 0.42 | 0.08 | 0.55 | 0.81 | 0.69 | 0.12 | 0.10 | 0.83 | 0.01 | |
1 CP = crude protein; NDF = neutral detergent fiber; ADF = acid detergent fiber; HEMI = hemicellulose; CELL = cellulose. ↲
2 DV = difference value (weighback concentration minus AF concentration). ↲
3 Each value is the mean of five steers. ↲
| Date of Cut | Days of Growth | ROP | MRT | FILL (lb/100 lb body weight) |
Intake | |||||
|---|---|---|---|---|---|---|---|---|---|---|
| Actual1 Ad. Lib. (lb/100 lb body weight) |
Digestibility Phase | Digestible DMI4 (Predicted) (lb/100 lb body weight) |
||||||||
| Liquid (% per hour) |
Solid (% per hour) |
Liquid (hour) |
Solid (hour) |
Actual2 (lb/100 lb body weight) |
Predicted3 (lb/100 lb body weight) |
|||||
| May 18 | 0 | 9.575 | 3.4 | 20.3 | 54.4 | 1.08 | 2.38 | 1.97 | 2.60 | 1.69 |
| May 31 | 13 | 7.76 | 2.71 | 24.6 | 66.7 | 1.01 | 1.78 | 1.40 | 1.68 | 1.02 |
| June 22 | 35 | 6.30 | 2.37 | 27.7 | 76.7 | 0.99 | 1.35 | 1.22 | 1.31 | 0.75 |
| July 5 | 48 | 6.53 | 2.20 | 29.1 | 82.4 | 1.06 | 1.17 | 1.05 | 1.22 | 0.66 |
| July 19 | 62 | 6.23 | 2.12 | 29.9 | 84.5 | 1.05 | 1.08 | 0.91 | 1.13 | 0.60 |
| Significance (P): | ||||||||||
| Date of Cut | <0.01 | <0.01 | <0.01 | <0.01 | 0.96 | <0.01 | <0.01 | <0.01 | <0.01 | |
| Linear | <0.01 | <0.01 | <0.01 | <0.01 | 0.94 | <0.01 | <0.01 | <0.01 | <0.01 | |
| Quadratic | 0.03 | <0.01 | 0.05 | <0.01 | 0.58 | <0.01 | 0.01 | 0.01 | <0.01 | |
| Cubic | 0.42 | 0.01 | 0.47 | 0.41 | 0.66 | 0.25 | 0.02 | 0.10 | 0.06 | |
| Lack of Fit | 0.60 | 0.11 | 0.71 | 0.30 | 0.77 | 0.50 | 0.22 | 0.68 | 0.56 | |
1 Fed at 13.4% ad libitum; see Table 5.1. ↲
2 Actual intakes during the five-day digestion phase. ↲
3 Intake predicted from marker estimate of fecal output (FO) and in vitro dry matter disappearance (IVDMD) of the masticate as: FO/(1-IVDMD). ↲
4 Digestible DMI using predicted DMI multiplied by masticate IVDMD. ↲
5 Each value is the mean of five steers. ↲
| Date of Cut | Days of Growth | Fecal Output | MPS (mm) |
Particle-size Class2 | |||
|---|---|---|---|---|---|---|---|
| Actual (lb/100 lb3) |
Predicted1 (lb/100 lb3) |
Large (%) |
Medium (%) |
Small (%) |
|||
| May 18 | 0 | 0.814 | 0.90 | 0.39 | 1.0 | 31.4 | 67.6 |
| May 31 | 13 | 0.61 | 0.66 | 0.33 | 0.7 | 22.7 | 76.6 |
| June 22 | 35 | 0.56 | 0.56 | 0.32 | 0.6 | 20.7 | 78.7 |
| July 5 | 48 | 0.53 | 0.56 | 0.30 | 0.4 | 19.6 | 80.0 |
| July 19 | 62 | 0.50 | 0.53 | 0.28 | 0.5 | 18.3 | 81.2 |
| Significance (P): | |||||||
| Date of cut | <0.01 | 0.01 | 0.01 | 0.01 | 0.01 | 0.01 | |
| Linear | <0.01 | <0.01 | <0.01 | <0.01 | <0.01 | <0.01 | |
| Quadratic | 0.09 | 0.05 | 0.33 | 0.15 | 0.15 | 0.14 | |
| Cubic | 0.18 | 0.21 | 0.33 | 0.91 | 0.25 | 0.26 | |
| Lack of Fit | 0.64 | 0.89 | 0.44 | 0.29 | 0.71 | 0.68 | |
1 Predicted from marker estimates. ↲
2 Large = ≥ 1.7 mm; Medium = < 1.7 and ≥ 0.5 mm; Small = < 0.5 mm. ↲
3 Body weight basis. ↲
4 Each value is the mean of five steers. ↲
| Date of Cut | Days of Growth | DM (%) |
MPS (mm) |
Nutritive Value1 | ||
|---|---|---|---|---|---|---|
| IVDMD (%) |
CP (%) |
NDF (%) |
||||
| May 18 | 0 | 17.62 | 1.7 | 65.1 | 10.1 | 70.9 |
| May 31 | 13 | 18.3 | 1.7 | 60.9 | 7.7 | 72.9 |
| June 22 | 35 | 16.5 | 1.6 | 57.1 | 6.0 | 74.8 |
| July 5 | 48 | 16.3 | 1.6 | 54.3 | 5.4 | 74.9 |
| July 19 | 62 | 17.1 | 1.4 | 52.9 | 4.9 | 75.8 |
| Significance (P): | ||||||
| Date of Cut | 0.09 | <0.01 | <0.01 | <0.01 | <0.01 | |
| Linear | 0.06 | <0.01 | <0.01 | <0.01 | <0.01 | |
| Quadratic | 0.36 | 0.08 | 0.15 | <0.01 | 0.06 | |
| Cubic | 0.05 | 0.86 | 0.71 | 0.01 | 0.34 | |
| Lack of Fit | 0.51 | 0.86 | 0.43 | 0.60 | 0.56 | |
1 IVDMD = in vitro dry matter disappearance; CP = crude protein; NDF = neutral detergent fiber. ↲
2 Each value is the average of three to four samples and the mean of five steers. ↲
| Date of Cut | Days of Growth | Large | Medium | Small | ||||||
|---|---|---|---|---|---|---|---|---|---|---|
| Prop | IVDMD | NDF | Prop | IVDMD | NDF | Prop | IVDMD | NDF | ||
| May 18 | 0 | 49.73 | 65.0 | 71.5 | 42.7 | 67.1 | 68.8 | 7.6 | 67.7 | 65.3 |
| May 31 | 13 | 49.6 | 58.8 | 75.0 | 42.6 | 63.6 | 70.4 | 7.8 | 65.3 | 66.8 |
| June 22 | 35 | 52.1 | 53.6 | 76.8 | 39.6 | 59.9 | 72.3 | 8.3 | 64.0 | 67.5 |
| July 5 | 48 | 45.0 | 50.4 | 76.7 | 45.2 | 57.9 | 72.2 | 9.8 | 63.2 | 66.3 |
| July 19 | 62 | 45.7 | 46.2 | 77.4 | 43.7 | 54.1 | 73.5 | 10.6 | 60.4 | 67.7 |
| Significance (P): | ||||||||||
| Date of Cut | 0.58 | <0.01 | <0.01 | 0.67 | <0.01 | <0.01 | 0.12 | <0.01 | <0.01 | |
| Linear | 0.30 | <0.01 | <0.01 | 0.65 | <0.01 | <0.01 | 0.01 | <0.01 | <0.01 | |
| Quadratic | 0.49 | 0.04 | <0.01 | 0.53 | 0.92 | 0.18 | 0.39 | 0.59 | 0.10 | |
| Cubic | 0.79 | 0.01 | 0.02 | 0.77 | 0.10 | 0.27 | 0.85 | 0.02 | <0.01 | |
| Lack of Fit | 0.29 | 0.48 | 0.81 | 0.22 | 0.85 | 0.21 | 0.65 | 0.91 | 0.03 | |
1 IVDMD = in vitro dry matter disappearance; NDF = neutral detergent fiber. ↲
2 Large = ≥ 1.7 mm; Medium = < 1.7 and ≥ 0.5 mm; Small = < 0.5 mm. ↲
3 Each value is the average of three to four samples and the mean of five steers. ↲
| Date of Cut | Days of Growth | Chews1 | Bolus | |||||
|---|---|---|---|---|---|---|---|---|
| No. (per min) |
DM (per gram) |
IVDMD (per gram) |
CP (per gram) |
NDF (per gram) |
min (per bolus) |
chews (per bolus) |
||
| May 18 | 0 | 652 | 1.4 | 2.1 | 13.3 | 1.9 | 0.31 | 19.4 |
| May 31 | 13 | 59 | 1.6 | 2.5 | 19.9 | 2.1 | 0.31 | 18.6 |
| June 22 | 35 | 64 | 1.7 | 2.9 | 28.0 | 2.2 | 0.27 | 17.2 |
| July 5 | 48 | 62 | 1.8 | 3.3 | 33.3 | 2.4 | 0.29 | 18.1 |
| July 19 | 62 | 65 | 2.2 | 3.9 | 42.5 | 2.7 | 0.30 | 20.0 |
| Significance (P): | ||||||||
| Date of Cut | 0.56 | 0.01 | <0.01 | <0.01 | 0.07 | 0.16 | 0.22 | |
| Linear | 0.82 | <0.01 | <0.01 | <0.01 | 0.01 | 0.27 | 0.94 | |
| Quadratic | 0.36 | 0.39 | 0.79 | 0.55 | 0.65 | 0.05 | 0.03 | |
| Cubic | 0.37 | 0.41 | 0.72 | 0.45 | 0.55 | 0.42 | 0.53 | |
| Lack of Fit | 0.28 | 0.97 | 0.99 | 0.89 | 0.89 | 0.31 | 0.74 | |
1 DM = dry matter; IVDMD = in vitro dry matter disappearance; CP = crude protein; NDF = neutral detergent fiber. ↲
2 Each value is the average of twelve samples and the mean of five steers. ↲
Experiment 6. Increasing Maturity of Initial-Growth Switchgrass: Dry Matter Intake, Digestibility, and Digesta Kinetics
As noted in Experiment 5, the initial growth of switchgrass is generally of desirable quality but its quality declines rapidly with advancing maturity. In this experiment, we address the same principle as in Experiment 5—determining the change in quality of initial growth with advancing physiological maturity—but with one less harvest.
Materials and Methods
A well-established stand of Kanlow switchgrass provided the experimental hay. The field was burned in late February to remove carryover growth from the previous fall. The field was subsequently top-dressed with 70 pounds of nitrogen per acre in early March in preparation for the production of the experimental hay. Four sequential harvests were made beginning May 23, with forage in the vegetative through late boot stages as noted below:
-
Vegetative, cut May 23, mean height of 38 inches
-
Vegetative, cut June 6, mean height of 45 inches
-
Late vegetative, cut June 20, mean height of 48 inches
-
Late boot, cut July 3, mean height of 56 inches
These treatments cover the period in which major changes in nutritive value occur. For purposes of estimating daily changes, the first cut was taken May 23 and represents day 0, followed by June 6 (day 14), June 20 (day 28), and July 3 (day 41).
Each treatment was flail-chopped to about 5 inches, blown into a self-unloading wagon, and transported to a bulk-drying barn located at the NC State University Forage-Animal Metabolism Unit in Raleigh, NC. The forage was unloaded and forced-air dried overnight at 185°F to approximately 90% dry matter. The following day, the hay was baled from the dryer with a conventional square baler and the bales stored on wooden pallets in an experimental-hay storage barn until feeding. Because the hay had been previously flail-chopped (reduced to 3 to 6 inches), no further processing was needed prior to feeding (Appendix GP-1).
The intake and digestibility experiment was conducted as a 4 × 4 Latin square design. Four Angus steers similar in weight (mean = 476 ± 40 pounds) were used and assigned at random to a treatment in period one. Intake and digestibility estimates were obtained by standard procedures (Appendix GP-2). During the digestibility phase, external markers were administered orally to obtain estimates of digesta kinetics and fecal output. Estimates of rate of passage and mean retention time were determined using cobalt for the liquid phase and chromium, attached to the fiber, for the solid phase. Total gastrointestinal tract fill (FILL) and fecal output were also determined (Appendix GP-6). Further, fecal median particle size was determined by treatment (Appendix GP-5).
All as-fed hay and weighback samples were analyzed for nutritive value and fecal samples for chemical composition according to standard procedures (Appendix GP-7). The data were analyzed statistically according to the experimental design (Appendix GP-8).
Results and Discussion
Switchgrass cut May 23 and vegetative was greatest in dry matter intake, averaging 2.12 pounds per 100 pounds of body weight with a dry matter digestibility of 64.3% (Table 6.1) and crude protein concentration above 14%. This forage, although adequate in dry matter digestibility and crude protein concentrations for growing steers, is limited in quality by its relatively modest dry matter intake. Delaying harvest further reduced dry matter intake linearly to 1.45 pounds per 100 pounds of body weight, with dry matter digestibility declining quadratically form 64.3 to 54.5%. The linear component was strong for the reduction in digestible neutral detergent fiber and its constituent fiber fractions, as well as the digestible intake of dry matter and neutral detergent fiber and the constituent fiber fractions. The quadratic term generally surfaced when the degree of decline decreased with advancing maturity. An estimate of steer response for any day during the 41-day hay growth period is of interest and can be obtained by using the prediction equation of the form Y = a + b1X + b2X2. Here Y is the value for the variable of interest, a is the intercept, b1 and b2 are the coefficients representing the linear and quadratic components, respectively, and X is any day from 0 to 41 representing the May 23 through the July 3 cut (Table 6.2). For example, on day 40 (30 days after the May 23 cut), the equation to estimate dry matter intake would be Y = 2.08 + (-0.015 × 30), or dry matter intake = 1.63 pounds per 100 pounds of body weight. The relationships among dry matter intake, dry matter digestibility and digestible dry matter intake, and neutral detergent fiber concentrations are more easily viewed when plotted in figure format (Figure 6.1).
The as-fed hays declined in nutritive value with increasing maturity and are reflective of animal responses (Table 6.3). A strong linear component is evident, with the quadratic response becoming significant as the rate of decline in nutrient concentrations (decline in in vitro dry matter disappearance and crude protein and increase in neutral detergent fiber and fiber constituents) decreased at the more advanced maturities.
Selective consumption was evident in this experiment as the difference values (weighback concentration minus as-fed concentration) had greater concentrations in neutral detergent fiber and lesser concentrations in in vitro dry matter disappearance and crude protein. Further, the difference value increased linearly for in vitro dry matter and quadratically for crude protein with increasing maturity, which is indicative of increasing selective consumption. The greater difference values for neutral detergent fiber were not altered by maturity.
Digesta kinetics revealed that the rate of passage of the liquid phase decreased linearly, whereas solids decreased quadratically, with increased maturity (Table 6.4). Consequently, mean retention times reflect a linear increase of the liquid phase and a quadratic increase in the solid phase. Associated with increased retention time was a linear increase in gastrointestinal tract fill. The use of markers to estimate fecal output (predicted) gave similar responses to the actual estimates obtained during the digestibility trial and were positively correlated (r = 0.83; P = 0.17).
Summary and Conclusions
- Steers readily consumed Kanlow switchgrass hay of all maturities.
-
Switchgrass hay in the vegetative stage had very acceptable dry matter digestibility of 64.3% and crude protein of 14.1%, but dry matter intake of 2.12 pounds per 100 pounds of body weight would limit animal performance.
-
Stem elongation following the May 23 cutting resulted in a rapid decline in nutritive value and hay quality with dry matter intake of hay by July 3 being only 68% of the hay cut May 23.
-
Although steers all consumed Kanlow switchgrass without hesitation, adequate dry matter intake to support reasonable steer performance requires cutting in the early to mid vegetative stages and prior to excessive stem elongation.
| Date of Cut | Days of Growth | DMI (lb/100 lb2) |
Digestibilities1 | Digestible Intakes | ||||||||
|---|---|---|---|---|---|---|---|---|---|---|---|---|
| DM (%) |
NDF (%) |
ADF (%) |
HEMI (%) |
CELL (%) |
DM (lb/100 lb2) |
NDF (lb/100 lb2) |
ADF (lb/100 lb2) |
HEMI (lb/100 lb2) |
CELL (lb/100 lb2) |
|||
| May 23 | 0 | 2.123 | 64.3 | 65.7 | 62.1 | 69.5 | 71.4 | 1.36 | 0.94 | 0.46 | 0.48 | 0.45 |
| June 6 | 14 | 1.77 | 59.6 | 59.3 | 54.7 | 64.7 | 64.5 | 1.05 | 0.74 | 0.35 | 0.38 | 0.36 |
| June 20 | 28 | 1.71 | 56.2 | 56.0 | 50.7 | 62.0 | 60.4 | 0.96 | 0.69 | 0.32 | 0.37 | 0.32 |
| July 3 | 41 | 1.45 | 54.5 | 54.3 | 48.3 | 61.4 | 58.2 | 0.79 | 0.56 | 0.26 | 0.30 | 0.26 |
| Significance (P): | ||||||||||||
| Date of Cut | <0.01 | <0.01 | <0.01 | <0.01 | <0.01 | <0.01 | <0.01 | <0.01 | <0.01 | <0.01 | <0.01 | |
| Linear | <0.01 | <0.01 | <0.01 | <0.01 | <0.01 | <0.01 | <0.01 | <0.01 | <0.01 | <0.01 | <0.01 | |
| Quadratic | 0.43 | 0.05 | 0.04 | 0.07 | 0.05 | 0.04 | 0.07 | 0.10 | 0.04 | 0.29 | 0.05 | |
| Lack of Fit | 0.09 | 0.92 | 0.75 | 0.71 | 0.99 | 0.85 | 0.08 | 0.06 | 0.10 | 0.05 | 0.09 | |
1 NDF = neutral detergent fiber; ADF = acid detergent fiber; HEMI = hemicellulose; CELL = cellulose. ↲
2 Body weight basis. ↲
3 Each value is the mean of four steers. ↲
| Variable | Intercept (a) | Component1 | R2 | |
|---|---|---|---|---|
| Linear (b1) | Quadratic (b2) | |||
| In vivo response | ||||
| Intake (lb/100 lb body weight) | ||||
| Dry Matter (DM) | 2.08 | -0.015 | - | 0.93 |
| Digestible DM | 1.32 | -0.013 | - | 0.94 |
| Digestibility (%) | ||||
| DM | 64.7 | -0.419 | 0.0422 | 0.99 |
| CP | 64.3 | -0.417 | - | 0.87 |
| NDF | 64.7 | -0.279 | - | 0.93 |
| ADF | 61.1 | -0.337 | - | 0.94 |
| Cellulose | ||||
| Hemicellulose | 69.9 | -0.450 | 0.0592 | 0.99 |
| Constituents of digestible intake (lb/100 lb body weight) | ||||
| NDF | 94.6 | -0.009 | - | 0.94 |
| CP | 0.19 | -0.004 | - | 0.89 |
| ADF | 4.45 | -0.005 | - | 0.95 |
| Cellulose | 0.44 | -0.005 | - | 0.92 |
| Hemicellulose | 0.47 | -0.004 | - | 0.96 |
| Nutritive value | ||||
| 48-hr DM disappearance | 56.3 | -0.320 | - | 0.79 |
| NDF concentration | 69.0 | -0.119 | - | 0.91 |
1The greatest significant (P < 0.05) component of the equation is given. ↲
2 Multiply parameter by 10-1. ↲
| Date of Cut | Days of Growth | IVDMD | CP | NDF | Fiber Fractions | ||||||
|---|---|---|---|---|---|---|---|---|---|---|---|
| AF (%) |
DV2 (%) |
AF (%) |
DV (%) |
AF (%) |
DV (%) |
ADF (%) |
HEMI (%) |
CELL (%) |
Lignin (%) |
||
| May 23 | 0 | 59.33 | -2.5 | 14.1 | -2.8 | 68.5 | 4.0 | 35.8 | 32.7 | 30.6 | 4.4 |
| June 6 | 14 | 49.8 | -4.5 | 10.5 | -5.1 | 71.5 | 5.5 | 38.0 | 33.5 | 32.2 | 4.8 |
| June 20 | 28 | 44.0 | -5.6 | 9.9 | -5.9 | 72.6 | 7.4 | 38.0 | 34.5 | 31.9 | 5.2 |
| July 3 | 41 | 45.5 | -10.8 | 6.7 | -3.6 | 73.5 | 7.0 | 39.7 | 33.8 | 32.8 | 5.7 |
| Significance (P): | |||||||||||
| Date of Cut | <0.01 | 0.01 | <0.01 | 0.19 | <0.01 | 0.29 | <0.01 | <0.01 | <0.01 | <0.01 | |
| Linear | <0.01 | <0.01 | <0.01 | 0.46 | <0.01 | 0.09 | <0.01 | <0.01 | <0.01 | <0.01 | |
| Quadratic | <0.01 | 0.24 | 0.79 | 0.05 | 0.05 | 0.48 | 0.32 | 0.01 | 0.15 | 0.76 | |
| Lack of Fit | 0.28 | 0.41 | 0.18 | 0.74 | 0.38 | 0.68 | 0.02 | 0.05 | 0.02 | 0.88 | |
1 CP = crude protein; NDF = neutral detergent fiber; ADF = acid detergent fiber; HEMI = hemicellulose; CELL = cellulose. ↲
2 DV = difference value (weighback concentration minus AF concentration). ↲
3 Each value is the mean of four steers. ↲
| Date of Cut | Days of Growth | ROP | MRT | FILL (lb/100 lb2) |
Fecal Characteristics1 | ||||
|---|---|---|---|---|---|---|---|---|---|
| Liquid (% per hour) |
Solid (% per hour) |
Liquid (hours) |
Solid (hours) |
MPS (mm) |
Actual (lb/100 lb2) |
Predicted (lb/100 lb2) |
|||
| May 23 | 0 | 7.753 | 2.88 | 22.9 | 59.8 | 1.04 | 0.34 | 0.62 | 0.71 |
| June 6 | 14 | 7.59 | 2.76 | 23.5 | 61.8 | 1.32 | 0.33 | 0.67 | 0.87 |
| June 20 | 28 | 7.03 | 2.61 | 24.7 | 67.9 | 1.17 | 0.36 | 0.64 | 0.73 |
| July 3 | 41 | 5.91 | 2.10 | 29.8 | 81.1 | 1.42 | 0.31 | 0.60 | 0.71 |
| Significance (P): | |||||||||
| Date of Cut | 0.04 | <0.01 | 0.02 | <0.01 | 0.10 | 0.33 | 0.60 | 0.27 | |
| Linear | 0.01 | <0.01 | 0.01 | <0.01 | 0.05 | 0.64 | 0.66 | 0.59 | |
| Quadratic | 0.23 | 0.05 | 0.10 | 0.03 | 0.90 | 0.37 | 0.25 | 0.18 | |
| Lack of Fit | 0.93 | 0.42 | 0.54 | 0.75 | 0.09 | 0.13 | 0.73 | 0.17 | |
1 MPS = median particle size; Actual = fecal output measured during the five-day digestion phase; Predicted = fecal output estimated by external marker. ↲
2 Body weight basis. ↲
3 Each value is the mean of four steers. ↲
Experiment 7. Switchgrass and Tall Fescue Harvested at Similar Physiological Growth Stages: Changes in Dry Matter Intake and Masticate Characteristics
Perennial cool-season and warm-season grasses are recommended to develop season-long grazing systems for the Upper South. Both types can complement each other and contribute to maximize grazing because of their growing seasons. Cool-season grasses begin growth in late winter and terminate with heading by late spring, followed by periods of dormancy during the summer with growth resuming in early fall. In contrast, warm-season grasses begin growth in early to mid spring and generally continue growth until killed by frost at or near mid fall.
Forages are generally cut for hay at a described physiological stage of maturity (such as vegetative, boot, or headed). Our objective in this study was to harvest a cool-season and a warm-season perennial grass differing widely in morphological characteristics and grown under their optimum growing seasons, but harvested at similar physiological growth stages to compare their nutritive value and quality.
Materials and Methods
Well established stands—one each of Forager tall fescue and Kanlow switchgrass— provided the respective cool-season and warm-season perennial grass hays for experimentation. The field of Forager was clipped to 2 inches in late February, the clippings removed, and the field top-dressed with 90 pounds of nitrogen per acre. Fall residue on the switchgrass field was burned in late February, and the field was top-dressed with 90 pounds of nitrogen per acre in mid-March for production of the experimental hays.
Six maturity stages each of tall fescue and switchgrass were harvested, resulting in 12 treatments as noted below:
Tall Fescue:
-
Vegetative, cut March 30, mean height 8 inches
-
Vegetative, cut April 4, mean height14 inches
-
Vegetative, cut April 12, mean height 19 inches
-
Boot, cut April 20, mean height 22 inches
-
Anthesis, cut May 8
-
Headed, cut June 12
Switchgrass:
- Vegetative, cut May 5, mean height 18 inches
- Vegetative, cut May 16, mean height 30 inches
- Early boot, cut July 7
- Boot, cut July 14
- Anthesis, cut August 16
- Headed, cut September 7
Two experiments were conducted, with one evaluating dry matter intake (Experiment 7A) and the other evaluating masticate characteristics (Experiment 7B) of the experimental hays. Three treatments of tall fescue (2, 4, and 6) and three of switchgrass (8, 10, and 12)—representing the major growth stages of vegetative, boot, and headed of each species—were fed to steers in Experiment 7A. In Experiment 7B, masticate characteristics and steer chewing behavior of all 12 treatments were determined.
The forages were flail-chopped to a 3-inch stubble for tall fescue and a 6-inch stubble for switchgrass. Forages for intake estimates were blown into a self-unloading wagon, moved to a bulk dryer, and dried overnight at 160°F. The forage treatments evaluated only for masticate characteristics were harvested in lesser quantities but similar to the others and dried in a forced-draft oven (160°F). After drying, all hays were baled using a conventional square baler and stored on wooden pallets in an experimental-hay barn at the NC State University Forage-Animal Metabolism Unit in Raleigh, NC, until fed (Appendix GP-1).
Dry matter intake was measured in Experiment 7A using 24 steers in a randomized complete block design with four steers (replicates) per treatment. The steers were weighed and grouped by weight into four blocks of six steers each. The steers within each block were randomly assigned to the six hay treatments. The intake trial was conducted according to standard procedures (Appendix GP-2), allowing animals a 14.1% feed excess.
Mastication characteristics were determined in Experiment 7B using four esophageally fistulated steers in a randomized complete block design. Each steer was fed three experimental hays each day during a four-day period such that each steer evaluated each hay. The hays were randomly assigned to animals, which were designated as one through four. The masticate and chewing behavior data were collected according to standard procedures (Appendix GP-3).
All as-fed, weighback, and masticate samples were analyzed for nutritive value according to standard procedures (GP-7). The masticate samples were sieved, and median particle size and particle-size classes were determined according to standard procedures (Appendix GP-5). The data were analyzed statistically according to the experimental design (Appendix GP-8).
Results and Discussion
Experiment 7A
Intakes of dry matter and crude protein were greatest for tall fescue compared with switchgrass, with vegetative hays of both grasses having greater intake compared with the boot and headed stages (Table 7.1). However, significant interactions reveal that although dry matter and crude protein intakes of tall fescue changed little between vegetative and boot stages, those of switchgrass decreased significantly. Further, dry matter and crude protein intakes of tall fescue continued to decline from boot to headed stages, whereas switchgrass showed little change. These results indicate that hay quality differed between species at comparable physiological growth stages. The intake of neutral detergent fiber gave similar responses with intake of the constituent fiber fractions shown for completeness (Table 7.1).
The as-fed hays reflect increased maturity with decreasing nutritive value, being lesser in in vitro dry matter disappearance and crude protein and greater in neutral detergent fiber and constituent fiber fractions (Table 7.2). Again, the changes in nutritive value between the two hays interacted, with lesser change noted for the tall fescue than switchgrass between vegetative and boot stages but greater change between boot and headed stages for tall fescue compared with switchgrass.
Experiment 7B
The masticate, evaluated over six maturity dates for each species opposed to only the three maturities noted in Experiment 7A, indicated changes in nutritive value as represented by in vitro dry matter disappearance, crude protein, and neutral detergent fiber. Changes were noted for all three variables and are more easily viewed in figure form (Figure 7.1), with tall fescue differing in each variable compared with switchgrass (Table 7.3). In vitro dry matter disappearance followed a cubic decline for both tall fescue and switchgrass with increasing maturity, whereas the decline in crude protein was linear for tall fescue and quadratic for switchgrass. In the case of neutral detergent fiber, concentrations increased quadratically for switchgrass and were variable for tall fescue, giving a significant lack of fit (Table 7.3).
Median particle size and the proportion of masticate dry matter composing large and small particles differed between tall fescue and switchgrass with increasing maturity (Figure 7.2, Figure 7.3, Table 7.3). Median particle size decreased with increasing maturity, indicating a greater degree of chewing, which differed between tall fescue and switchgrass. The change in median particle size for tall fescue gave a linear decrease, whereas the proportion of small particles gave a linear increase (Figure 7.3). The proportion of large- and medium-sized particles gave little trend (significant lack of fit) with increasing maturity (Table 7.3). On the other hand, median particles and the proportion of large particles for switchgrass gave a cubic decline with maturity, whereas the proportion of medium and small particles gave a quadratic increase with maturity (Figure 7.3, Table 7.3).
The chewing behavior responses were similar between tall fescue and switchgrass for total chews per minute and per bolus, but minutes per bolus formation and manipulation were greater for switchgrass, as were chews per gram each of dry matter, in vitro dry matter disappearance, and neutral detergent fiber (Figure 7.4, Table 7.4). All chewing behavior measurements for tall fescue increased linearly with increased physiological maturity and were consistent with cell wall development. This was also noted for switchgrass, but responses were often quadratic, resulting from greater changes at the latter maturity stages (Figure 7.4, Table 7.4).
Summary and Conclusions
- Both Forager tall fescue and Kanlow switchgrass were readily consumed by beef steers.
- At the early vegetative stages, tall fescue and switchgrass were consumed similar by steers, averaging 2.54 pounds per 100 pounds of body weight.
- By the boot stage, tall fescue and switchgrass differed appreciably in nutritive value and quality, with dry matter intake of tall fescue averaging 2.51 pounds per 100 pounds of body weight compared with 1.05 for switchgrass.
- Shifts in nutritive value were also reflected in the masticate and chewing behavior characteristics, with greater chewing activity for switchgrass than tall fescue and for more mature hay than less mature hay.
- Nutritive value and quality of the as-fed hays differed between tall fescue and switchgrass at similar physiological stages of maturity.
| Treatment | DM (lb/100 lb body weight) |
CP (lb/100 lb body weight) |
NDF (lb/100 lb body weight) |
Fiber fractions1 | |||
|---|---|---|---|---|---|---|---|
| ADF (lb/100 lb body weight) |
HEMI (lb/100 lb body weight) |
CELL (lb/100 lb body weight) |
Lignin (lb/100 lb body weight) |
||||
| Tall Fescue (TF): | |||||||
| Vegetative (VT) | 2.542 | 0.56 | 1.47 | 0.74 | 0.73 | 0.64 | 0.07 |
| Boot (BT) | 2.51 | 0.46 | 1.52 | 0.76 | 0.75 | 0.65 | 0.09 |
| Headed (HD) | 1.35 | 0.12 | 1.00 | 0.58 | 0.42 | 0.47 | 0.10 |
| Switchgrass (SG): | |||||||
| Vegetative | 2.54 | 0.39 | 1.68 | 0.83 | 0.85 | 0.71 | 0.10 |
| Boot | 1.05 | 0.05 | 0.82 | 0.47 | 0.36 | 0.38 | 0.07 |
| Headed | 1.11 | 0.04 | 0.88 | 0.52 | 0.36 | 0.41 | 0.09 |
| Significance (P): | |||||||
| Treatment | <0.01 | <0.01 | 0.02 | 0.04 | <0.01 | 0.01 | 0.67 |
| TF vs. SG | 0.02 | <0.01 | 0.35 | 0.24 | 0.18 | 0.15 | 0.88 |
| VT vs. (BT+HD) | <0.01 | <0.01 | 0.01 | 0.02 | <0.01 | 0.01 | 0.96 |
| BT vs. HD | 0.03 | <0.01 | 0.21 | 0.45 | 0.04 | 0.28 | 0.28 |
| Interaction (TF & SG) by: | |||||||
| VT vs. (BT+HD) | 0.01 | 0.01 | 0.02 | 0.10 | <0.01 | 0.08 | 0.18 |
| BT vs. HD | 0.02 | <0.01 | 0.12 | 0.18 | 0.03 | 0.13 | 0.98 |
1 ADF = acid detergent fiber; HEMI = hemicellulose; CELL = cellulose. ↲
2 Each value is the mean of four steers. ↲
| Treatment | IVDMD (%) |
CP (%) |
NDF (%) |
Fiber Fractions1 | |||
|---|---|---|---|---|---|---|---|
| ADF (%) |
HEMI (%) |
CELL (%) |
LIGNIN (%) |
||||
| Tall Fescue (TF): | |||||||
| Vegetative (VT) | 68.42 | 22.0 | 58.3 | 29.5 | 28.8 | 25.0 | 3.0 |
| Boot (BT) | 66.0 | 18.4 | 60.6 | 30.5 | 30.1 | 25.9 | 3.5 |
| Headed (HD) | 39.6 | 9.4 | 72.5 | 42.1 | 30.5 | 33.6 | 7.6 |
| Switchgrass (SG): | |||||||
| Vegetative | 63.8 | 15.2 | 66.3 | 32.9 | 33.4 | 27.9 | 4.1 |
| Boot | 37.2 | 4.6 | 79.1 | 45.5 | 33.7 | 36.9 | 7.3 |
| Headed | 29.9 | 3.2 | 79.7 | 47.6 | 32.1 | 37.7 | 8.6 |
| Significance (P): | |||||||
| Treatment | <0.01 | <0.01 | <0.01 | <0.01 | <0.01 | <0.01 | <0.01 |
| TF vs. SG | <0.01 | <0.01 | <0.01 | <0.01 | <0.01 | <0.01 | <0.01 |
| VT vs. (BT+HD) | <0.01 | <0.01 | <0.01 | <0.01 | 0.02 | <0.01 | <0.01 |
| BT vs. HD | <0.01 | <0.01 | <0.01 | <0.01 | <0.01 | <0.01 | <0.01 |
| Interaction (TF & SG) by: | |||||||
| VT vs. (BT+HD) | <0.01 | <0.01 | <0.01 | <0.01 | <0.01 | <0.01 | <0.01 |
| BT vs. HD | <0.01 | <0.01 | <0.01 | <0.01 | <0.01 | <0.01 | <0.01 |
1 ADF = acid detergent fiber; HEMI = hemicellulose; CELL = cellulose. ↲
2 Each value is the mean of four samples. ↲
| Item | DM3 (%) |
Nutritive value1 | Particle size2 | |||||
|---|---|---|---|---|---|---|---|---|
| IVDMD (%) |
CP (%) |
NDF (%) |
Median (mm) |
Large (%) |
Medium (%) |
Small (%) |
||
| Treatment | <0.01 | <0.01 | <0.01 | <0.01 | <0.01 | <0.01 | <0.01 | <0.01 |
| TF vs. SG | <0.01 | <0.01 | <0.01 | <0.01 | <0.01 | <0.01 | 0.45 | <0.01 |
| Change with maturity (Trend4) | ||||||||
| TF | LOF | C | L | LOF | L | LOF | LOF | L |
| SG | Q | C | Q | Q | C | C | Q | Q |
| MSD5 | 2.3 | 2.4 | 2.2 | 2.1 | 0.2 | 8.0 | 5.5 | 5.4 |
1 IVDMD = in vitro dry matter disappearance; CP = crude protein; NDF = neutral detergent fiber. ↲
2 Large = ≥ 1.7 mm; Medium = <1.7 and ≥ 0.50 mm; Small = < 0.50 mm. ↲
3 DM = dry matter. ↲
4 L = linear; Q = quadratic; C = cubic; LOF = lack of fit or no evident trend. ↲
5 MSD = minimum significant difference from the Waller-Duncan k-ratio (k = 100) t-test and can be used to compare any two treatments in Figures 7.1, 7.2 and 7.3 as appropriate. ↲
| Item | Chews1 | Min (per bolus) |
||||
|---|---|---|---|---|---|---|
| Total (per min) |
Per Bolus (number) |
DM (per gram) |
IVDMD (per gram) |
NDF (per gram) |
||
| Treatment | <0.01 | <0.01 | <0.01 | <0.01 | <0.01 | <0.01 |
| TF vs. SG | 0.48 | 0.06 | <0.01 | <0.01 | <0.01 | 0.02 |
| Change with maturity (Trend3) | ||||||
| TF | L2 | L | L | L | L | L |
| SG | Q2 | L | Q | Q | Q | L |
| MSD3 | 3.9 | 4.6 | 2.1 | 4.3 | 2.8 | 0.06 |
1 DM = Dry matter; IVDMD = in vitro dry matter disappearance; NDF = neutral detergent fiber. ↲
2 L = linear; Q = quadratic. ↲
3 MSD = minimum significant difference from the Waller-Duncan k-ratio (k = 100)
t-test and can be used to compare any two treatments in Figure 7.4 ↲
Experiment 8. Maturity Changes in Initial Growth Switchgrass and Flaccidgrass: Nutritive Value and Quality
The initial growth among warm-season grasses can vary appreciably in physiological growth stage over similar time periods under the same environmental conditions. Our objective in this experiment was to compare the change in nutritive value and quality of flaccidgrass and switchgrass forages cut at an early and at a more advanced physiological development, but within a suitable growth stage for hay.
Material and Methods
Well established stands—one each of Kanlow switchgrass and a selection of flaccidgrass— served as the sources of the experimental hays. The two adjacent fields were burned in late February to remove carryover growth from the previous fall. The fields were subsequently top-dressed with 80 pounds of nitrogen per acre in early March in preparation for the production of the experimental hays. Two sequential harvests of each forage species were made of the initial growth. This resulted in four treatments described below:
-
Flaccidgrass: vegetative, cut May 16 (dry matter of 18%), mean height of 30 inches
-
Switchgrass: vegetative, cut May 23 (dry matter of 19%), mean height of 38 inches
-
Flaccidgrass: boot, cut June 4 (dry matter of 29%), mean height of 35 inches
-
Switchgrass: vegetative, cut June 6 (dry matter of 24%), mean height of 44 inches
These maturities of initial growth cover the period in which both switchgrass and flaccidgrass would be desirable sources of hay.
Each treatment was flail-chopped to about 5 inches. The forages were blown into a self-unloading wagon, transported to a bulk-drying barn located at the NC State University Forage-Animal Metabolism Unit in Raleigh (NC), unloaded, and forced-air dried overnight at 175 to 185°F to approximately 90% dry matter. The following day the hays were baled with a conventional square baler and the bales stored on wooden pallets in an experimental-hay storage barn at the NC State University Forage-Animal Metabolism Unit in Raleigh until fed. Because the hays had been flail-chopped (reduced to 3 to 6 inches), no further processing was needed prior to feeding (Appendix GP-1).
Four Angus steers of similar weight (mean = 535 ± 28 pounds) were used in a 4 × 4 Latin square design, and each was assigned at random to a treatment in period one. Intake and digestibility estimates were obtained by standard procedures (Appendix GP-2). During the digestibility phase, external markers were administered orally to obtain estimates of digesta kinetics and fecal output. Cobalt was used to obtain estimates of rate of passage and mean retention time of the liquid phase. Chromium, attached to the fiber, was used to estimate the solid phase rate of passage, mean retention time, total gastrointestinal tract fill (FILL), and fecal output (Appendix GP-6). Fecal samples were collected and sieved for particle size determination for each treatment (Appendix GP-5).
All as-fed hays and weighback samples were analyzed for nutritive value and fecal samples for chemical composition according to standard procedures (Appendix GP-7). The greater proportions of the sieved fecal particles were also analyzed for NDF. All data were analyzed statistically according to the experimental design (Appendix GP-8).
Results and Discussion
Flaccidgrass cut in the vegetative stage on May 16 was consumed at 2.65 pounds per 100 pounds of body weight with a dry matter digestibility of 64.2%. The hays contained enough crude protein to be of sufficient quality to support about 2 pounds per day gain for a 600-pound steer (Table 8.1). The comparable switchgrass, although adequate in dry matter digestibility and crude protein, produced dry matter intake of 2.23 pounds per 100 pounds of body weight, which would likely limit steer gains to about 1 pound per day. Overall, dry matter intake was greater for flaccidgrass than switchgrass, but digestibilities of dry matter and neutral detergent fiber and constituent fiber fractions were similar.
Delaying the cutting of both grasses approximately two weeks reduced dry matter intake, dry matter digestibility, and neutral detergent fiber digestions, as well as the digestibility of the constituent fiber fractions. It is noteworthy that dry matter intake of the May cut flaccidgrass hay was greater (t-value from least square means = 0.03) compared with the May cut switchgrass hay, and the difference approached significance (P = 0.06) between hays for the June cut.
Digestible intakes of dry matter and hemicellulose were greater for flaccidgrass compared with switchgrass, and digestible intakes of all variables, regardless of species, were reduced by delaying harvest (Table 8.1). Examination of the nutritive value of the as-fed hays reflected the steer performance data. With the exception of lignin, which was similar for flaccidgrass and switchgrass, the nutritive value of flaccidgrass was greater compared with switchgrass (Table 8.2). Further, delaying cutting of flaccidgrass reduced its nutritive value (lesser in vitro dry matter disappearance and crude protein and greater neutral detergent fiber and constituent fiber fractions) with the exception of hemicellulose, which was unchanged. Also with switchgrass, nutritive value declined by delaying harvest with the exception of hemicellulose, as noted for flaccidgrass.
The difference value (weighback concentration minus as-fed concentration) reflected some degree of selective consumption, with neutral detergent fiber being greater and in vitro dry matter disappearance and crude protein lesser. Generally, selectivity was greater for switchgrass than for flaccidgrass and selectivity increased from the May to the June harvests (Table 8.2).
Digesta kinetics were not greatly altered by either species or maturity. Only the mean retention time of the flaccidgrass was altered, being increased from 52 to 61 hours with increasing flaccidgrass maturity, and is consequently reflected in gastrointestinal fill being increased from 1.01 to 1.27 pounds per 100 pounds of body weight (Table 8.3).
Median particle size of the feces was not altered by the delay in harvest, but flaccidgrass had smaller particles compared with switchgrass (0.31 vs. 0.33 mm). Further, neutral detergent fiber concentration of the fecal dry matter of the less mature forages was lesser than that of the more mature forages—averaging 62.4% (less mature) and 68.7% (more mature) for the 0.50 mm sieve, 62.4% (less mature) and 68.0% (more mature) for the 0.25 mm sieve, and 55.5% (less mature) and 61.3% (more mature) for fecal dry matter < 0.25mm (Table 8.3). Estimated fecal output, determined by chromium, averaged greater compared with actual fecal output (0.80 vs. 0.67 pound per 100 pounds of body weight) and were related but not significantly correlated (r = 0.89; P = 0.11).
Summary and Conclusion
- Steers readily consumed all four hays.
- Dry matter intake of flaccidgrass was greater than that of switchgrass, whereas dry matter digestibility was similar between flaccidgrass and switchgrass.
- Digestible intakes revealed flaccidgrass to be consistently greater in quality than switchgrass, regardless of maturity.
- A cutting delay of several weeks during the stem elongation phase of these erect growing perennial grasses can have a major impact on nutritive value and consequently on hay quality.
| Date of Cut | Days of Growth | DMI (lb/100 lb2) |
Digestibilities1 | Digestible Intakes | ||||||||
|---|---|---|---|---|---|---|---|---|---|---|---|---|
| DM (%) |
NDF (%) |
ADF (%) |
HEMI (%) |
CELL (%) |
DM (lb/100 lb2) |
NDF (lb/100 lb2) |
ADF (lb/100 lb2) |
HEMI (lb/100 lb2) |
CELL (lb/100 lb2) |
|||
| Flaccidgrass (FG): | ||||||||||||
| May 16 | 0 | 2.653 | 64.2 | 66.7 | 62.0 | 72.0 | 72.6 | 1.70 | 1.16 | 0.54 | 0.63 | 0.51 |
| June 4 | 19 | 2.20 | 62.0 | 61.7 | 56.1 | 67.5 | 65.6 | 1.37 | 0.92 | 0.43 | 0.49 | 0.43 |
| Switchgrass (SG): | ||||||||||||
| May 23 | 0 | 2.23 | 65.4 | 67.5 | 63.7 | 71.8 | 73.5 | 1.48 | 1.05 | 0.50 | 0.54 | 0.50 |
| June 6 | 14 | 1.84 | 60.4 | 61.5 | 56.4 | 67.2 | 66.7 | 1.10 | 0.79 | 0.38 | 0.41 | 0.38 |
| Significance (P): | ||||||||||||
| Date of Cut | 0.01 | 0.04 | 0.05 | 0.03 | 0.05 | 0.02 | <0.01 | <0.01 | <0.01 | <0.01 | <0.01 | |
| FG vs. SG | 0.01 | 0.85 | 0.84 | 0.58 | 0.83 | 0.58 | 0.01 | 0.06 | 0.13 | 0.04 | 0.12 | |
| FG: May vs. June | 0.03 | 0.13 | 0.04 | 0.03 | 0.03 | 0.01 | 0.01 | 0.01 | 0.02 | 0.01 | 0.01 | |
| SG: May vs. June | 0.05 | 0.01 | 0.03 | 0.02 | 0.05 | 0.03 | <0.01 | 0.01 | <0.01 | 0.03 | 0.01 | |
1 NDF = neutral detergent fiber; ADF = acid detergent fiber; HEMI = hemicellulose; CELL = cellulose. ↲
2 Body weight basis. ↲
3 Each value is the mean of four steers. ↲
| Date of Cut | Days of Growth | IVDMD | CP | NDF | Fiber Fractions | ||||||
|---|---|---|---|---|---|---|---|---|---|---|---|
| AF (%) |
DV2 (%) |
AF (%) |
DV2 (%) |
AF (%) |
DV2 (%) |
ADF (%) |
HEMI (%) |
CELL (%) |
Lignin (%) |
||
| Flaccidgrass (FG): | |||||||||||
| May 16 | 0 | 64.43 | -2.8 | 16.0 | -0.8 | 65.9 | 0.6 | 33.2 | 32.7 | 28.6 | 3.9 |
| June 4 | 19 | 55.8 | -6.9 | 12.8 | -3.9 | 68.6 | 5.2 | 36.0 | 32.5 | 30.4 | 4.9 |
| Switchgrass (SG): | |||||||||||
| May 23 | 0 | 57.3 | -1.3 | 14.4 | -3.4 | 69.7 | 4.6 | 36.0 | 33.6 | 31.0 | 4.2 |
| June 6 | 14 | 50.2 | -4.7 | 10.4 | -4.4 | 71.7 | 7.1 | 38.2 | 33.5 | 32.2 | 4.8 |
| Significance (P): | |||||||||||
| Date of Cut: | <0.01 | 0.01 | <0.01 | <0.01 | <0.01 | <0.01 | <0.01 | 0.08 | <0.01 | <0.01 | |
| FG vs. SG | <0.01 | 0.08 | <0.01 | <0.01 | <0.01 | <0.01 | <0.01 | 0.02 | <0.01 | 0.21 | |
| FG: May vs. June | <0.01 | 0.01 | <0.01 | <0.01 | <0.01 | <0.01 | <0.01 | 0.73 | <0.01 | <0.01 | |
| SG: May vs. June | <0.01 | 0.03 | <0.01 | 0.09 | <0.01 | <0.01 | <0.01 | 0.80 | <0.01 | <0.01 | |
1 CP = crude protein; NDF = neutral detergent fiber; ADF = acid detergent fiber; HEMI = hemicellulose; CELL = cellulose. ↲
2 DV = difference value (weighback concentration minus AF concentration). ↲
3 Each value is the mean of four steers. ↲
| Date of Cut | Days of Growth | ROP | MRT | FILL (lb/100 lb2) |
Fecal Characteristics1 | ||||
|---|---|---|---|---|---|---|---|---|---|
| Liquid (% per hour) |
Solid (% per hour) |
Liquid (hours) |
Solid (hours) |
MPS (mm) |
Actual (lb/100 lb2) |
Predicted (lb/100 lb2) |
|||
| Flaccidgrass (FG): | |||||||||
| May 16 | 0 | 8.873 | 3.39 | 19.1 | 51.8 | 1.01 | 0.31 | 0.73 | 0.82 |
| June 4 | 19 | 9.31 | 2.86 | 20.2 | 60.9 | 1.27 | 0.30 | 0.72 | 0.87 |
| Switchgrass (SG): | |||||||||
| May 23 | 0 | 8.79 | 2.97 | 21.1 | 58.9 | 1.05 | 0.33 | 0.60 | 0.72 |
| June 6 | 14 | 8.25 | 2.94 | 22.9 | 62.1 | 1.11 | 0.34 | 0.63 | 0.78 |
| Significance (P): | |||||||||
| Date of Cut | 0.71 | 0.26 | 0.17 | 0.13 | 0.01 | 0.11 | 0.27 | 0.25 | |
| FG vs. SG | 0.41 | 0.42 | 0.08 | 0.21 | 0.13 | 0.03 | 0.06 | 0.08 | |
| FG: May vs. June | 0.64 | 0.09 | 0.50 | 0.05 | <0.01 | 0.70 | 0.84 | 0.46 | |
| SG: May vs. June | 0.60 | 0.94 | 0.32 | 0.50 | 0.32 | 0.51 | 0.73 | 0.37 | |
1 MPS = median particle size; Actual = fecal output measured during the five-day digestibility phase; Predicted = fecal output estimated by external marker. ↲
2 Body weight basis. ↲
3 Each value is the mean of four steers. ↲
Experiment 9. Increasing Maturity of Flaccidgrass: Nutritive Value and Quality
As forage grasses grow from the vegetative through heading stages, their dry matter yield increases, but at the expense of nutritive value. Generally, crude protein concentration declines with maturity and neutral detergent fiber concentration increases, resulting in reduced forage quality. Reduced forage quality is generally reflected in reduced daily animal performance (as measured by weight gain, milk production, and other attributes). Our objective in this experiment was to determine the change in steer dry matter intake, dry matter digestibility, and masticate characteristics of flaccidgrass hay when cut over a range of maturities—starting at the vegetative stage and continuing through heading.
Materials and Methods
A well-established stand of flaccidgrass provided the experimental hays. The field was burned in late February to remove all fall carryover growth. The stand was top-dressed with 80 pounds of nitrogen per acre in late March in preparation for the production of the experimental hays. Five maturity treatments of initial growth were obtained, ranging from the late vegetative stage through fully headed as follows:
- Cut May 18 (20.2% dry matter)
- Cut June 5 (22.6% dry matter)
- Cut June 19 (28.6% dry matter)
- Cut July 3 (29.8% dry matter)
- Cut July 16 (22.3% dry matter)
These treatments cover the period in which major changes in nutritive value occur. For purposes of determining change, the first cut taken on May 18 represents day 0, June 5 day 18, June 19 day 32, July 3 day 46, and July 16 day 59. Forages in all treatments were cut with a flail chopper to a 5-inch stubble, blown into a self-unloading wagon, transported, and unloaded into the bulk-barn forage dryer at the NC State University Forage-Animal Metabolism Unit in Raleigh, NC. The forages were dried overnight by forced air with the inlet temperature set at 185°F.
After drying, the forages were baled directly out of the dryer in a conventional square baler and the bales stored on wooden pallets in the experimental hay barn at the Forage-Animal Metabolism Unit until fed. Because the forage was flail-chopped and reduced into 3- to 6-inch lengths, no further processing occurred prior to feeding (Appendix GP-1).
Two experiments were conducted, consisting of an intake and digestibility experiment (Experiment 9A) and a mastication experiment (Experiment 9B). In Experiment 9A, five Angus steers of similar weight (mean = 487 ± 22 pounds) were used in a 5 × 5 Latin square design and assigned at random to each treatment in period one. Steers were fed at an actual average ad libitum intake of 114.9% during the intake phase. Intake and digestibility estimates were obtained by standard procedures (Appendix GP-2).
In Experiment 9B, masticate samples of the as-fed hays were obtained using mature, esophageally cannulated Angus steers. The collected boluses were freeze-dried and split, with one part used for chemical analyses and the other part sieved for particle size determination. Fecal samples were also sieved, and median particle size and particle-size classes determined (Appendix GP-3 and GP-5). The as-fed hays, weighbacks, and masticate samples were analyzed for nutritive value and fecal samples for chemical composition according to standard procedures (Appendix GP-7). All data were analyzed statistically according to the experimental design (Appendix GP-8).
Results and Discussion
Experiment 9A
Dry matter intake by steers declined appreciably from day 0 (beginning with the May 18 cut) through day 32, then decreased less through day 59, resulting in a quadratic response (Table 9.1). This general trend was noted for dry matter and neutral detergent fiber digestibilities as well as for the other fiber fractions. The strong decline in quality from day 0 through day 46 is evident by the strong linear component, but the change from day 32 through 59 was more variable, leading to the quadratic response with the cubic component evident on occasion. This same response occurred for the digestible intakes of dry matter and fiber fractions.
While the data in Table 9.1 provide incremental changes in steer responses, it would be useful to estimate steer responses and changes in nutritive value for any day during the 59-day growth period. This can be achieved by using a prediction equation of the form Y = a + b1X + b2X2. Here Y is the value for the variable of interest, a is the intercept, b1 and b2 are the coefficients representing linear and quadratic components, and X is the day (from 0 to 59) from the May 18 to July 16 cut (Table 9.2). For example, for day 35 (35 days after the May 18 cut), the equation to estimate dry matter intake would be Y = 2.62 (-0.047 × 35) + [0.00045 × (35)2)] or dry matter intake (Y) = 1.53 pounds per 100 pounds of body weight.
The in vitro dry matter disappearance of the as-fed hays was reduced quadratically with increasing maturity and reflected dry matter intake, dry matter digestibility, and associated responses (Table 9.1). Declines in crude protein and increases in neutral detergent fiber and its fiber constituents are strong until day 32 to 46, depending on the variable, giving quadratic responses. Changes from day 32 to 59 were more variable, giving significant cubic trends or lack of fit, indicating no evident trend.
Examination of the difference values (weighback concentration minus as-fed concentration) indicates that some degree of selectivity occurred with weighback being greater in neutral detergent fiber and lesser in in vitro dry matter disappearance and crude protein. The degree of selectivity among treatments, however, was somewhat variable with overall cubic trends noted for each (Table 9.3).
Experiment 9B
The whole masticate in vitro dry matter disappearance decreased and neutral detergent fiber concentrations increased quadratically with increasing hay maturity and consistent with dry matter intake and dry matter digestibility responses by steers (Table 9.4 and Figure 9.1). The whole masticate median particle size also decreased with advancing maturity and supports a likely increase in chewing behavior. This is also reflected in the masticate particle-size distribution (Figure 9.2), resulting in a linear decrease in the proportion of masticate dry matter composed of large particles and the linear increase (approaching significance) in small particles (Table 9.4). Fecal particle-size distribution was altered (Figure 9.2), but median particle size was not altered by flaccidgrass maturity, averaging 0.22 mm for all treatments (Table 9.4).
Summary and Conclusions
- Steers readily consumed flaccidgrass hays of all maturities.
- Flaccidgrass hay in the late vegetative stage had very acceptable quality when well fertilized, having steer intakes of 2.63 pounds per 100 pounds of body weight with a dry matter digestibility of 65.1% and crude protein of 19.4%.
- At the onset of late boot and emergence of heads, hay nutritive value decreased rapidly and, subsequently, its quality decreased as well.
- Flaccidgrass forage to be conserved as hay should be cut by early boot stage for growing or producing ruminants. Later cuts, which may favor increased dry matter production, may be acceptable for mature animals at maintenance.
| Date of Cut | Days of Growth2 | DMI (lb/100 lb3) |
Digestibilities1 | Digestible Intakes | ||||||||
|---|---|---|---|---|---|---|---|---|---|---|---|---|
| DM (%) |
NDF (%) |
ADF (%) |
HEMI (%) |
CELL (%) |
DM (lb/100 lb3) |
NDF (lb/100 lb3) |
ADF (lb/100 lb3) |
HEMI (lb/100 lb3) |
CELL (lb/100 lb3) |
|||
| May 18 | 0 | 2.634 | 65.1 | 68.6 | 62.7 | 75.8 | 74.6 | 1.71 | 1.17 | 0.58 | 0.60 | 0.57 |
| June 5 | 18 | 1.97 | 58.3 | 59.5 | 53.9 | 66.7 | 64.0 | 1.15 | 0.85 | 0.43 | 0.42 | 0.42 |
| June 19 | 32 | 1.51 | 52.0 | 51.2 | 45.6 | 59.5 | 53.5 | 0.78 | 0.57 | 0.30 | 0.28 | 0.27 |
| July 3 | 46 | 1.38 | 44.5 | 44.3 | 37.6 | 54.3 | 46.4 | 0.62 | 0.48 | 0.24 | 0.24 | 0.23 |
| July 16 | 59 | 1.44 | 46.9 | 47.5 | 42.2 | 55.3 | 51.2 | 0.68 | 0.58 | 0.30 | 0.27 | 0.29 |
| Significance (P): | ||||||||||||
| Date of Cut | <0.01 | <0.01 | <0.01 | <0.01 | <0.01 | <0.01 | <0.01 | <0.01 | <0.01 | <0.01 | <0.01 | |
| Linear | <0.01 | <0.01 | <0.01 | <0.01 | <0.01 | <0.01 | <0.01 | <0.01 | <0.01 | <0.01 | <0.01 | |
| Quadratic | <0.01 | <0.01 | <0.01 | <0.01 | <0.01 | <0.01 | <0.01 | <0.01 | <0.01 | <0.01 | <0.01 | |
| Cubic | 0.89 | 0.04 | 0.06 | 0.04 | 0.34 | 0.04 | 0.82 | 0.15 | 0.08 | 0.46 | 0.02 | |
| Lack of Fit | 0.55 | 0.24 | 0.48 | 0.37 | 0.75 | 0.72 | 0.89 | 0.65 | 0.74 | 0.59 | 0.22 | |
1 NDF = neutral detergent fiber; ADF = acid detergent fiber; HEMI = hemicellulose; CELL = cellulose. ↲
2 After May 18. ↲
3 Body weight basis. ↲
4 Each value is the mean of five steers. ↲
| Variable | Intercept (a) | Component1 | R2 | |
|---|---|---|---|---|
| Linear (b1) | Quadratic (b2) | |||
| In vivo response | ||||
| Intake (lb/100 lb body weight) | ||||
| Dry Matter (DM) | 2.62 | -0.047 | 0.00045 | 0.99 |
| Digestible DM | 1.73 | -0.041 | 0.00038 | 0.99 |
| Digestibility (%) | ||||
| DM | 64.5 | -0.347 | - | 0.91 |
| CP | 64.8 | -0.355 | - | 0.96 |
| NDF | 67.1 | -0.403 | - | 0.89 |
| ADF | 61.3 | -0.404 | - | 0.87 |
| Hemicellulose | 74.1 | 0.369 | - | 0.91 |
| Cellulose | 72.3 | -0.450 | - | 0.85 |
| Constituents of digestible intake (lb/100 lb body weight) | ||||
| CP | 0.33 | 0.011 | 0.00011 | 0.99 |
| NDF | 1.07 | -0.011 | - | 0.85 |
| ADF | 0.53 | -0.005 | - | 0.85 |
| Hemicellulose | 0.61 | -0.014 | 0.00013 | 0.98 |
| Cellulose | 0.52 | -0.005 | - | 0.84 |
| Nutritive Value | ||||
| 48-hr DM disappearance | 69.3 | -1.069 | 0.996 | 0.99 |
| NDF concentration | 67.3 | 0.219 | - | 0.87 |
1 The greatest significant (P < 0.05) component for the equation is given. ↲
| Date of Cut | Days of Growth | IVDMD | CP | NDF | Fiber Fractions | ||||||
|---|---|---|---|---|---|---|---|---|---|---|---|
| AF (%) |
DV2 (%) |
AF (%) |
DV (%) |
AF (%) |
DV (%) |
ADF (%) |
HEMI (%) |
CELL (%) |
Lignin (%) |
||
| May 18 | 0 | 68.53 | -3.5 | 19.4 | -2.9 | 65.3 | 3.1 | 35.3 | 29.9 | 29.3 | 4.9 |
| June 5 | 18 | 53.8 | -10.7 | 12.4 | -5.7 | 74.0 | 7.9 | 42.5 | 31.5 | 34.9 | 6.7 |
| June 19 | 32 | 46.2 | -11.4 | 11.1 | -4.4 | 75.5 | 6.3 | 44.5 | 30.9 | 35.3 | 8.2 |
| July 3 | 46 | 40.0 | -8.3 | 9.3 | -3.1 | 78.3 | 4.1 | 47.2 | 31.1 | 36.8 | 9.1 |
| July 16 | 59 | 42.4 | -14.5 | 9.8 | -5.3 | 78.7 | 7.1 | 46.9 | 31.8 | 36.8 | 8.9 |
| Significance (P): | |||||||||||
| Date of Cut | <0.01 | <0.01 | <0.01 | <0.01 | <0.01 | <0.01 | <0.01 | 0.02 | <0.01 | <0.01 | |
| Linear | <0.01 | <0.01 | <0.01 | 0.22 | <0.01 | 0.03 | <0.01 | <0.01 | <0.01 | <0.01 | |
| Quadratic | <0.01 | 0.18 | <0.01 | 0.46 | <0.01 | 0.05 | <0.01 | 0.41 | <0.01 | <0.01 | |
| Cubic | 0.47 | <0.01 | <0.01 | <0.01 | <0.01 | <0.01 | 0.15 | 0.02 | <0.01 | 0.28 | |
| Lack of Fit | 0.03 | 0.22 | <0.01 | 0.91 | <0.01 | 0.95 | 0.03 | 0.25 | <0.01 | 0.77 | |
1 CP = crude protein; NDF = neutral detergent fiber; ADF = acid detergent fiber; HEMI = hemicellulose; CELL = cellulose. ↲
2 DV = difference value (weighback concentration minus AF concentration). ↲
3 Each value is the mean of five steers. ↲
| Date of Cut | Days of Growth | Whole Masticate | Feces | |||||
|---|---|---|---|---|---|---|---|---|
| Nutritive Value1 | MPS (mm) |
Particle-size Class2 | MPS (mm) |
|||||
| IVDMD (%) |
NDF (%) |
Large (%) |
Medium (%) |
Small (%) |
||||
| May 18 | 0 | 68.53 | 63.43 | 1.343 | 35.53 | 51.63 | 12.93 | 0.274 |
| June 5 | 18 | - | - | - | - | - | - | 0.29 |
| June 19 | 32 | 51.2 | 73.8 | 1.15 | 27.7 | 55.5 | 16.9 | 0.29 |
| July 3 | 46 | - | - | - | - | - | - | 0.29 |
| July 16 | 59 | 48.3 | 76.8 | 1.05 | 23.4 | 55.7 | 20.9 | 0.27 |
| Significance (P): | ||||||||
| Date of Cut | <0.01 | <0.01 | 0.10 | 0.08 | 0.02 | 0.13 | 0.53 | |
| Linear | <0.01 | <0.01 | 0.05 | 0.04 | 0.01 | 0.07 | 0.99 | |
| Quadratic | <0.01 | <0.01 | 0.52 | 0.51 | 0.05 | 0.99 | 0.12 | |
| Cubic | NA5 | NA | NA | NA | NA | NA | 0.49 | |
| Lack of Fit | NA | NA | NA | NA | NA | NA | 0.52 | |
1 IVDMD = in vitro dry matter disappearance; NDF = neutral detergent fiber. ↲
2 Large = ≥ 1.7 mm; Medium = < 1.7 and ≥ 0.5 mm; Small = < 0.5 mm. ↲
3 Each value is the average of four samples and the mean of three steers. ↲
4 Each value is the mean of five steers. ↲
5 NA = not applicable. ↲
Experiment 10. Advancing Maturity of Switchgrass and Flaccidgrass: Trends in Nutritive Value and Quality when Fed Fresh Daily
When evaluating maturity effects on the quality of forages, harvests are generally at discrete times representing different stages of maturity. Quality, however, changes slowly upon daily advancement in physiological maturity. Our objective in this experiment was to determine short-time changes in the nutritive value and quality of switchgrass (an erect, heavy-stemmed, tall-growing grass) and flaccidgrass (an erect, finer-stemmed, shorter-growing grass) when transitioning from vegetative to heading stages.
Materials and Methods
Two well-established fields—one each of Kanlow switchgrass and a selection of flaccidgrass—provided the experimental forages. The experiment was conducted for two years with modifications required the second year relative to growing conditions, and consequently the two years are reported separately. In both years the fall carry-over growth was burned off in mid-February. The fields were top-dressed with 80 pounds of nitrogen per acre in early March in preparation for the growth of the experimental forages.
The forages were cut beginning May 13 the first year (Experiment 10A) when both were vegetative and at about the same height, averaging 2.6 feet for switchgrass and 2.5 feet for flaccidgrass. In year two (Experiment 10B), the forages were cut beginning May 16 when both were vegetative and the height averaged 3.2 feet for switchgrass and 3.3 feet for flaccidgrass. About 150 pounds of green forage were cut over a three- to four-day interval with a small-plot flail chopper set to leave a 5-inch stubble. The forage was placed into plastic bags and stored by cut in a freezer until fed. The date of cut, stage of maturity at cut, and the interval between cuts are presented in Table 10.1 for both Experiment 10A (Year 1) and Experiment 10B (Year 2).
The two intake and digestibility experiments were conducted with crossbred wether sheep. Eight sheep of similar weight within each experiment (Experiment 10A: mean = 82 pounds ±11 pounds; Experiment 10B: mean = 75 pounds ± 11 pounds) were randomly assigned to the two forage treatments within each experiment in a completely random design. Once assigned, each animal remained on that treatment for the duration of the experiment. Estimates of dry matter intake and digestibility were conducted according to standard procedures (Appendix GP-2), but data were corrected for ash and expressed on an organic matter basis. A special feature of these two experiments, and a departure from standard procedures, was the feeding interval used.
Forage from each cut was fed to animals for three days with fecal collections occurring on days two, three, and four. On day four, feeding of the next cut was initiated, and this series was repeated for the duration of the experiment. The animal response data were averaged for two consecutive cuts, resulting in six to seven feeding days composing each value reported.
All as-fed samples were composited for the four animals on each treatment for each cut. Individual weighback and fecal samples were obtained for each animal. Both as-fed and weighback samples were analyzed for nutritive value and fecal samples for chemical composition according to standard procedures (Appendix GP-7). All nutritive value estimates reported are also the mean of two consecutive cuts and consistent with the animal response data. Estimates of standard errors are included in the figure captions for the animal responses that had individual animal measurements for each treatment-cut combination.
Results and Discussion
Flaccidgrass, a shorter growing grass than switchgrass, matured more rapidly. When the experiments were initiated, flaccidgrass was in or approaching the boot-stage, occurring on May 13 in Experiment 10A and May 16 in Experiment 10B (Table 10.1). It was only two cuts later when flaccidgrass showed heading, whereas switchgrass remained vegetative into July of both experiments.
The changes in nutritive value and organic matter digestibility, intake, and digestible organic matter intake with advancing maturity through 100% heading for both forage species are presented in Figure 10.1 (Experiment 10A) and Figure 10.2 (Experiment 10B). A noted decline in all these variables was evident as the grass approached and entered the heading stage, which is consistent with expectations.
In general, the in vitro organic matter disappearance and the other nutritive value variables reflect plant maturation—with in vitro organic matter disappearance and crude protein declining and neutral detergent fiber and its constituent fractions increasing. The crude protein concentration was already on the limited side when the experiment was initiated, and the decline would further affect forage quality. It is worthy of note that both grasses, while greatly different in morphology and leaf/stem characteristics, have similar trends when reaching common stages of physiological development. Flaccidgrass moves toward fully headed much quicker than switchgrass, but both grasses have the same general nutritive value and subsequent quality responses as they cross similar maturity stages.
Summary and Conclusions
- The nutritive value of both switchgrass and flaccidgrass decreased with increasing physiological maturity.
- The reduction in nutritive value with advancing maturity of both switchgrass and flaccidgrass was reflected in reduced forage quality.
- Although flaccidgrass reached the heading stage more rapidly than switchgrass, both forages changed similarly in nutritive value and quality as they passed through similar stages of physiological development.
- Both switchgrass and flaccidgrass, upright growing species, can contribute to animal production systems as pasture or hay but require attention to desirable management practices relative to the desirable forage quality.
| Experiment 10A | |||||
|---|---|---|---|---|---|
| Cut | Stage1 | Days | |||
| Date | No. | SG | FG | Int.2 | Total |
| May 13 | 1 | V | V | - | 0 |
| May 21 | 2 | V | V | 8 | 8 |
| May 25 | 3 | V | 25H | 4 | 12 |
| May 28 | 4 | V | 40H | 3 | 15 |
| June 1 | 5 | V | 75H | 4 | 19 |
| June 5 | 6 | V | 95H | 4 | 23 |
| June 8 | 7 | V | 100H | 3 | 26 |
| June 11 | 8 | V | 100H | 3 | 29 |
| June 15 | 9 | V | 100H | 4 | 33 |
| June 18 | 10 | V | 100H | 3 | 36 |
| June 22 | 11 | V | 100H | 4 | 40 |
| June 25 | 12 | V | 100H | 3 | 43 |
| June 29 | 13 | V | - | 4 | 47 |
| July 2 | 14 | V | - | 3 | 50 |
| July 6 | 15 | V | - | 4 | 54 |
| July 9 | 16 | 10H | - | 3 | 57 |
| July 13 | 17 | 25H | - | 4 | 61 |
| July 16 | 18 | 50H | - | 3 | 64 |
| Experiment 10B | |||||
|---|---|---|---|---|---|
| Cut | Stage | Days | |||
| Date | No. | SG | FG | Int. | Total |
| May 16 | 1 | V | V | - | 0 |
| May 19 | 2 | V | 5H | 3 | 3 |
| May 23 | 3 | V | 20H | 4 | 7 |
| May 26 | 4 | V | 30H | 3 | 10 |
| May 30 | 5 | V | 40H | 4 | 14 |
| June 2 | 6 | V | 50H | 3 | 17 |
| June 6 | 7 | V | 80H | 4 | 21 |
| June 9 | 8 | V | 95H | 3 | 24 |
| June 13 | 9 | V | 100H | 4 | 28 |
| June 16 | 10 | V | 100H | 3 | 31 |
| June 20 | 11 | V | 100H | 4 | 35 |
| June 23 | 12 | V | 100H | 3 | 38 |
| June 27 | 13 | V | 100H | 4 | 42 |
| June 30 | 14 | V | 100H | 3 | 45 |
| July 5 | 15 | V | - | 5 | 50 |
| July 7 | 16 | V | - | 2 | 52 |
| July 11 | 17 | V | - | 4 | 56 |
| July 14 | 18 | V | - | 3 | 59 |
| July 19 | 19 | V | - | 5 | 64 |
| July 21 | 20 | V | - | 2 | 66 |
| July 25 | 21 | V | - | 4 | 70 |
| July 28 | 22 | 5H | - | 3 | 73 |
| Aug 1 | 23 | 30H | - | 4 | 77 |
| Aug 4 | 24 | 100H | - | 3 | 80 |
| Aug 8 | 25 | 100H | - | 4 | 84 |
1 V = vegetative; H = headed; numeric prefix designates percent headed, i.e. 50H is read as 50% headed. ↲
2 Int. = interval between cuts. ↲
Experiment 11. Initial and Regrowth Flaccidgrass and Switchgrass: Nutritive Value and Quality
The physiological growth stages of flaccidgrass and switchgrass and their regrowth responses vary considerably. For example, when switchgrass elongates sufficient to elevate the growing point above the stubble when cut, regrowth must generate from dormant buds. Cutting switchgrass in June will often result in a two-week or more delay in the initiation of the subsequent regrowth. Thereafter, regrowth moves quickly through stem elongation, the boot-stage, and into full head. Flaccidgrass demonstrates a more uniform growth and regrowth response.
Our objective in this study was to compare hays of initial growth and regrowth of flaccidgrass and switchgrass cut on the same date, with their regrowth occurring over a similar growth period.
Materials and Methods
Well-established stands of flaccidgrass (selected germplasm) and Kanlow switchgrass provided the experimental hays. The fields were burned in late February to remove all fall carryover growth and top-dressed in mid-March with 60 pounds of nitrogen per acre and again in mid-April with 80 pounds per acre. The forages were cut with a mower-conditioner set to leave a 4-inch stubble. The initial growths of both hays were cut when heading (June 15), and each field was top-dressed with 100 pounds of nitrogen per acre. The regrowth of flaccidgrass was cut July 27, and the regrowth of switchgrass was cut August 25, resulting in the following four hays for evaluation:
Flaccidgrass:
- Initial growth, cut June 15, heads emerging
- Regrowth (45 days), cut July 27, 15% heading
Switchgrass:
- Initial growth, cut June 15, heads emerging
- Regrowth (74 days), cut August 25, 90% heading
The delayed cutting of the switchgrass regrowth was related to the time interval for basal buds to break dormancy and to initiate regrowth. The regrowth hay of flaccidgrass received 0.5 inches of rain during the nights of day 1 and day 2 after cutting. The hays were turned the following day with a side-delivery rake to aid drying. All hays were field cured, baled with a conventional square baler, and stored on wooden pallets in an experimental hay barn at the NC State University Forage-Metabolism unit, Raleigh, NC, until fed. At feeding, hays were processed according to standard procedures (Appendix GP-1).
The hays were evaluated for dry matter intake and digestibility using steers in a 4 × 4 Latin square design with two squares. Ten steers were standardized, two groups of four steers were selected based on weight, and the four steers within each group were randomly assigned to the four hay treatments within each square. The intake and digestibility experiment was conducted according to standard procedures (Appendix GP-2).
All as-fed and weighback samples were analyzed for nutritive value and fecal samples for chemical composition according to standard procedures (Appendix GP-7). All data were analyzed statistically according to the experimental design (Appendix GP-8).
Results and Discussion
Steers consumed regrowth flaccidgrass greater than initial growth, but consumed initial growth switchgrass greater than regrowth switchgrass (Table 11.1). However, dry matter digestibility, although from a limited number of steers (two per treatment), indicated no differences among the four hays, averaging 60.5% (Table 11.1). In the case of flaccidgrass, the regrowth hay had greater concentrations of crude protein than initial growth, consistent with greater dry matter intake. The switchgrass initial and regrowth hays differed, with initial growth greater in in vitro dry matter disappearance than regrowth and consistent with greater dry matter intake.
A comparison of the initial growth data for both forages reveals that switchgrass was consumed in greater amounts. The as-fed switchgrass initial-growth hay was greater in in vitro dry matter disappearance but lesser in crude protein and lignin compared with initial growth flaccidgrass. Some selective consumption among the hays, as noted by the difference values (concentration of weighback minus concentration of as-fed), appeared to occur. The difference values were similar among hays, except for the initial growth hays, for which the difference values were greater for flaccidgrass than for switchgrass (Table 11.1).
Summary and Conclusions
- Both flaccidgrass and switchgrass were readily consumed.
- Initial growth flaccidgrass, when headed, was consumed in lesser amounts compared with switchgrass with heads showing.
-
Regrowth of switchgrass, although finer stemmed compared to initial growth, progressed more rapidly through the growth stages than did its initial growth.
-
Flaccidgrass regrowth headed at a much shorter height than did its initial growth.
-
Regrowth flaccidgrass progressed through physiological growth stages slower than did switchgrass.
-
Any one of the hays can make a contribution to a beef cattle production system in the Upper South.
| Treatment | DMI (lb/100 lb) |
DMD (%) |
IVDMD | CP | NDF | Fiber Fractions | ||||||
|---|---|---|---|---|---|---|---|---|---|---|---|---|
| AF3 (%) |
DV3 (%) |
AF (%) |
DV (%) |
AF (%) |
DV (%) |
ADF (%) |
HEMI (%) |
CELL (%) |
Lignin (%) |
|||
| Flaccidgrass (FG): | ||||||||||||
| Initial growth (IG) | 1.754 | 60.35 | 55.36 | -4.46 | 12.16 | -2.56 | 73.96 | 1.76 | 41.76 | 32.26 | 33.66 | 7.86 |
| Regrowth (RG) | 2.26 | 60.8 | 57.4 | -1.9 | 13.8 | -1.0 | 74.4 | 0.2 | 41.8 | 32.6 | 32.4 | 8.7 |
| Switchgrass (SG): | ||||||||||||
| Initial growth (IG) | 2.03 | 62.7 | 58.5 | -0.7 | 10.3 | -0.5 | 75.2 | 1.7 | 40.4 | 34.8 | 33.6 | 6.0 |
| Regrowth (RG) | 1.93 | 58.4 | 52.7 | -1.9 | 10.1 | -1.9 | 73.8 | 2.3 | 39.6 | 34.2 | 32.6 | 5.9 |
| Significance (P): | ||||||||||||
| Treatment | <0.01 | 0.40 | 0.01 | 0.28 | <0.01 | 0.17 | 0.57 | 0.47 | 0.23 | 0.09 | 0.19 | 0.01 |
| FG: IG vs. RG | <0.01 | 0.82 | 0.15 | 0.19 | <0.01 | 0.12 | 0.66 | 0.30 | 0.95 | 0.68 | 0.09 | 0.16 |
| SG: IG vs. RG | 0.06 | 0.14 | <0.01 | 0.52 | 0.52 | 0.14 | 0.24 | 0.67 | 0.49 | 0.57 | 0.16 | 0.85 |
| IG: FG vs. SG | <0.01 | 0.35 | 0.04 | 0.07 | <0.01 | 0.05 | 0.26 | 0.97 | 0.27 | 0.03 | 0.98 | 0.02 |
1 IVDMD = in vitro dry matter disappearance; CP = crude protein; NDF = neutral detergent fiber; ADF = acid detergent fiber; HEMI = hemicellulose; CELL = cellulose. ↲
2 DMI presented on an as-fed DM basis and DMD and nutritive value on an oven DM basis. ↲
3 AF = as-fed and DV = difference value (weighback concentration minus AF concentration). ↲
4 Each value is the mean of four steers. ↲
5 Each value is the mean of two steers. ↲
6 Values are the average of two samples and the mean of four steers. ↲
Experiment 12. Initial-Growth Flaccidgrass Cut after Heading: Changes in Nutritive Value and Quality
Perennial warm-season grasses continue to increase in dry matter production during the late boot to fully headed stages. The degree to which these physiological changes influence the nutritive value of the forage for use as a hay crop must be considered. Flaccidgrass has potential as a hay crop in the Upper South. Its survival in pure stand would be enhanced through less frequent cutting, but its nutritive value may be appreciably reduced if cutting is delayed beyond the early boot stage. In this experiment, we evaluated the change in flaccidgrass nutritive value and quality when maturity advances from late boot stage through to seed set.
Materials and Methods
A well-established stand of flaccidgrass provided the experimental hay. The field was burned in late February to remove fall carryover growth. The field was subsequently top-dressed with 70 pounds of nitrogen per acre in late March in preparation for the production of the experimental hays. Three maturities were evaluated and consisted of the following:
- Late boot to early heading, cut June 7
- Approximately 50% anthesis, cut June 21
- Seeds forming, cut July 7
Each treatment was cut to a 4-inch stubble with a conventional mower conditioner, windrowed when dry (about 88% dry matter), and baled with a conventional square baler. The bales were transported to the experimental-hay storage barn at the NC State University Forage-Animal Metabolism Unit in Raleigh, NC, and stored on wooden pallets until processed according to standard procedures (Appendix GP-1) prior to feeding.
Two experiments were conducted. One experiment (Experiment 12A) was designed to determine dry matter intake and digestibility and the other (Experiment 12B) masticate characteristics. In Experiment 12A two 3 × 3 Latin square designs were used. Three Angus steers of similar weight were used in each square (mean = 698 ± 28.8 pounds in square I and mean = 507 ± 75 pounds in square II) and assigned at random to each treatment in period one of each square. Intake and digestibility estimates were obtained by standard procedures (Appendix GP-2).
In Experiment 12B, masticate samples of the as-fed hays were obtained using mature, esophageally cannulated Angus steers, and the collected boluses were freeze-dried and used for chemical analyses and for particle size determination (Appendix GP-3 and GP-5).
The as-fed hays, weighback, and masticate samples were analyzed for nutritive value and fecal samples for chemical composition according to standard procedures (Appendix GP-7). All data were analyzed statistically according to the experimental design (Appendix GP-8).
Results and Discussion
Experiment 12A
Delaying cutting of flaccidgrass forage from June 7 to July 5 resulted in a significant lack of fit or a quadratic decline in dry matter intake—from 1.89 to 1.22 pounds per 100 pounds of body weight. Associated was a quadratic decrease in dry matter digestibility—from 65.3% to 51.1% (Table 12.1). The decrease in both dry matter intake and dry matter digestibility from June 22 to July 5 was lesser than the initial decrease, resulting in the quadratic response. The apparent digestibilities of neutral detergent fiber and its fiber constituents gave a linear decline, except for acid detergent fiber, which was quadratic. The lesser decline in hay quality between the June 22 and July 5 cuts was also evident for the digestible intake of dry matter and neutral detergent fiber and its fiber constituents.
The as-fed forage reflected steer dry matter intake and dry matter digestibility, with quadratic (significant lack of fit) declines with increasing maturity in in vitro dry matter disappearance and crude protein but a quadratic increase in neutral detergent fiber and its constituent fiber fractions (Table 12.2). The noted exception was hemicellulose, which declined linearly. Some degree of selectivity was evident, with difference values (concentration of weighback minus concentration of as-fed) being greater for neutral detergent fiber and lesser for in vitro dry matter disappearance and crude protein in the weighback.
Although difference values for in vitro dry matter disappearance were not altered by maturity, they declined linearly for neutral detergent fiber and approached significance for crude protein.
Digesta kinetics, giving rate of passage and retention time of liquid and solid phases, generally reflected the decline noted in dry matter intake (Table 12.3, cobalt-chromium data) with the forage’s increasing maturity. Rate of passage of the liquid phase declined quadratically and mean retention time increased, whereas rate of passage for the solid phase declined, but not significantly, and mean retention time increased linearly.
The prediction of fecal output and subsequent dry matter intake can be compared with actual estimates (Table 12.3). Fecal output and subsequent dry matter intake predicted by chromium gave a quadratic response, declining at the June 22 cut then increasing for the July 5 cut. Actual fecal output, however, was not altered by treatments, averaging 0.52 pounds per 100 pounds of body weight, whereas dry matter intake decreased quadratically as noted for predicted values.
When ytterbium was used as the solid-phase marker, rate of passage and mean retention time both gave quadratic responses, with rate of passage declining and mean retention time increasing with maturity (Table 12.3, ytterbium data). Predicted fecal output was not found to be altered by maturity, whereas predicted dry matter intake declined linearly. The predicted values from ytterbium were consistently greater compared with the actual estimates (Table 12.3).
The association between predicted and actual fecal output and between predicted and actual dry matter intake was r = 0.96 (P < 0.01) and r = 0.33 (P = 0.52), respectively, for chromium, and r = 0.91 (P <0.01) and r = 0.27 (P = 0.61), respectively, for ytterbium. This indicates that chromium might be the better choice as a marker to determine estimates of fecal output and dry matter intake.
Fecal characteristics indicate that median particle size decreased linearly with increasing forage maturity (Table 12.4). This is consistent with increased chewing as forage matured being reflected in particle-size distributions (Figure 12.1). The composition of the feces also reflected maturity changes in the forage: Crude protein declined and neutral detergent fiber and its constituent acid detergent fiber and lignin increased quadratically as cutting was delayed (Table 12.5).
Experiment 12B
Examination of masticate characteristics indicates, first of all, that steers incorporated more saliva at the more mature cuts, giving a significant lack of fit (quadratic response) with decreased dry matter concentration (Table 12.5). This same quadratic decline was noted for masticate in vitro dry matter disappearance and a quadratic increase in neutral detergent fiber. In all cases, the greater change occurred between the June 7 and June 22 cuts. Median particle size was also reduced quadratically and supports additional chewing with increased maturity as noted by the decline in dry matter, indicating greater saliva incorporation. This is also reflected in particle-size distribution (Figure 12.1) and nutritive value of masticate dry matter (Figure 12.2). However, the average proportions of large (38.7%), medium (48.3%), and small (13.0%) particles were generally not altered by maturity.
Summary and Conclusions
- Flaccidgrass that has been well-fertilized and cut in the boot stage averaged 13.7% crude protein and gave dry matter intake of 1.89 pounds per 100 pounds of body weight with an apparent dry matter digestibility of 65.4%.
- Steers were selective in their consumption, with masticate in vitro dry matter disappearance averaging greater compared with the as-fed hay (52.8 vs. 44.4%) but with neutral detergent fiber similar (71.5 vs. 72.4%).
- Flaccidgrass cut when heads were fully emerged declined to about 8% crude protein, with 73.7% neutral detergent fiber and a dry matter digestibility of 53.3%.
- Delaying cutting beyond the boot stage greatly reduced the nutritive value of the forage and consequently also reduced both dry matter intake and dry matter digestibility.
| Date of Cut | DMI (lb/100 lb2) |
Digestibilities1 | Digestible Intakes | ||||||||
|---|---|---|---|---|---|---|---|---|---|---|---|
| DM (%) |
NDF (%) |
ADF (%) |
HEMI (%) |
CELL (%) |
DM (lb/100 lb2) |
NDF (lb/100 lb2) |
ADF (lb/100 lb2) |
HEMI (lb/100 lb2) |
CELL (lb/100 lb2) |
||
| June 7 | 1.893 | 65.3 | 66.0 | 61.2 | 71.9 | 70.4 | 1.23 | 0.85 | 0.45 | 0.40 | 0.42 |
| June 22 | 1.38 | 53.3 | 53.0 | 47.2 | 61.6 | 58.9 | 0.74 | 0.54 | 0.29 | 0.24 | 0.29 |
| July 5 | 1.22 | 51.1 | 50.6 | 46.0 | 57.7 | 55.5 | 0.62 | 0.45 | 0.26 | 0.19 | 0.24 |
| Significance (P): | |||||||||||
| Date of Cut | <0.01 | <0.01 | <0.01 | <0.01 | <0.01 | <0.01 | <0.01 | <0.01 | <0.01 | <0.01 | <0.01 |
| Linear | <0.01 | <0.01 | <0.01 | <0.01 | <0.01 | <0.01 | <0.01 | <0.01 | <0.01 | <0.01 | <0.01 |
| Lack of Fit | 0.04 | 0.03 | 0.07 | 0.03 | 0.29 | 0.08 | <0.01 | 0.01 | 0.01 | 0.01 | 0.03 |
1 NDF = neutral detergent fiber; ADF = acid detergent fiber; HEMI = hemicellulose; CELL = cellulose. ↲
2 Body weight basis. ↲
3 Each value is the mean of six steers. ↲
| Date of Cut | IVDMD | CP | NDF | Fiber Fractions | ||||||
|---|---|---|---|---|---|---|---|---|---|---|
| AF | DV2 | AF | DV | AF | DV | ADF | HEMI | CELL | Lignin | |
| June 7 | 52.13 | -7.6 | 13.7 | -4.9 | 69.5 | 6.0 | 40.2 | 29.3 | 32.9 | 6.4 |
| June 22 | 45.0 | -5.9 | 8.1 | -2.3 | 73.7 | 4.1 | 45.9 | 27.9 | 36.0 | 9.0 |
| July 5 | 39.0 | -7.1 | 7.8 | -3.0 | 74.0 | 4.4 | 47.0 | 27.0 | 35.8 | 9.5 |
| Significance (P): | ||||||||||
| Date of Cut | <0.01 | 0.60 | <0.01 | 0.05 | <0.01 | 0.03 | <0.01 | 0.01 | <0.01 | <0.01 |
| Linear | <0.01 | 0.75 | <0.01 | 0.06 | <0.01 | 0.03 | <0.01 | <0.01 | <0.01 | <0.01 |
| Lack of Fit | <0.01 | 0.35 | <0.01 | 0.06 | <0.01 | 0.07 | <0.01 | 0.47 | <0.01 | <0.01 |
1 CP = crude protein; NDF = neutral detergent fiber; ADF = acid detergent fiber; HEMI = hemicellulose; CELL = cellulose. ↲
2 DV = difference value (weighback concentration minus AF concentration). ↲
3 Each value is the average of four samples and the mean of three steers. ↲
| Date of Cut | Liquid Phase | Solid Phase | Actual | |||||||||
|---|---|---|---|---|---|---|---|---|---|---|---|---|
| Chromium | Ytterbium | |||||||||||
| ROP (per hr) |
MRT (hrs) |
ROP (per hr) |
MRT (hrs) |
FO (lb/100 lb2) |
DM (lb/100 lb2) |
ROP (per hr) |
MRT (hrs) |
FO (lb/100 lb) |
DMI (lb/100 lb) |
FO (lb/100 lb) |
DMI (lb/100 lb) |
|
| June 7 | 0.0883 | 21.0 | 0.025 | 76.1 | 0.53 | 1.34 | 0.031 | 57.4 | 0.61 | 1.55 | 0.54 | 1.55 |
| June 22 | 0.064 | 26.2 | 0.021 | 93.8 | 0.45 | 0.90 | 0.025 | 71.6 | 0.64 | 1.28 | 0.51 | 1.10 |
| July 5 | 0.066 | 25.9 | 0.019 | 95.7 | 0.50 | 0.97 | 0.027 | 75.0 | 0.55 | 1.06 | 0.51 | 1.04 |
| Significance (P): | ||||||||||||
| Date of Cut | <0.01 | <0.01 | 0.21 | <0.01 | 0.03 | <0.01 | <0.01 | <0.01 | 0.13 | <0.01 | 0.59 | <0.01 |
| Linear | <0.01 | <0.01 | 0.09 | <0.01 | 0.28 | <0.01 | <0.01 | <0.01 | 0.15 | <0.01 | 0.36 | <0.01 |
| Lack of Fit | 0.01 | 0.03 | 0.70 | 0.06 | 0.01 | <0.01 | 0.03 | <0.01 | 0.12 | <0.01 | 0.65 | <0.01 |
1 ROP = rate of passage; MRT = mean retention time; FO = fecal output. ↲
2 Body weight basis. ↲
3 Each value is the mean of six steers. ↲
| Date of Cut | MPS (mm) |
Composition | |||
|---|---|---|---|---|---|
| CP (%) |
NDF (%) |
ADF (%) |
Lignin (%) |
||
| June 7 | 0.322 | 12.5 | 68.8 | 43.6 | 12.9 |
| June 22 | 0.31 | 8.6 | 75.1 | 50.4 | 15.8 |
| July 5 | 0.30 | 7.8 | 77.0 | 51.1 | 16.1 |
| Significance (P): | |||||
| Date of Cut | 0.05 | <0.01 | <0.01 | <0.01 | <0.01 |
| Linear | 0.02 | <0.01 | <0.01 | <0.01 | <0.01 |
| Lack of Fit | 0.59 | <0.01 | <0.01 | <0.01 | <0.01 |
1 CP = crude protein; NDF = neutral detergent fiber; ADF = acid detergent fiber. ↲
2 Each value is the mean of six steers. ↲
| Date of Cut | Composition1 | MPS (mm) |
Particle-size Classes2 | ||||
|---|---|---|---|---|---|---|---|
| DM (%) |
IVDMD (%) |
NDF (%) |
Large (%) |
Medium (%) |
Small (%) |
||
| June 7 | 16.43 | 60.5 | 69.2 | 1.5 | 42.3 | 46.2 | 11.4 |
| June 22 | 13.8 | 50.5 | 72.1 | 1.3 | 34.7 | 50.5 | 14.7 |
| July 5 | 14.1 | 47.5 | 73.1 | 1.4 | 39.0 | 48.1 | 12.9 |
| Significance (P): | |||||||
| Date of Cut | 0.01 | <0.01 | <0.01 | 0.06 | 0.18 | 0.12 | 0.11 |
| Linear | 0.01 | <0.01 | <0.01 | 0.16 | 0.32 | 0.24 | 0.27 |
| Lack of Fit | 0.03 | 0.01 | 0.02 | 0.04 | 0.11 | 0.07 | 0.06 |
1 DM = dry matter; IVDMD = in vitro dry matter disappearance; NDF = neutral detergent fiber. ↲
2 Large = ≥ 1.7 mm; Medium = < 1.7 and ≥ 0.5mm; Small = < 0.5 mm. ↲
3 Each value is the average of four samples and the mean of three steers. ↲
Experiment 13. Eastern Gamagrass Cut at Three Maturities: Changes in Nutritive Value and Quality
Eastern gamagrass is a native, perennial, warm-season bunchgrass adapted throughout the eastern and central United States. It is noted for its contribution to grazing systems and for being productive and palatable as a preserved forage. Our objective in this experiment was to determine the nutritive value and quality of gamagrass regrowth when subjected to drought and heat stress during summer.
Materials and Methods
A well-established stand of Iuka eastern gamagrass provided the experimental hay. The field was burned in late February to remove all fall carryover growth, top-dressed in March with 80 pounds of nitrogen per acre, and the initial growth harvested June 12. The field was top-dressed again with 80 pounds of nitrogen per acre and the regrowth cut at three maturities, resulting in the following treatments for evaluation:
- Vegetative, 38-day regrowth (31 inches in height)
- Early boot, 56-day regrowth
- Heading, 64-day regrowth
All treatments were flail-chopped to a 4-inch stubble, blown into a self-unloading wagon, transported to a bulk drying barn, and dried overnight (Appendix GP-1). After drying, the hay was square baled directly from the bulk barn and stored on wooden pallets in an experimental-hay storage barn at the NC State University Forage-Animal Metabolism Unit in Raleigh, NC, until fed.
Two experiments were conducted. We designed one experiment to estimate intake and digestibility (Experiment 13A) and the other (Experiment 13B) to estimate mastication characteristics. The intake and digestibility experiment was conducted with steers in a randomized complete block design with five steers (replicates) per treatment. The steers were standardized, grouped by weight in sets of three, and randomly assigned to the three treatments within group, and the experiment was conducted using standard procedures (Appendix GP-2).
In the mastication experiment, six esophageally fistulated steers were used in a randomized complete block design. Each animal was fed two treatments on day one (one in the a.m. and one in the p.m.) and one treatment on day two (in the a.m.) to complete the experiment, which was conducted according to standard procedures (Appendix GP-3).
All as-fed, weighback, and masticate samples were analyzed for nutritive value and fecal samples for chemical composition according to standard procedures (Appendix GP-7). All data were analyzed statistically according to the experimental design (Appendix GP-8).
Results and Discussion
Experiment 13A
Dry matter intake by steers was not altered when gamagrass matured from the late vegetative stages (31 inches in height) through heading, averaging 2.13 pounds of dry matter intake per 100 pounds of body weight (Table 13.1). Dry matter digestibility, however, was altered, decreasing from 57.3% for the vegetative stage to 52.1% at the early boot with no difference between early boot and heading (51.4%). This decline was also noted for neutral detergent fiber digestibility and its fiber constituents (Table 13.1). Digestible intake of dry matter was again greater for the vegetative gamagrass compared to the similar early boot and heading treatments.
The in vitro true dry matter disappearance and nutritive value constituents of the as-fed hays were altered by maturity, with in vitro true dry matter disappearance and crude protein decreasing and neutral detergent fiber and its constituent fiber fractions generally increasing from the vegetative to the heading stages (Table 13.2). Some selective consumption was evident from the difference values (weighback concentration minus as-fed hay concentration), but selectivity varied depending on the variable of interest.
This relationship also carried through into the feces, with concentrations of crude protein greatest and neutral detergent fiber and its constituent fiber fractions of acid detergent fiber, hemicellulose, and cellulose least for the vegetative treatment, compared with the fecal composition of the early boot and heading treatments (Table 13.3). Also, the neutral detergent fiber, acid detergent fiber, and hemicellulose concentrations of the feces were greater for the heading hay than for the early boot hay.
Experiment 13B
The masticate characteristics of particle size, proportion of particle-size classes, as well as nutritive value of the whole masticate and each particle-size class, clearly indicated the greater quality of the vegetative treatment compared with the early boot and heading treatments (Table 13.4). In all cases, the early boot and heading treatments were similar for all variables. This response is consistent with dry matter digestibility estimates.
Summary and Conclusions
- Iuka eastern gamagrass was readily eaten by steers, and dry matter intake was similar regardless of the maturity stage evaluated.
- The digestibility of the dry matter declined from the late vegetative growth stage to the boot stage but changed little from boot to heading.
- Digestible dry matter intake was greatest for the vegetative stage, indicating that greater performing animals would benefit from the vegetative compared with the more mature growth stages.
- Masticate characteristics revealed greater differences in nutritive value between the vegetative hays compared with the more mature growth stages.
- Gamagrass can provide a source of hay in ruminant production systems, but stage of maturity, relative to potential dry matter yield and associated nutritive value, warrants consideration based on the animal response desired.
| Maturity | DMI (lb/100 lb2) |
Digestibilities | Digestible Intakes | ||||||||
|---|---|---|---|---|---|---|---|---|---|---|---|
| DM (%) |
NDF (%) |
ADF (%) |
HEMI (%) |
CELL (%) |
DM (lb/100 lb2) |
NDF (lb/100 lb2) |
ADF (lb/100 lb2) |
HEMI (lb/100 lb2) |
CELL (lb/100 lb2) |
||
| Vegetative (V) | 2.213 | 57.3 | 63.2 | 62.5 | 63.8 | 69.4 | 1.27 | 1.03 | 0.53 | 0.50 | 0.51 |
| Early Boot (EB) | 2.17 | 52.1 | 58.6 | 59.5 | 57.6 | 64.7 | 1.13 | 0.96 | 0.51 | 0.45 | 0.47 |
| Heading (H) | 2.01 | 51.4 | 57.4 | 56.5 | 58.3 | 62.3 | 1.00 | 0.85 | 0.43 | 0.42 | 0.41 |
| Significance (P): | |||||||||||
| Maturity | 0.26 | 0.02 | 0.01 | 0.01 | 0.02 | <0.01 | 0.06 | 0.17 | 0.12 | 0.15 | 0.09 |
| V vs. (EB+H) | 0.27 | 0.01 | 0.01 | 0.01 | 0.01 | <0.01 | 0.03 | 0.11 | 0.14 | 0.07 | 0.07 |
| EB vs. H | 0.21 | 0.74 | 0.51 | 0.09 | 0.76 | 0.17 | 0.21 | 0.24 | 0.10 | 0.50 | 0.14 |
1 NDF = neutral detergent fiber; ADF = acid detergent fiber; HEMI = hemicellulose; CELL = cellulose. ↲
2 Body weight basis. ↲
3 Each value is the mean of five steers. ↲
| Maturity | IVTD | CP | NDF | Fiber Fractions | ||||||
|---|---|---|---|---|---|---|---|---|---|---|
| AF (%) |
DV2 (%) |
AF (%) |
DV (%) |
AF (%) |
DV (%) |
ADF (%) |
HEMI (%) |
CELL (%) |
Lignin (%) |
|
| Vegetative (V) | 65.43 | -3.1 | 11.3 | -0.5 | 73.7 | 1.1 | 38.2 | 35.5 | 32.9 | 5.2 |
| Early Boot (EB) | 58.5 | -1.9 | 9.3 | 0.7 | 75.1 | -0.8 | 39.3 | 35.8 | 33.3 | 5.9 |
| Heading (H) | 54.3 | -5.2 | 9.3 | 0.3 | 76.1 | -1.1 | 39.1 | 37.0 | 33.3 | 6.1 |
| Significance (P): | ||||||||||
| Maturity | <0.01 | <0.01 | <0.01 | 0.01 | <0.01 | <0.01 | 0.01 | <0.01 | 0.44 | <0.01 |
| V vs. (EB+H) | <0.01 | 0.44 | <0.01 | 0.01 | <0.01 | <0.01 | <0.01 | <0.01 | 0.21 | <0.01 |
| EB vs. H | <0.01 | <0.01 | 0.97 | 0.15 | <0.01 | 0.59 | 0.52 | <0.01 | 0.98 | <0.01 |
1 CP = crude protein; NDF = neutral detergent fiber; ADF = acid detergent fiber; HEMI = hemicellulose; CELL = cellulose. ↲
2 DV = difference value (weighback concentration minus AF concentration). ↲
3 Each value is the mean of five samples. ↲
| Maturity | CP (%) |
NDF (%) |
ADF (%) |
HEMI (%) |
CELL (%) |
Lignin (%) |
|---|---|---|---|---|---|---|
| Vegetative (V) | 11.22 | 63.5 | 33.5 | 30.0 | 23.4 | 8.6 |
| Early Boot (EB) | 9.7 | 65.4 | 33.7 | 31.8 | 25.1 | 8.4 |
| Heading (H) | 9.2 | 67.1 | 35.1 | 32.1 | 26.2 | 8.7 |
| Significance (P): | ||||||
| Maturity | <0.01 | <0.01 | 0.01 | <0.01 | 0.01 | 0.39 |
| V vs. (EB+H) | <0.01 | <0.01 | 0.03 | <0.01 | <0.01 | 0.54 |
| EB vs. H | 0.21 | 0.02 | 0.01 | 0.04 | 0.12 | 0.24 |
1ADF = acid detergent fiber; HEMI = hemicellulose; CELL = cellulose. ↲
2 Each value is the mean of five steers. ↲
| Maturity | Whole | Particle-size Classes | |||||||||||||||
|---|---|---|---|---|---|---|---|---|---|---|---|---|---|---|---|---|---|
| Large | Medium | Small | |||||||||||||||
| DM (%) |
MPS (mm) |
IVTD (%) |
CP (%) |
NDF (%) |
Prop (%) |
IVTD (%) |
CP (%) |
NDF (%) |
Prop (%) |
IVTD (%) |
CP (%) |
NDF (%) |
Prop (%) |
IVTD (%) |
CP (%) |
NDF (%) |
|
| Vegetative (V) | 17.13 | 1.5 | 69.8 | 11.0 | 70.6 | 41.1 | 67.5 | 9.5 | 72.7 | 49.0 | 71.3 | 11.9 | 69.7 | 9.9 | 71.8 | 12.7 | 65.9 |
| Early Boot (EB) | 14.9 | 1.3 | 63.9 | 8.8 | 70.0 | 33.3 | 61.7 | 7.1 | 73.7 | 51.4 | 64.8 | 9.5 | 69.4 | 15.3 | 65.3 | 10.1 | 64.0 |
| Heading (H) | 14.0 | 1.3 | 64.5 | 8.9 | 69.5 | 32.9 | 60.8 | 6.7 | 73.8 | 51.7 | 66.3 | 9.7 | 69.4 | 15.4 | 66.8 | 10.9 | 61.3 |
| Significance (P): | |||||||||||||||||
| Maturity | <0.01 | <0.01 | <0.01 | <0.01 | 0.01 | 0.01 | <0.01 | <0.01 | 0.04 | 0.15 | <0.01 | <0.01 | 0.52 | <0.01 | <0.01 | <0.01 | <0.01 |
| V vs. (EB+H) | <0.01 | <0.01 | <0.01 | <0.01 | 0.01 | <0.01 | <0.01 | <0.01 | 0.01 | 0.06 | <0.01 | <0.01 | 0.26 | <0.01 | <0.01 | <0.01 | <0.01 |
| EB vs. H | 0.21 | 0.78 | 0.24 | 0.41 | 0.16 | 0.86 | 0.11 | 0.02 | 0.84 | 0.83 | 0.04 | 0.21 | 0.96 | 0.95 | 0.02 | <0.01 | 0.01 |
1 Large = > 1.7mm; Medium = ≤1.7mm and >0.5mm; Small < 0.5 mm. ↲
2 IVTD = in vitro true dry matter disappearance; CP = crude protein; NDF = neutral detergent fiber. ↲
3 Each value is the mean of six steers. ↲
Figure 5.1. Relationship among hay quality variables and neutral detergent fiber (⬛️, NDF) of switchgrass with increasing maturity, Experiment 5A (◯, DMI = dry matter intake; △, DMD = dry matter digestibility; ⚫️, DDMI = digestible dry matter intake; BWT = body weight).
Figure 6.1. Relationship among hay quality variables and neutral detergent fiber (⬛️, NDF) of switchgrass with increasing maturity (◯, DMI = dry matter intake; △, DMD = dry matter digestibility; ⚫️, DDMI = digestible dry matter intake; BWT = body weight).
Figure 7.1. Masticate in vitro dry matter disappearance (▢), crude protein (⚫️), and neutral detergent fiber (△) changes with increasing maturity of tall fescue and switchgrass, Experiment 7B (dry matter basis). (See the Materials and Methods section of this experiment for treatment number descriptions, p. 47.)
Figure 7.2 Median particle size of masticate dry matter with increasing maturity of tall fescue and switchgrass, Experiment 7B (dry matter basis). (See the Materials and Methods section of this experiment for treatment number descriptions, p. 47.)
Figure 7.3. Proportion of masticate dry matter in large (black bars), medium (grey bars) and small (white bars) particle size classes with increasing maturity of tall fescue and switchgrass (dry matter basis). (See the Materials and Methods section of this experiment for treatment number descriptions, p. 47.)
Figure 7.4. Chewing behavior of steers (Experiment 7B) fed tall fescue and switchgrass hays of increasing maturity expressed as chews/min (⬛️), chews/gram dry matter (▲), chews/gram neutral detergent fiber (▢), chews/gram of in vitro dry matter disappearance (⚫️), chew/bolus ◯), and minutes of chewing activity/bolus (△). (See the Materials and Methods section of this experiment for treatment number descriptions, p. 47.)
Figure 9.1. Masticate in vitro dry matter disappearance (IVDMD, closed symbols) and neutral detergent fiber (NDF, open symbols) of particle dry matter, from initial-growth flaccidgrass hay cut May 18 (⚫️,◯), June 19 (⬛️, ▢), and July 19 (▲, △), Experiment 9B.
Figure 9.2. Particle-size distribution of masticate (closed symbols) and subsequent fecal dry matter (open symbols) from initial-growth flaccidgrass hay cut May 18 (⚫️,◯), June 19 (⬛️, ▢) and July 19 (▲, △), Experiment 9B.
Figure 10.1. Changes in canopy height (HGT) and nutritive value of switchgrass (SG) and flaccidgrass (FG) with increasing maturity, Year 1 (Experiment A) and Year 2 (Experiment B): IVOMD, in vitro organic matter disappearance; CP, crude protein; NDF, neutral detergent fiber; ADF, acid detergent fiber (dry matter basis).
Figure 10.2. Changes in organic matter digestibility (OMD), organic matter intake (OMI), and digestible organic matter intakes (DOMI) of switchgrass (SG) and flaccidgrass (FG) with increasing maturity, Year 1 (Experiment A; SE = 8.837, 0.122, and 0.119, respectively) and Year 2 (Experiment B; SE = 2.212, 0.125, and 0.079, respectively) (dry matter basis).
Figure 12.1. Particle-size distribution of masticate (closed symbols) and fecal (open symbols) dry matter from initial-growth and regrowth flaccidgrass hays cut June 7 (⚫️,◯), June 22 (⬛️, ▢) and July 5 (▲, △), Experiment 12B.
Figure 12.2. Masticate in vitro dry matter disappearance (IVDMD, closed symbols) and neutral detergent fiber (NDF, open symbols) of particle dry matter from initial-growth and regrowth flaccidgrass hays cut June 7 (⚫️,◯), June 22(⬛️, ▢) , and July 5 (▲, △), Experiment 12B.
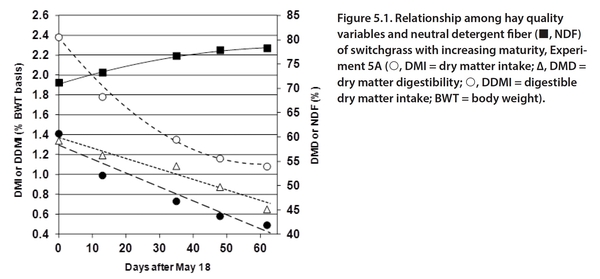
Figure 5.1 Relationship among hay quality variables and neutral detergent fiber (⬛️, NDF) of switchgrass with increasing maturity, Experiment 5A (◯, DMI = dry matter intake; △, DMD = dry matter digestibility; ⚫️, DDMI = digestible dry matter intake; BWT = body weight).
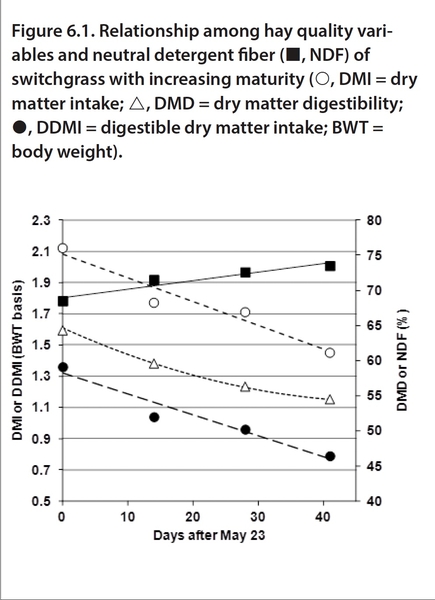
Figure 6.1 Relationship among hay quality variables and neutral detergent fiber (⬛️, NDF) of switchgrass with increasing maturity (◯, DMI = dry matter intake; △, DMD = dry matter digestibility; ⚫️, DDMI = digestible dry matter intake; BWT = body weight).
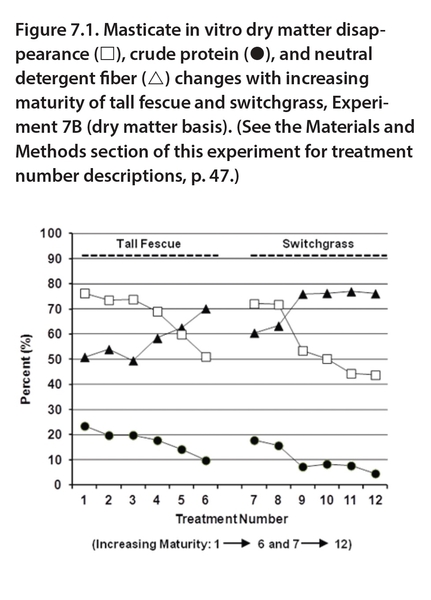
Figure 7.1 Masticate in vitro dry matter disappearance (▢), crude protein (⚫️), and neutral detergent fiber (△) changes with increasing maturity of tall fescue and switchgrass, Experiment 7B (dry matter basis). (See the Materials and Methods section of this experiment for treatment number descriptions, p. 47.)
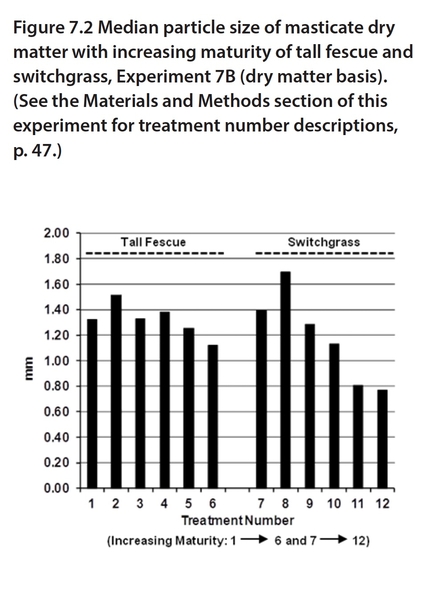
Figure 7.2 Median particle size of masticate dry matter with increasing maturity of tall fescue and switchgrass, Experiment 7B (dry matter basis). (See the Materials and Methods section of this experiment for treatment number descriptions, p. 47.)
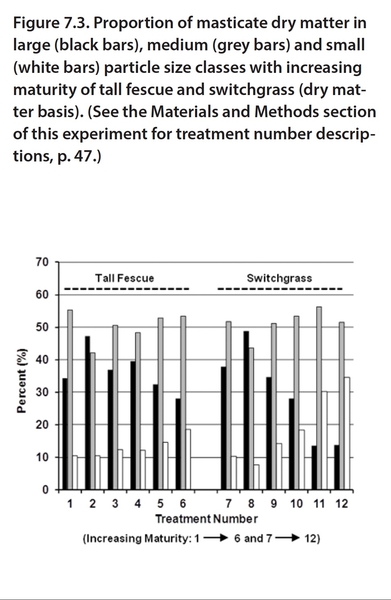
Figure 7.3 Proportion of masticate dry matter in large (black bars), medium (grey bars) and small (white bars) particle size classes with increasing maturity of tall fescue and switchgrass (dry matter basis). (See the Materials and Methods section of this experiment for treatment number descriptions, p. 47.)
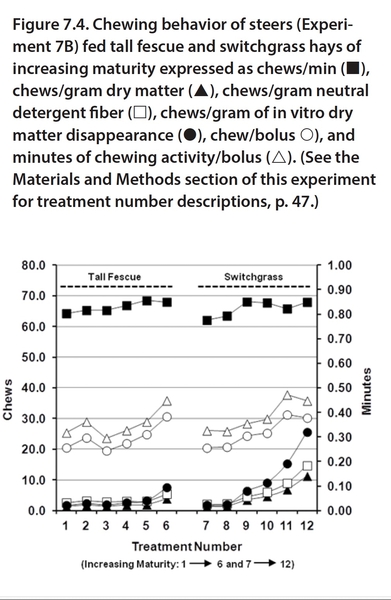
Figure 7.4. Chewing behavior of steers (Experiment 7B) fed tall fescue and switchgrass hays of increasing maturity expressed as chews/min (⬛️), chews/gram dry matter (▲), chews/gram neutral detergent fiber (▢), chews/gram of in vitro dry matter disappearance (⚫️), chew/bolus ◯), and minutes of chewing activity/bolus (△).
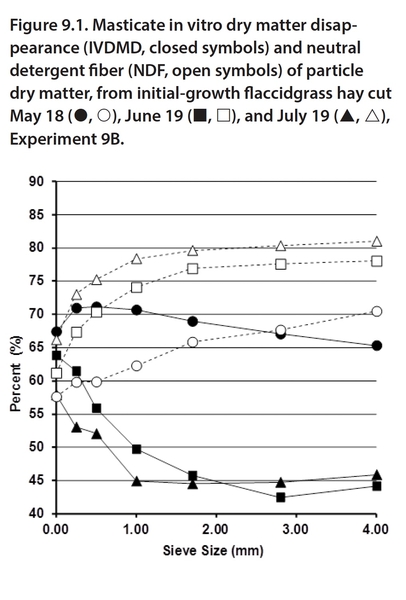
Figure 9.1. Masticate in vitro dry matter disappearance (IVDMD, closed symbols) and neutral detergent fiber (NDF, open symbols) of particle dry matter, from initial-growth flaccidgrass hay cut May 18 (⚫️,◯), June 19 (⬛️, ▢), and July 19 (▲, △), Experiment 9B.
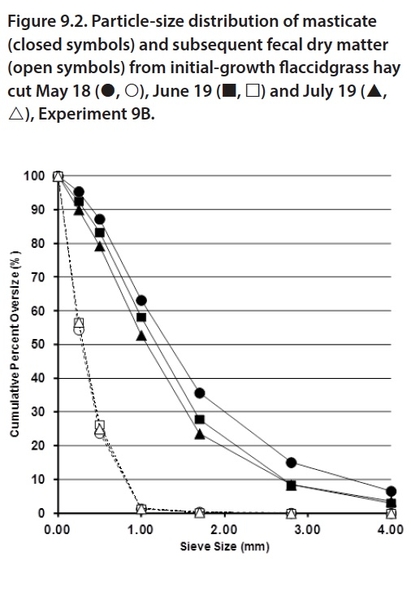
Figure 9.2. Particle-size distribution of masticate (closed symbols) and subsequent fecal dry matter (open symbols) from initial-growth flaccidgrass hay cut May 18 (⚫️,◯), June 19 (⬛️, ▢) and July 19 (▲, △), Experiment 9B.
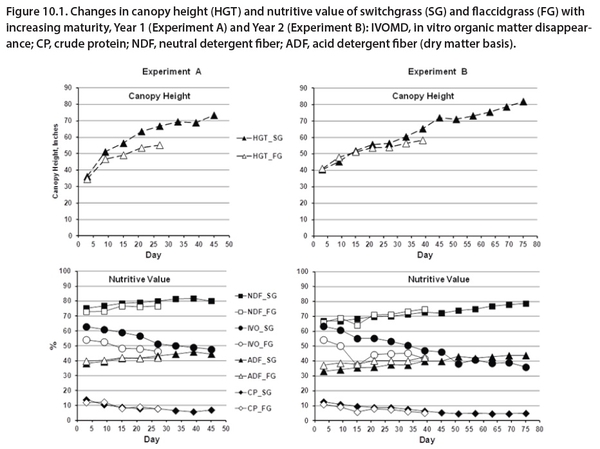
Figure 10.1. Changes in canopy height (HGT) and nutritive value of switchgrass (SG) and flaccidgrass (FG) with increasing maturity, Year 1 (Experiment A) and Year 2 (Experiment B): IVOMD, in vitro organic matter disappearance; CP, crude protein; NDF, neutral detergent fiber; ADF, acid detergent fiber (dry matter basis).
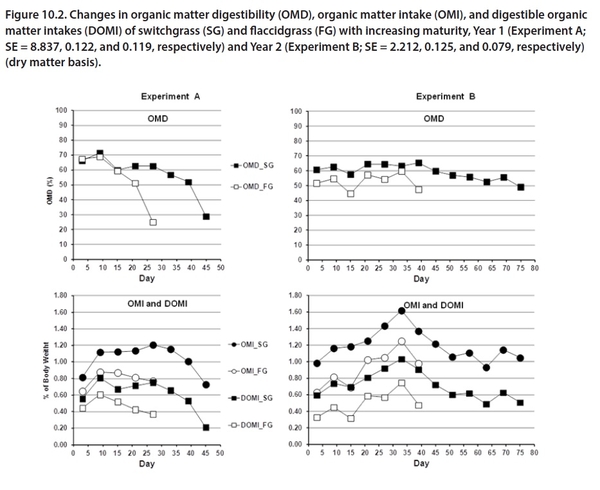
Figure 10.2. Changes in organic matter digestibility (OMD), organic matter intake (OMI), and digestible organic matter intakes (DOMI) of switchgrass (SG) and flaccidgrass (FG) with increasing maturity, Year 1 (Experiment A; SE = 8.837, 0.122, and 0.119, respectively) and Year 2 (Experiment B; SE = 2.212, 0.125, and 0.079, respectively) (dry matter basis).
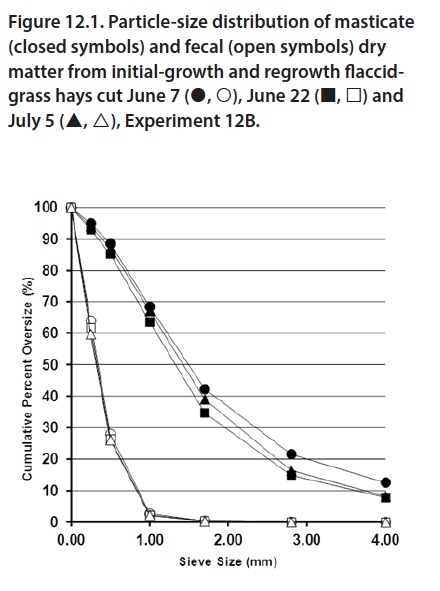
Figure 12.1. Particle-size distribution of masticate (closed symbols) and fecal (open symbols) dry matter from initial-growth and regrowth flaccidgrass hays cut June 7 (⚫️,◯), June 22 (⬛️, ▢) and July 5 (▲, △), Experiment 12B.
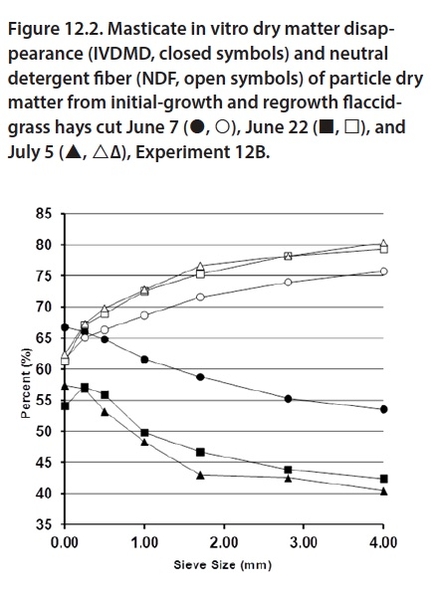
Figure 12.2. Masticate in vitro dry matter disappearance (IVDMD, closed symbols) and neutral detergent fiber (NDF, open symbols) of particle dry matter from initial-growth and regrowth flaccidgrass hays cut June 7 (⚫️,◯), June 22(◼, ▢) , and July 5 (▲, △), Experiment 12B.
III. Evaluation of Increased Ad Libitum Feeding on Forage Quality
Experiment 14. Increasing the Level of Ad Libitum Feeding of Vegetative and Headed Switchgrass Hay: Dry Matter Intake and Digestibility
The nutritive value of switchgrass declines with advancing maturity, as major changes occur at the onset of early boot and heading stages. These stages are often selected when cutting for hay because of increased dry matter production. One approach to increasing the nutritive value of an animal’s diet when offered a mature forage is to feed at increasing ad libitum levels to provide the opportunity for selective consumption, thereby increasing the nutritive value of the consumed hay. Our objective in this experiment was to obtain estimates of dry matter intake and digestibilities of dry matter and fiber fractions with increasing levels of ad libitum feeding. Weighback will be characterized for stem and ‘other’ (mainly leaf) proportions to assess selective consumption.
Materials and Methods
A well-established stand of Kanlow switchgrass on the west edge of Raleigh, NC, served as the experimental forage. The previous fall’s carryover growth was removed by burning in late February. The field was top-dressed in March with 70 pounds of nitrogen per acre in preparation for the production of experimental hays used in two experiments. A portion of the field was cut in early June in the vegetative stage and used in one experiment (Experiment 14A). The other portion of the field was cut in early August when headed and used in the second experiment (Experiment14B). The forage for both experiments was tedded daily to aid drying and, when cured, baled with a conventional square baler and transported to the experimental-hay storage barn at the NC State University Forage-Animal Metabolism Unit in Raleigh, NC. The bales were stored on wooden pallets until processed for feeding (Appendix GP-1).
Four treatments were evaluated in each experiment and consisted of increased levels of feeding.
The ad libitum feeding levels evaluated in each experiment were as follows:
Experiment 14A (cut early June, vegetative):
- Fed at 5.7% ad libitum
- Fed at 16.4% ad libitum
- Fed at 24.4% ad libitum
- Fed at 32.2% ad libitum
Experiment 14B (cut early August, headed):
- Fed at 6.9% ad libitum
- Fed at 18.4% ad libitum
- Fed at 25.4% ad libitum
- Fed at 33.4% ad libitum
Angus steers of similar weight were used in a 4 × 4 Latin square design in both experiments. Steers averaged 617 ± 14.8 pounds in Experiment 14A and 589 ± 23.5 pounds in Experiment 14B. Intake and digestibility estimates were obtained by standard procedures (Appendix GP-2). Stem and ‘other’ fractions of the weighback were determined by hand separation. Fecal samples collected during the digestibility phase were sieved to determine particle-size distribution and subsequent particle-size classes of large, medium, and small (Appendix GP-5).
All as-fed and weighback samples were analyzed for nutritive value and fecal samples for chemical composition according to standard procedures (Appendix GP-7). The data were analyzed statistically according to the experimental design (Appendix GP-8).
Results and Discussion
The two experiments conducted evaluated switchgrass cut in the vegetative stage up to about 32% ad libitum and switchgrass cut at the heading stage and fed up to about 33% ad libitum.
Experiment 14A
Increasing the quantity of vegetative hay fed in excess each day increased dry matter intake linearly from 1.51 pounds per 100 pounds of body weight when fed at about 6% excess to 2.32 pounds per 100 pounds body weight at about 32% excess (Table 14.1). This increase in feeding level did not alter apparent dry matter digestibility, but did linearly increase digestible intakes of dry matter and constituent fiber fractions.
The nutritive value of the immature switchgrass hay averaged 62.5% in in vitro dry matter disappearance with 8.8% crude protein and 71.0% neutral detergent fiber (Table 14.2). Although no trend in selectivity with increasing ad libitum feeding was evident (significant lack of fit) from the difference value (weighback concentration minus as-fed concentration) for in vitro dry matter disappearance, both difference values for crude protein and neutral detergent fiber gave linear decreases with greater feeding levels, indicating lesser selectivity (Table 14.2). Examining the proportion of stem and ‘other’ present in the weighback also indicates a linear decline in stems and a linear increase in the ‘other’ (mainly leaves) fraction (Table 14.3). This further indicates reduced selectivity as level of feeding increased.
Characterization of fecal particle sizes of the vegetative switchgrass revealed no difference in median particle size (mean = 0.27 mm) or in the average proportions of large (0.6%), medium (20.4%), or small particles (79.0%) (Table 14.4).
Experiment 14B
Steers fed mature switchgrass at 6.9% ad libitum consumed only 1.02 pounds per 100 pounds of body weight, but consumption increased linearly, as noted for vegetative switchgrass, up to about 33% excess (Table 14.1). It should be noted that intake at the 33% ad libitum level for the headed switchgrass was essentially the same intake obtained at the 5.7% ad libitum feeding level for the vegetative switchgrass. Increasing ad libitum feeding resulted in linear decreases in digestibilities of dry matter, neutral detergent fiber, acid detergent fiber, and cellulose, but a linear increase in digestible intakes of hemicellulose—with digestible intakes of dry matter and neutral detergent fiber approaching significance (Table 14.1).
The average in vitro dry matter disappearance (42.6%), crude protein (4.3%), and neutral detergent fiber (77.9%) of the mature switchgrass hay are reflective of the headed stage at cutting (Table 14.2). Selective consumption was evident for all three measurements, as difference values were negative for in vitro dry matter disappearance and crude protein but positive for neutral detergent fiber. The degree of selectivity decreased linearly, however, as ad libitum feeding increased—as noted by the reduction of the difference value.
Examination of the weighback indicates the degree to which stem composed the mature switchgrass, averaging 94.5 % over the feeding levels with no response to level of feeding (Table 14.3). The in vitro dry matter disappearance and crude protein of the stem increased linearly and neutral detergent fiber decreased linearly with increased ad libitum feeding, indicating some reduction in selectivity at the greater feeding levels. Fecal characteristics were also not altered by increasing feeding level, with the median particle size averaging 0.23 mm and the dry matter being composed of 0.5% large, 19.1% medium, and 80.5% small particles (Table 14.4).
Summary and Conclusions
Experiment 14A
- Vegetative switchgrass hay fed at about 6% ad libitum feeding provided 1.51 pounds of intake per 100 pounds of body weight with a dry matter digestibility of 60.5%.
- Increasing ad libitum feeding up to 32% increased steer intake to 2.32 pounds per 100 pounds of body weight with a dry matter digestibility of 57%.
- Digestible dry matter intake also increased with ad libitum feeding from 0.91 pounds per 100 pounds body weight at about 6% ad libitum feeding to 1.32 pounds per 100 pounds body weight at 32% ad libitum feeding.
- Vegetative hay averaged 62.5% in vitro dry matter disappearance, 8.8% crude protein, and 71.0% neutral detergent fiber.
- Switchgrass that is cut for hay when vegetative has potential as a ruminant feed, but may require supplemental protein depending on the animal response desired.
Experiment 14B
- Mature switchgrass that is headed and fed at about 7.0% ad libitum was consumed at1.02 pounds per 100 pounds of body weight with a dry matter digestibility of 51.4%.
- Increasing ad libitum feeding up to 33% increased intake linearly, with a maximum of 1.54 pounds per 100 pounds of body weight, and was equivalent to the 6% ad libitum feeding of vegetative switchgrass.
- Digestible dry matter intake of mature switchgrass was not altered by ad libitum feeding, reaching a maximum of 0.70 pound per 100 pounds of body weight and inferior to the vegetative switchgrass.
- The average in vitro dry matter disappearance (42.6%), crude protein (4.3%), and neutral detergent fiber (77.9%) of the headed switchgrass is characteristic of mature switchgrass.
- Switchgrass that is headed out is not a desirable forage for ruminant production.
| Fed | Intake | Digestibilities1 | Digestible Intakes | ||||||||||
|---|---|---|---|---|---|---|---|---|---|---|---|---|---|
| Ad lib.2 (%) |
Actual (ld/d) |
Actual (ld/d) |
Actual (lb/100 lb3) |
DM (%) |
NDF (%) |
ADF (%) |
HEMI (%) |
CELL (%) |
DM (lb/100 lb3) |
NDF (lb/100 lb3) |
ADF (lb/100 lb3) |
HEMI (lb/100 lb3) |
CELL (lb/100 lb3) |
| Experiment 14A (Vegetative): | |||||||||||||
| 5.7 | 10.1 | 9.54 | 1.51 | 60.5 | 63.7 | 59.8 | 67.9 | 69.3 | 0.91 | 0.68 | 0.33 | 0.35 | 0.33 |
| 16.4 | 14.8 | 12.3 | 1.93 | 61.9 | 64.7 | 61.1 | 68.4 | 70.1 | 1.20 | 0.88 | 0.43 | 0.45 | 0.42 |
| 24.4 | 17.4 | 13.2 | 2.07 | 59.0 | 61.7 | 57.5 | 66.1 | 67.6 | 1.22 | 0.89 | 0.42 | 0.47 | 0.42 |
| 32.2 | 22.5 | 15.2 | 2.32 | 57.0 | 60.6 | 56.0 | 65.5 | 67.1 | 1.32 | 0.98 | 0.46 | 0.52 | 0.47 |
| Significance (P): | |||||||||||||
| Treatment | <0.01 | <0.01 | 0.38 | 0.51 | 0.45 | 0.60 | 0.63 | 0.02 | 0.01 | 0.04 | <0.01 | 0.01 | |
| Linear | <0.01 | <0.01 | 0.16 | 0.21 | 0.19 | 0.25 | 0.29 | <0.01 | <0.01 | 0.01 | <0.01 | <0.01 | |
| Quadratic | 0.57 | 0.44 | 0.41 | 0.62 | 0.57 | 0.74 | 0.74 | 0.22 | 0.30 | 0.29 | 0.31 | 0.37 | |
| Lack of Fit | 0.37 | 0.41 | 0.56 | 0.54 | 0.52 | 0.59 | 0.54 | 0.34 | 0.30 | 0.28 | 0.32 | 0.26 | |
| Experiment 14B (Headed): | |||||||||||||
| 6.9 | 6.0 | 5.6 | 1.02 | 51.4 | 53.0 | 48.7 | 58.6 | 56.0 | 0.52 | 0.42 | 0.21 | 0.20 | 0.20 |
| 18.4 | 9.6 | 7.8 | 1.37 | 48.4 | 50.1 | 45.0 | 56.3 | 54.0 | 0.68 | 0.54 | 0.27 | 0.27 | 0.26 |
| 25.4 | 10.8 | 8.1 | 1.43 | 49.1 | 50.7 | 45.6 | 57.0 | 53.6 | 0.70 | 0.54 | 0.27 | 0.28 | 0.26 |
| 33.4 | 13.1 | 8.7 | 1.54 | 45.4 | 46.7 | 41.2 | 53.2 | 50.4 | 0.70 | 0.54 | 0.26 | 0.28 | 0.26 |
| Significance (P): | |||||||||||||
| Treatment | 0.04 | 0.04 | 0.04 | 0.06 | 0.03 | 0.22 | 0.05 | 0.23 | 0.18 | 0.25 | 0.14 | 0.25 | |
| Linear | 0.01 | 0.01 | 0.01 | 0.02 | <0.01 | 0.09 | 0.01 | 0.10 | 0.09 | 0.17 | 0.05 | 0.12 | |
| Quadratic | 0.23 | 0.25 | 0.80 | 0.68 | 0.79 | 0.67 | 0.60 | 0.29 | 0.20 | 0.16 | 0.24 | 0.27 | |
| Lack of Fit | 0.43 | 0.47 | 0.20 | 0.24 | 0.17 | 0.40 | 0.43 | 0.70 | 0.66 | 0.67 | 0.66 | 0.62 | |
1 NDF = neutral detergent fiber; ADF = acid detergent fiber; HEMI = hemicellulose; CELL = cellulose. ↲
2 Ad lib. = ad libitum. ↲
3 Body weight basis. ↲
4 Each value is the mean of four steers. ↲
| Fed | IVDMD | CP | NDF | Fiber Fractions | |||||||
|---|---|---|---|---|---|---|---|---|---|---|---|
| Ad lib.2 (%) |
Actual (lb/d) |
AF (%) |
DV3 (%) |
AF (%) |
DV (%) |
AF (%) |
DV (%) |
ADF (%) |
HEMI (%) |
CELL (%) |
Lignin (%) |
| Experiment 14A (Vegetative): | |||||||||||
| 5.7 | 10.1 | 62.54 | -5.05 | 8.84 | -3.15 | 71.04 | 4.15 | 36.84 | 34.24 | 31.34 | 4.54 |
| 16.4 | 14.8 | 62.5 | 1.7 | 8.8 | -2.9 | 71.0 | 3.4 | 36.8 | 34.2 | 31.3 | 4.5 |
| 24.4 | 17.4 | 62.5 | -1.4 | 8.8 | -2.9 | 71.0 | 3.6 | 36.8 | 34.2 | 31.3 | 4.5 |
| 32.2 | 22.5 | 62.5 | -0.1 | 8.8 | -2.0 | 71.0 | 2.4 | 36.8 | 34.2 | 31.3 | 4.5 |
| Significance (P): | |||||||||||
| Treatment | <0.01 | 0.01 | 0.01 | ||||||||
| Linear | 0.01 | <0.01 | <0.01 | ||||||||
| Quadratic | 0.01 | 0.06 | 0.22 | ||||||||
| Lack of Fit | <0.01 | 0.19 | 0.07 | ||||||||
| Experiment 14B (Headed) | |||||||||||
| 6.9 | 6.0 | 42.64 | -8.75 | 4.34 | -2.85 | 77.94 | 5.55 | 43.94 | 34.04 | 35.54 | 7.34 |
| 18.4 | 9.6 | 42.6 | -6.8 | 4.3 | -2.7 | 77.9 | 5.3 | 43.9 | 34.0 | 35.5 | 7.3 |
| 25.4 | 10.8 | 42.6 | -7.2 | 4.3 | -2.0 | 77.9 | 4.9 | 43.9 | 34.0 | 35.5 | 7.3 |
| 33.4 | 13.1 | 42.6 | -4.9 | 4.3 | -2.0 | 77.9 | 4.6 | 43.9 | 34.0 | 35.5 | 7.3 |
| Significance (P): | |||||||||||
| Treatment: | 0.04 | 0.18 | 0.18 | ||||||||
| Linear | 0.01 | 0.05 | 0.04 | ||||||||
| Quadratic | 0.74 | 0.92 | 0.90 | ||||||||
| Lack of Fit | 0.13 | 0.32 | 0.65 | ||||||||
1 CP = crude protein; NDF = neutral detergent fiber; ADF = acid detergent fiber; HEMI = hemicellulose; CELL = cellulose. ↲
2 Ad Lib. = ad libitum. ↲
3 DV = difference value (weighback concentration minus AF concentration). ↲
4 Each value is the mean of a composite sample from the four periods. ↲
5 Each value is the mean of four samples. ↲
| Fed | Stem | Other | |||||||
|---|---|---|---|---|---|---|---|---|---|
| Ad Lib2 (%) |
Actual (lb/d) |
Prop (%) |
IVDMD (%) |
CP (%) |
NDF (%) |
Prop (%) |
IVDMD (%) |
CP (%) |
NDF (%) |
| Experiment 14A (Vegetative): | |||||||||
| 5.7 | 10.1 | 84.23 | 57.4 | 5.2 | 80.5 | 15.8 | 60.1 | 11.0 | 71.6 |
| 16.4 | 14.8 | 84.6 | 58.0 | 5.5 | 79.4 | 15.4 | 57.5 | 11.8 | 69.5 |
| 24.4 | 17.4 | 79.3 | 59.0 | 6.2 | 78.8 | 20.7 | 60.8 | 11.6 | 69.9 |
| 32.2 | 22.5 | 63.3 | 60.4 | 5.9 | 79.1 | 36.7 | 61.8 | 12.3 | 70.5 |
| Significance (P): | |||||||||
| Treatment | 0.14 | 0.47 | 0.23 | 0.17 | 0.14 | 0.58 | 0.69 | 0.49 | |
| Linear | 0.05 | 0.15 | 0.11 | 0.08 | 0.05 | 0.41 | 0.33 | 0.50 | |
| Quadratic | 0.22 | 0.79 | 0.38 | 0.17 | 0.22 | 0.47 | 0.97 | 0.20 | |
| Lack of Fit | 0.86 | 0.99 | 0.31 | 0.76 | 0.86 | 0.45 | 0.72 | 0.65 | |
| Experiment 14B (Headed): | |||||||||
| 6.9 | 6.0 | 94.2 | 33.4 | 1.5 | 83.8 | 5.8 | 45.9 | 6.94 | 74.54 |
| 18.4 | 9.6 | 93.8 | 35.2 | 1.4 | 83.8 | 6.2 | 50.2 | 7.34 | 76.84 |
| 25.4 | 10.8 | 95.2 | 37.0 | 1.7 | 82.9 | 4.8 | 49.3 | 8.24 | 68.44 |
| 33.4 | 13.1 | 94.8 | 35.9 | 1.8 | 82.7 | 5.2 | 50.0 | 7.24 | 73.44 |
| Significance (P): | |||||||||
| Treatment | 0.97 | 0.08 | 0.25 | 0.09 | 0.97 | 0.24 | 0.33 | <0.01 | |
| Linear | 0.75 | 0.04 | 0.10 | 0.03 | 0.75 | 0.13 | 0.56 | 0.05 | |
| Quadratic | 0.98 | 0.11 | 0.43 | 0.64 | 0.98 | 0.28 | 0.21 | 0.54 | |
| Lack of Fit | 0.72 | 0.44 | 0.45 | 0.30 | 0.72 | 0.39 | 0.30 | 0.05 | |
1 IVDMD = in vitro dry matter disappearance; CP = crude protein; NDF = neutral detergent fiber. ↲
2 Ad Lib. = ad libitum. ↲
3 Each value is the mean of four samples. ↲
4 Data taken from the digestibility phase. ↲
| Fed | MPS (mm) |
Particle-size Class1 | |||
|---|---|---|---|---|---|
| Ad Lib2 (%) |
Actual (lb/d) |
Large (%) |
Medium (%) |
Small (%) |
|
| Experiment 14A (Vegetative): | |||||
| 5.7 | 10.1 | 0.293 | 0.5 | 22.0 | 77.5 |
| 16.4 | 14.8 | 0.28 | 0.6 | 22.1 | 77.3 |
| 24.4 | 17.4 | 0.26 | 0.5 | 19.8 | 79.7 |
| 32.2 | 22.5 | 0.24 | 0.6 | 17.8 | 81.6 |
| SE | 0.018 | 0.14 | 2.58 | 2.64 | |
| Significance (P): | 0.41 | 0.88 | 0.61 | 0.62 | |
| Experiment 14B (Headed): | |||||
| 6.9 | 6.0 | 0.23 | 0.4 | 19.4 | 80.2 |
| 18.4 | 9.6 | 0.24 | 0.5 | 19.1 | 80.4 |
| 25.4 | 10.8 | 0.24 | 0.5 | 18.6 | 80.9 |
| 33.4 | 13.1 | 0.23 | 0.6 | 19.1 | 80.3 |
| SE | 0.013 | 0.12 | 1.42 | 1.48 | |
| Significance (P): | 0.95 | 0.72 | 0.96 | 0.97 | |
1 Large = ≥ 1.7 mm; Medium = < 1.7 and ≥ 0.5mm; Small = < 0.5 mm. ↲
2 Ad Lib. = ad libitum. ↲
3 Each value is the mean of four steers. ↲
Experiment 15. Increasing the Level of Ad Libitum Feeding of Flaccidgrass Hay: Dry Matter Intake and Digestibility
Flaccidgrass is a warm-season perennial grass introduced into the United States from the higher elevations of Afghanistan that has potential as a forage in the Upper South. As with most warm-season grasses, as the plant matures from vegetative to heading, dry matter yield increases and nutritive value, and hence quality, of the forage declines. We conducted this experiment to evaluate the potential of increasing steer dry matter intake and digestibility of dry matter and fiber constituents by increasing the feeding level of mature flaccidgrass hay.
Material and Methods
A well-established stand of flaccidgrass served as the experimental forage. Fall carryover growth was burned in late February, and the field was top-dressed in mid-March with 70 pounds per acre of nitrogen in preparation for the growth of the experimental hay. Flaccidgrass was cut for hay in mid-June when fully headed. The forage was field cured, windrowed, and baled with a conventional square baler. The bales were transported to the experimental-hay barn at the NC State University Forage-Animal Metabolism Unit in Raleigh, NC, and stored on wooden pallets. Hays were processed according to standard procedures (Appendix GP-1) prior to feeding.
Four treatments were evaluated and consisted of increased levels of feeding. The ad libitum feeding levels evaluated were as follows:
- Fed at 6.0% ad libitum
- Fed at 16.8% ad libitum
- Fed at 25.9% ad libitum
- Fed at 30.7% ad libitum
Four Angus steers of similar weight (mean = 650 ± 41 pounds) were used in a 4 × 4 Latin square design. Estimates of dry matter intake and digestibility of dry matter and fiber were obtained using standard procedures (Appendix GP-2).
The proportion of stem and ‘other’ (mainly leaf tissue) present in the weighback was determined by hand separation. The particle-size characteristics of fecal samples from the digestive phase were determined by sieving (Appendix GP-5). Nutritive value determination of the as-fed hay and weighback and chemical composition of fecal samples were conducted by standard procedures (Appendix GP-7). The data were analyzed statistically according to the experimental design (Appendix GP-8).
Results and Discussion
Increasing ad libitum feeding of flaccidgrass from 6% to 31% linearly increased actual dry matter intake from 6.2 to 13.1 pounds per day or from 0.99 to 1.95 pounds per 100 pounds of body weight (Table 15.1). Associated was a quadratic decline in dry matter digestibility and neutral detergent fiber and its constituent fiber fractions. The quadratic response is associated with the increase in dry matter digestibility and fiber digestibility at the 31% ad libitum feeding. Digestible intakes of dry matter and neutral detergent fiber and its constituent fiber fractions increased linearly with increased feeding level and consistent with dry matter intake (Table 15.1).
The in vitro dry matter disappearance of the experimental hays averaged 56%, with crude protein concentrations averaging 9.8% and neutral detergent fiber 73.7% (Table 15.2). These values are consistent with mature flaccidgrass. The difference values (weighback concentration minus as-fed concentration) indicate that selective consumption occurred, with the weighback being greater in neutral detergent fiber and lesser in in vitro dry matter disappearance and crude protein compared with the as-fed hay. Selectivity, however, decreased linearly, as noted by difference values for all of these variables with each increasing level of feeding (Table 15.2).
Examination of the weighback indicated a linear decrease in proportion of stem and a linear increase in proportion of leaf with increasing level of feeding. This supports the decline in selective consumption noted above. Consequently, neutral detergent fiber concentration of the stem weighback declined linearly, while in vitro dry matter disappearance of the ‘other’ fraction increased, which is indicative of a greater component of leaf tissue (Table 15.3).
Increasing feeding level did not alter median particle size of the feces (mean = 0.19), but quadratically altered the proportion of large (mean = 0.5%), medium (mean = 14.7%), and small (mean = 84.9%) particle-size classes (Table 15.4). This response is consistent with the estimates of digestibility (Table 15.1), further indicating that a shift in diet composition occurred at the greatest level of ad libitum feeding.
Summary and Conclusions
- Steers readily consumed mature flaccidgrass, although dry matter intake was limited.
- Increasing level of feeding from 6% to 31% ad libitum intake increased dry matter intake from 6.2 pounds per day to 18.8 pounds per day or from 0.99 pounds per 100 pounds body weight to 1.95 pounds per 100 pounds body weight.
- The digestibility of dry matter gave a quadratic response with increased level of feeding, declining from 58.3% at 6% ad libitum to 53.2% at 26% ad libitum feeding, then increasing to 55.1% at 31% ad libitum feeding.
- Nutritive value of headed flaccidgrass can be limited, averaging 56.0% in in vitro dry matter disappearance, 9.8% in crude protein, and 73.7 % in neutral detergent fiber.
- Selective consumption occurred by steers, with weighback decreasing linearly in proportion of stem and increasing in proportion of the ‘other’ fraction.
- Flaccidgrass has a role in ruminant production systems, but cutting when headed results in forage that is of limited value for growing animals.
| Fed | Intake | Digestibilities1 | Digestible Intakes | ||||||||||
|---|---|---|---|---|---|---|---|---|---|---|---|---|---|
| Ad Lib (%) |
Actual (lb/d) |
Actual (lb/d) |
Actual (lb/100 lb2) |
DM (%) |
NDF (%) |
ADF (%) |
HEMI (%) |
CELL (%) |
DM (lb/100 lb2) |
NDF (lb/100 lb2) |
ADF (lb/100 lb2) |
HEMI (lb/100 lb2) |
CELL (lb/100 lb2) |
| 6.0 | 6.6 | 6.23 | 0.99 | 58.3 | 60.6 | 55.2 | 67.6 | 64.7 | 0.57 | 0.44 | 0.22 | 0.22 | 0.21 |
| 16.8 | 13.3 | 11.1 | 1.66 | 55.0 | 57.6 | 51.4 | 65.1 | 61.5 | 0.92 | 0.69 | 0.33 | 0.36 | 0.32 |
| 25.9 | 15.1 | 11.3 | 1.71 | 53.2 | 55.7 | 49.4 | 63.2 | 59.8 | 0.92 | 0.69 | 0.33 | 0.36 | 0.32 |
| 30.7 | 18.8 | 13.1 | 1.95 | 55.1 | 57.9 | 52.0 | 65.0 | 62.2 | 1.08 | 0.81 | 0.39 | 0.42 | 0.38 |
| Significance (P): | |||||||||||||
| Treatment | <0.01 | 0.01 | 0.01 | 0.02 | 0.01 | 0.01 | 0.04 | 0.03 | 0.03 | 0.04 | 0.02 | 0.03 | |
| Linear | <0.01 | <0.01 | 0.01 | 0.02 | 0.02 | 0.01 | 0.07 | 0.01 | 0.01 | 0.01 | 0.01 | 0.01 | |
| Quadratic | 0.17 | 0.17 | <0.01 | 0.01 | 0.01 | 0.01 | 0.02 | 0.33 | 0.34 | 0.43 | 0.27 | 0.41 | |
| Lack of Fit | 0.21 | 0.25 | 0.49 | 0.40 | 0.45 | 0.33 | 0.59 | 0.23 | 0.23 | 0.23 | 0.23 | 0.25 | |
1 NDF = neutral detergent fiber; ADF = acid detergent fiber; HEMI = hemicellulose; CELL = cellulose. ↲
2 Body weight basis. ↲
3 Each value is the mean of four steers. ↲
| Fed | IVDMD | CP | NDF | Fiber Fractions | |||||||
|---|---|---|---|---|---|---|---|---|---|---|---|
| Ad Lib (%) |
Actual (lb/d) |
AF (%) |
DV2 (%) |
AF (%) |
DV (%) |
AF (%) |
DV (%) |
ADF (%) |
HEMI (%) |
CELL (%) |
Lignin (%) |
| 6.0 | 6.6 | 56.03 | -13.54 | 9.83 | -4.24 | 73.73 | 7.24 | 41.13 | 32.63 | 33.33 | 6.63 |
| 16.8 | 13.3 | 56.0 | -11.8 | 9.8 | -4.3 | 73.7 | 6.9 | 41.1 | 32.6 | 33.3 | 6.6 |
| 25.9 | 15.1 | 56.0 | -8.4 | 9.8 | -3.6 | 73.7 | 5.4 | 41.1 | 32.6 | 33.3 | 6.6 |
| 30.7 | 18.8 | 56.0 | -6.6 | 9.8 | -3.4 | 73.7 | 4.7 | 41.1 | 32.6 | 33.3 | 6.6 |
| Significance (P): | |||||||||||
| Treatment | <0.01 | 0.14 | 0.03 | ||||||||
| Linear | <0.01 | 0.04 | 0.01 | ||||||||
| Quadratic | 0.94 | 0.67 | 0.72 | ||||||||
| Lack of Fit | 0.35 | 0.34 | 0.42 | ||||||||
1 CP = crude protein; NDF = neutral detergent fiber; ADF = acid detergent fiber; HEMI = hemicellulose; CELL = cellulose. ↲
2 DV = difference value (weighback concentration minus AF concentration). ↲
3 Each value is the mean of a composite sample from four periods. ↲
4 Values are the mean of four samples. ↲
| Fed | Stem | Other | |||||||
|---|---|---|---|---|---|---|---|---|---|
| Ad Lib2 (%) |
Actual (lb/d) |
Prop (%) |
IVDMD (%) |
CP (%) |
NDF (%) |
Prop (%) |
IVDMD (%) |
CP (%) |
NDF (%) |
| 6.0 | 6.6 | 87.02 | 39.6 | 2.7 | 82.0 | 13.0 | 51.0 | 10.0 | 70.2 |
| 16.8 | 13.3 | 86.3 | 40.7 | 2.7 | 81.9 | 13.7 | 56.9 | 9.3 | 70.4 |
| 25.9 | 15.1 | 82.2 | 42.3 | 2.8 | 81.6 | 17.8 | 55.8 | 10.1 | 69.7 |
| 30.7 | 18.8 | 75.2 | 40.7 | 2.7 | 80.7 | 24.8 | 58.6 | 10.2 | 69.4 |
| Significance (P): | |||||||||
| Treatment | 0.08 | 0.36 | 0.97 | 0.02 | 0.08 | 0.02 | 0.48 | 0.56 | |
| Linear | 0.02 | 0.31 | 0.99 | <0.01 | 0.02 | <0.01 | 0.40 | 0.31 | |
| Quadratic | 0.30 | 0.21 | 0.86 | 0.10 | 0.30 | 0.22 | 0.40 | 0.70 | |
| Lack of Fit | 0.96 | 0.43 | 0.69 | 0.65 | 0.96 | 0.08 | 0.28 | 0.55 | |
1 IVDMD = in vitro dry matter disappearance; CP = crude protein; NDF = neutral detergent fiber. ↲
2 Each value is the mean of four samples. ↲
| Fed | MPS (mm) |
Particle-size Class1 | |||
|---|---|---|---|---|---|
| Ad Lib (%) |
Actual (lb/d) |
Large (%) |
Medium (%) |
Small (%) |
|
| 6.0 | 6.6 | 0.192 | 0.5 | 17.0 | 82.5 |
| 16.8 | 13.3 | 0.17 | 0.2 | 14.5 | 85.3 |
| 25.9 | 15.1 | 0.20 | 0.2 | 12.3 | 87.5 |
| 30.7 | 18.8 | 0.19 | 0.6 | 15.2 | 84.2 |
| Significance (P): | |||||
| Treatment | 0.47 | 0.01 | 0.09 | 0.08 | |
| Linear | 0.54 | 0.25 | 0.17 | 0.20 | |
| Quadratic | 0.98 | <0.01 | 0.04 | 0.03 | |
| Lack of Fit | 0.15 | 0.87 | 0.39 | 0.41 | |
1 Large = ≥ 1.7 mm; Medium = < 1.7 and ≥ 0.5mm; Small = < 0.5 mm. ↲
2 Each value is the mean of four samples. ↲
IV. Evaluation Among a Legume and Cool-Season and Warm-Season Grasses
Experiment 16. Alfalfa, Warm-Season and Cool-Season Grasses: Differences in Nutritive Value and Quality
Legumes differ in both anatomy and morphology compared with grasses, and perennial warm-season and cool-season grasses differ in both their anatomical development and their rate of physiological development. These differences greatly influence the nutritive value of the developing forage mass and consequently forage quality as revealed in animal daily responses, including aspects of forage digestibility.
Our objective in this experiment was to compare the nutritive value and subsequent quality of alfalfa with perennial warm-season bermudagrass and two cool-season perennial grasses, orchardgrass and tall fescue, and to make comparisons among the three grasses.
Materials and Methods
The experimental hays consisted of a generic alfalfa purchased from a producer west of Raleigh, NC, a warm-season Coastal bermudagrass purchased from a producer east of Raleigh, and two cool-season grasses produced at the NC State University Reedy Creek Road Field Laboratory. The cool-season grasses consisted of Boone orchardgrass and Kenhy tall fescue. Treatments evaluated were as follows:
- Alfalfa hay, cut at the 25% bloom stage
- Coastal bermudagrass, cut at the heading stage
- Boone orchardgrass, cut in the boot stage
- Kenhy tall fescue, cut in the boot stage
All hays were cut from well-established stands. At initiation of growth, the three grasses were top-dressed with approximately 70 pounds of nitrogen per acre in preparation for production of the experimental hays. Orchardgrass and tall fescue were cut May 21 and 22, respectively, followed by alfalfa on June 12 and bermudagrass on July 20. All hays were cut using a mower-conditioner, field cured, and square baled with a conventional square baler. The bales were stored on wooden pallets in an experimental-hay storage barn at the NC State University Forage-Animal Metabolism Unit in Raleigh, NC, until feeding. Hays were processed prior to feeding using standard procedures (Appendix GP-1).
Two experiments were conducted consisting of an intake and digestibility experiment (Experiment 16A) and a mastication experiment (Experiment 16B). In Experiment 16A, a 4 × 4 Latin square design was used. Four Angus steers of similar weight (mean = 513 ± 7.3 pounds) were used and assigned at random to one of the treatments in period one. Intake and digestibility estimates were obtained by standard procedures (Appendix GP-2). During the digestibility phase, external markers were administered orally to obtain estimates of digesta kinetics and fecal output. Cobalt was used to obtain estimates of the rate of passage and mean retention time of the liquid phase. Two markers, chromium (Cr) and ytterbium (Yb), were used to determine rate of passage and mean retention time of the solid phase, as well as total gastrointestinal fill (FILL) and fecal output (Appendix GP-6).
Experiment 16B was conducted with esophageally cannulated steers to evaluate masticate characteristics. A 4 × 4 Latin square design was also used, with each forage evaluated two times each day for two consecutive days. Masticate dry matter was sieved to determine median particle size and proportion of large, medium, and small particle-size classes. Fecal samples obtained from the digestibility phase were also sieved to obtain particle-size distribution among forage species (Appendices GP-3 and GP-5).
All as-fed and weighback samples were analyzed for nutritive value and fecal samples for chemical composition according to standard procedures (Appendix GP-7). All data were analyzed statistically according to the experimental design (Appendix GP-8).
Results and Discussion
Experiment 16A
The four forages compared represent a wide range in plant morphology, anatomy, and physiological growth, and many differences in animal responses are expected. Steers were fed each hay similarly, averaging 14.3% excess, and consumed alfalfa in greatest amounts at 2.85 pounds per 100 pounds of body weight compared with 2.09 pounds for the grasses. Further, bermudagrass was consumed at 2.32 pounds per 100 pounds of body weight and greater than the cool-season grasses (orchardgrass and tall fescue) at 1.89 pounds per 100 pounds of body weight, which were similar (Table 16.1). As expected, the associated dry matter digestibilities were greatest for alfalfa (64.2%) and least for bermudagrass (53.5%), with the cool-season grasses greater than bermudagrass and similar (mean 58.1%). The lowest digestibility of bermudagrass results in a digestible dry matter intake similar to that of the cool-season grasses and least compared with that of alfalfa.
The digestibility of the neutral detergent fiber and constituent fiber fractions of alfalfa were generally greater, compared with the grasses, and bermudagrass was generally inferior to the cool-season grasses—although the greater dry matter intake noted for bermudagrass is reflected in greater digestible intake of neutral detergent fiber and hemicellulose.
The as-fed hay of alfalfa was greater in in vitro dry matter disappearance and crude protein and lignin and lesser in neutral detergent fiber, acid detergent fiber, hemicellulose, and cellulose compared with the grasses and consistent with expectations (Table 16.2). Also, consistent with expectations, is the lesser concentrations in in vitro dry matter disappearance and greater concentrations in neutral detergent fiber of bermudagrass compared with the cool-season grasses. And generally, orchardgrass was of greater nutritive value than tall fescue. The difference values indicate some degree of selective consumption: greater concentrations of neutral detergent fiber in the weighback (positive values) and lesser concentrations in in vitro dry matter disappearance and crude protein (negative values), but difference values were generally not influenced by forage species (Table 16.2).
Digesta kinetics also revealed differences among forage species (Table 16.3). Alfalfa was generally different compared with the grasses, having a greater rate of passage and lesser retention time for the liquid phase and lesser retention time for the solid phase. The FILL was similar among species, but actual fecal output was greater for alfalfa and consistent with greater dry matter intake. Differences for the solid phase were evident, whether determined by chromium or ytterbium. Differences among the grasses were limited. Bermudagrass had a greater rate of passage and actual fecal output, consistent with greater dry matter intake, compared with the cool-season grasses. Orchardgrass and tall fescue had similar digesta kinetics with only one difference noted, being mean retention time, which was greater for tall fescue.
We examined the association between markers to predict fecal output and the relationship between predicted and actual fecal output. The relationship between predicted and actual fecal output, although only based on four means, was strong in this study for both chromium (r = 0.93; P = 0.07) and ytterbium (r = 0.97; P = 0.03). Consequently, the relationship between fecal output predicted by chromium and ytterbium was also positive (r = 0.83; P = 0.17), indicating that either could be used as a marker for estimating fecal output.
Experiment 16B
Determination of masticate particle-size characteristics of the hays revealed that alfalfa had greatest median particle size compared with the grasses and bermudagrass had smaller particles compared with the similar cool-season grasses (Table 16.4). Consequently, alfalfa masticate had the greatest proportion of large particles and least proportion of medium particles, whereas bermudagrass masticate had the least proportion of large particles and the greatest proportion of medium and small particles. This is consistent with the fine stem and leaf characteristics of bermudagrass compared with orchardgrass and tall fescue.
Summary and Conclusions
- Steers readily consumed all four forages.
- Alfalfa was consumed in greatest amounts, consistent with its greatest dry matter and neutral detergent fiber digestibilities.
- Among the grasses, bermudagrass was consumed in greatest amounts but had least dry matter and neutral detergent fiber digestibilities.
- Alfalfa had greatest digestible dry matter intake compared with the grasses, and the digestible dry matter intake of bermudagrass was similar to that of the other grasses because of its least dry matter digestibility.
- The greatest dry matter intake among the grasses was noted for bermudagrass, which had the least dry matter digestibility, and is attributed to its fine stem and leaf characteristic as evidenced by its smallest median masticate particle size—resulting in least large particles and most medium and small particles, as well as greatest fecal output.
- The quality (dry matter intake and dry matter digestibility) of orchardgrass and tall fescue was generally similar, although the nutritive value of the orchardgrass was usually greater compared with tall fescue.
- Either of the inert markers, chromium or ytterbium, were effective in estimating digesta kinetics and fecal output in approximating the dry matter intake of an animal, but fecal output estimated by ytterbium was more strongly correlated with actual fecal output than that estimated by chromium.
- All four forages can be advantageously used in ruminant production systems, and their agronomic and nutritive value and quality characteristics need to be understood for proper incorporation and management in a feeding system.
| Species | DMI (lb/100 lb2) |
Digestibilities1 | Digestible Intakes | ||||||||
|---|---|---|---|---|---|---|---|---|---|---|---|
| DM (%) |
NDF (%) |
ADF (%) |
HEMI (%) |
CELL (%) |
DM (lb/100 lb2) |
NDF (lb/100 lb2) |
ADF (lb/100 lb2) |
HEMI (lb/100 lb2) |
CELL (lb/100 lb2) |
||
| Alfalfa (AL) | 2.853 | 64.2 | 65.0 | 59.7 | 72.3 | 67.1 | 1.83 | 1.08 | 0.65 | 0.41 | 0.54 |
| Bermudagrass (BG) | 2.32 | 53.5 | 53.7 | 51.2 | 54.9 | 61.2 | 1.24 | 0.94 | 0.42 | 0.51 | 0.39 |
| Orchardgrass (OG) | 1.99 | 58.2 | 56.9 | 53.1 | 62.4 | 62.3 | 1.15 | 0.77 | 0.44 | 0.33 | 0.41 |
| Tall fescue (TF) | 1.78 | 57.9 | 58.1 | 54.3 | 63.9 | 62.9 | 1.03 | 0.75 | 0.43 | 0.31 | 0.41 |
| Significance (P): | |||||||||||
| Species | <0.01 | <0.01 | <0.01 | 0.08 | 0.01 | 0.32 | <0.01 | 0.01 | <0.01 | 0.01 | 0.03 |
| AL vs. (BG+OG+TF)/3 | <0.01 | <0.01 | <0.01 | 0.02 | <0.01 | 0.09 | <0.01 | <0.01 | <0.01 | 0.41 | 0.01 |
| BG vs. (OG+TF) | <0.01 | <0.01 | 0.03 | 0.33 | 0.02 | 0.62 | 0.06 | 0.01 | 0.68 | <0.01 | 0.72 |
| OG vs. TF | 0.09 | 0.75 | 0.42 | 0.66 | 0.65 | 0.84 | 0.14 | 0.74 | 0.80 | 0.79 | 0.89 |
| MSD4 | 0.241 | 2.75 | 3.52 | 6.94 | 7.32 | 8.35 | 0.177 | 0.150 | 0.089 | 0.103 | 0.099 |
1 NDF = neutral detergent fiber; ADF = acid detergent fiber; HEMI = hemicellulose; CELL = cellulose. ↲
2 Body weight basis. ↲
3 Each value is the mean of four steers. ↲
4 MSD = minimum significant difference from the Waller-Duncan k-ratio (k = 100) t-test and can be used to compare any two treatments. ↲
| Species | IVDMD | CP | NDF | Fiber Fractions | ||||||
|---|---|---|---|---|---|---|---|---|---|---|
| AF (%) |
DV2 (%) |
AF (%) |
DV (%) |
AF (%) |
DV (%) |
ADF (%) |
HEMI (%) |
CELL (%) |
Lignin (%) |
|
| Alfalfa (AL) | 58.43 | -4.9 | 16.9 | -2.7 | 58.9 | 5.3 | 38.7 | 20.3 | 28.6 | 9.2 |
| Bermudagrass (BG) | 44.8 | -3.0 | 14.5 | 1.0 | 74.9 | -0.5 | 35.0 | 39.9 | 27.6 | 6.9 |
| Orchardgrass (OG) | 58.7 | -2.2 | 10.2 | -0.9 | 68.3 | 1.6 | 41.7 | 26.6 | 33.3 | 7.4 |
| Tall fescue (TF) | 50.2 | -2.5 | 8.6 | -1.0 | 72.4 | 2.1 | 44.7 | 27.7 | 36.4 | 7.5 |
| Significance (P): | ||||||||||
| Species | <0.01 | 0.71 | <0.01 | 0.33 | <0.01 | 0.19 | <0.01 | <0.01 | <0.01 | <0.01 |
| AL vs. (BG+OG+TF)/3 | <0.01 | 0.29 | <0.01 | 0.16 | <0.01 | 0.06 | 0.04 | <0.01 | <0.01 | <0.01 |
| BG vs. (OG+TF) | <0.01 | 0.77 | <0.01 | 0.26 | <0.01 | 0.29 | <0.01 | <0.01 | <0.01 | 0.08 |
| OG vs. TF | <0.01 | 0.93 | 0.15 | 0.96 | 0.01 | 0.83 | 0.01 | <0.01 | 0.01 | 0.74 |
| MSD4 | 3.3 | 2.4 | 2.4 | 2.0 | 1.6 | 1.5 | 0.7 | |||
1 CP = crude protein; NDF = neutral detergent fiber; ADF = acid detergent fiber; HEMI = hemicellulose; CELL = cellulose. ↲
2 DV = difference value (weighback concentration minus AF concentration). ↲
3 Each value is the mean of four steers. ↲
4 MSD = minimum significant difference from the Waller-Duncan k-ratio (k = 100) t-test and can be used to compare any two treatments. ↲
| Species | Cobalt Liquid Phase | Chromium | Ytterbium | |||||||||
|---|---|---|---|---|---|---|---|---|---|---|---|---|
| Solid Phase | Fecal output1 | Solid Phase | Fecal output | |||||||||
| ROP2 (per hr) |
MRT3 (hrs) |
ROP (per hr) |
MRT (hrs) |
FILL4 (lb/100 lb5) |
Pred. (lb/100 lb5) |
Act. (lb/100 lb5) |
ROP (per hr) |
MRT (hrs) |
FILL (lb/100 lb5) |
Pred. (lb/100 lb5) |
Act. (lb/100 lb5) |
|
| Alfalfa (AL) | 0.1186 | 17.0 | 0.036 | 53.2 | 0.68 | 0.58 | 0.91 | 0.043 | 48.5 | 0.76 | 0.77 | 0.91 |
| Bermudagrass (BG) | 0.091 | 20.9 | 0.031 | 71.2 | 0.74 | 0.51 | 0.94 | 0.038 | 64.8 | 0.94 | 0.87 | 0.94 |
| Orchardgrass (OG) | 0.095 | 19.6 | 0.028 | 68.0 | 0.59 | 0.39 | 0.74 | 0.035 | 57.7 | 0.79 | 0.65 | 0.74 |
| Tall fescue (TF) | 0.090 | 20.6 | 0.025 | 74.0 | 0.58 | 0.35 | 0.66 | 0.031 | 64.3 | 0.80 | 0.58 | 0.66 |
| Significance (P): | ||||||||||||
| Species | 0.04 | 0.01 | 0.24 | 0.01 | 0.44 | <0.01 | 0.01 | <0.01 | <0.01 | 0.14 | <0.01 | 0.01 |
| AL vs. (BG+OG+TF) | 0.01 | <0.01 | 0.09 | <0.01 | 0.67 | <0.01 | 0.04 | <0.01 | <0.01 | 0.19 | 0.12 | 0.04 |
| BG vs. (OG+TF) | 0.90 | 0.32 | 0.33 | 0.95 | 0.14 | <0.01 | <0.01 | 0.01 | 0.06 | 0.05 | <0.01 | <0.01 |
| OG vs. TF | 0.54 | 0.26 | 0.66 | 0.15 | 0.96 | 0.24 | 0.24 | 0.08 | 0.01 | 0.92 | 0.16 | 0.24 |
| MSD7 | 0.021 | 2.03 | 0.013 | 8.86 | 0.29 | 0.09 | 0.15 | 0.005 | 4.6 | 0.19 | 0.11 | 0.15 |
1 Pred. = predicted fecal output using inert marker; Act. = actual measured fecal output. ↲
2 ROP = rate of passage. ↲
3 MRT = mean retention time. ↲
4 FILL = whole gastrointestinal tract dry matter. ↲
5 Body weight basis. ↲
6 Each value is the mean of four steers. ↲
7 MSD = minimum significant difference from the Waller-Duncan k-ratio (k = 100) t-test and can be used to compare any two treatments. ↲
| Species | MPS (mm) |
Particle–size Classes1 | ||
|---|---|---|---|---|
| Large (%) |
Medium (%) |
Small (%) |
||
| Alfalfa (AL) | 1.42 | 38.7 | 48.3 | 13.0 |
| Bermudagrass (BG) | 0.9 | 11.7 | 70.1 | 18.2 |
| Orchardgrass (OG) | 1.3 | 34.0 | 52.4 | 13.6 |
| Tall fescue (TF) | 1.3 | 35.6 | 51.7 | 12.7 |
| Significance (P): | ||||
| Species | <0.01 | <0.01 | <0.01 | 0.11 |
| AL vs. (BG+OG+TF)/3 | 0.02 | <0.01 | <0.01 | 0.33 |
| BG vs. (OG+TF) | <0.01 | <0.01 | <0.01 | 0.03 |
| OG vs. TF | 0.77 | 0.61 | 0.80 | 0.68 |
| MSD3 | 0.17 | 6.97 | 6.30 | 5.45 |
1 Large ≥ 1.7 mm; medium < 1.7 mm and ≥ 0.5 mm; small < 0.5 mm. ↲
2 Each value is the mean of four steers. ↲
3 MSD = minimum significant difference from the Waller-Duncan k-ratio (k = 100) t-test and can be used to compare any two treatments. ↲
Experiment 17. Alfalfa: A Crude Protein Source in Switchgrass Hay Diets
Switchgrass cut for hay at the frequently recommended stage of early to late boot—to maintain adequate nutritive value and maximize dry matter yield—is still frequently lacking in crude protein concentrations to meet the needs of many classes of ruminants. We conducted this experiment to determine the influence on steer intake and hay digestibility when feeding increasing proportions of alfalfa as a protein source in a switchgrass hay diet.
Materials and Methods
A well-established stand of Alamo switchgrass located at the NC State University Reedy Creek Road Field Laboratory on the west edge of Raleigh was the source of the switchgrass hay. The previous fall’s residue was removed in early March with a flail harvester set to a 3-inch stubble. The field was then top-dressed with 70 pounds of nitrogen per acre. The resulting forage was cut in early to late boot with a mower-conditioner set to a 5-inch stubble, field cured, and baled with a conventional square baler.
A well-established stand of Cimarron alfalfa located at the NC State University Lake Wheeler Field Laboratory on the southern edge of Raleigh was the source of the alfalfa hay. The forage was cut to a 4-inch stubble in mid bloom, field cured, and baled with a conventional square baler. Bales of both forages were transported to the NC State University Forage-Animal Metabolism Unit in Raleigh, NC, stored on wooden pallets in an experimental-hay barn, and processed according to standard procedures (Appendix GP-1) prior to feeding. Four treatments were evaluated and consisted of the following:
- 100% switchgrass
- 75% switchgrass and 25% alfalfa
- 50% switchgrass and 50% alfalfa
- 25% switchgrass and 75% alfalfa
The increasing proportion of alfalfa, a legume, in treatments 2, 3, and 4 was based on weight, with the appropriate amounts of switchgrass and alfalfa combined in a Davis Precision horizontal batch mixer and mixed until homogeneous prior to feeding.
Twenty Angus steers (mean weight = 539 ± 42 pounds) were used in the experiment. The animals were grouped by fours according to weight and randomly assigned to each hay treatment in a randomized complete block design with five steers (replicates) per treatment. Dry matter intake and digestibility estimates were obtained using standard procedures (Appendix GP-2), and animals were fed at an actual average excess of 13.8% during the experiment.
All as-fed and weighback samples were analyzed for nutritive value and fecal samples for chemical composition according to standard procedures (Appendix GP-7). The data were analyzed statistically according to the experimental design (Appendix GP-8).
Results and Discussion
Steers fed only switchgrass hay consumed 1.57 pounds per 100 pounds of body weight, with dry matter digestibility averaging 53.3% (Table 17.1). Increasing alfalfa in the hay from none to 75% increased dry matter intake from 1.57 to 2.87 pounds per 100 pounds of body weight, giving a cubic response. This response is attributed to little increase in dry matter intake between the 25% and 50% contributions of alfalfa to the as-fed hay. Increasing alfalfa, however, increased dry matter digestibility linearly from 53.3% to 59.9% and is reflected in digestible intakes of dry matter, neutral detergent fiber, acid detergent fiber, and cellulose, while hemicellulose was not altered (Table 17.1).
The nutritive value of the as-fed switchgrass hay alone averaged 57.8% in vitro dry matter disappearance, 4.6% crude protein, and 76.1% neutral detergent fiber (Table 17.2). Adding alfalfa in proportions up to 75% of the switchgrass hay increased in vitro true dry matter disappearance from 57.8 to 69.4%, crude protein from 4.6 to 15.1%, and reduced neutral detergent fiber from 76.1 to 53.1%. The reduction in neutral detergent fiber was also reflected in its constituent fiber fractions of acid detergent fiber, hemicellulose, and cellulose, although lignin concentrations increased from 5.4 to 6.7%. The lignin increase is consistent with greater concentrations of lignin in legumes compared with grasses. These shifts in nutritive value are consistent with the changes noted for steer dry matter intake and dry matter digestibility (Table 17.2).
The difference values (concentration of weighback minus concentration of as-fed hay) for in vitro true dry matter disappearance indicates increased selective consumption for the 25% and 50% alfalfa treatments, whereas difference values for crude protein and neutral detergent fiber were not altered (Table 17.2). This apparent shift in eating behavior may be, in part, reflected in the lesser difference in dry matter intake for the 25% and 50% alfalfa treatments.
The influence of alfalfa on the switchgrass hay diet was also reflected in fecal composition, with crude protein increasing linearly from 6.2 to 11.8% and neutral detergent fiber decreasing linearly from 72.7 to 59.1 % (Table 17.3). Likewise, the constituent fiber fractions of neutral detergent fiber decreased in the feces, whereas lignin and ash concentrations increased.
Summary and Conclusions
- Steers readily consumed switchgrass and the switchgrass-alfalfa mixed hays.
- Switchgrass hay alone was inadequate in crude protein for ruminant performance, averaging 4.6% with neutral detergent fiber concentrations of 76.1%.
- The incorporation of alfalfa from none to a 75% proportion into the switchgrass hay increased crude protein from 4.6 to 15.1 % and decreased neutral detergent fiber from 76.1 to 53.1%.
- Dry matter intake increased from 1.57 pounds per 100 pounds body weight from switchgrass alone to 2.87 with 75% alfalfa, and dry matter digestibility increased from 53.3 to 59.9%.
- The increase in crude protein from the addition of alfalfa to the switchgrass hay diet increased the crude protein concentration in the feces from 6.2% for switchgrass alone to 11.8% with 75% alfalfa.
- Alfalfa can be fed in mixtures with switchgrass to provide an on-farm biological source of crude protein that meets the growth-response requirements of ruminants.
| Treatment | DMI (lb/100 lb2) |
Digestibility1 | Digestible Intakes | |||||||||
|---|---|---|---|---|---|---|---|---|---|---|---|---|
| SG (% DM) |
AL (% DM) |
DM (%) |
NDF (%) |
ADF (%) |
HEMI (%) |
CELL (%) |
DM (lb/100 lb2) |
NDF (lb/100 lb2) |
ADF (lb/100 lb2) |
HEMI (lb/100 lb2) |
CELL (lb/100 lb2) |
|
| 100 | 0 | 1.573 | 53.3 | 55.6 | 55.1 | 56.3 | 59.8 | 0.83 | 0.66 | 0.37 | 0.30 | 0.34 |
| 75 | 25 | 2.31 | 53.6 | 51.2 | 49.5 | 53.5 | 55.4 | 1.24 | 0.80 | 0.46 | 0.33 | 0.43 |
| 50 | 50 | 2.48 | 54.3 | 51.4 | 50.3 | 53.2 | 57.5 | 1.35 | 0.77 | 0.48 | 0.29 | 0.44 |
| 25 | 75 | 2.87 | 59.9 | 54.2 | 52.5 | 56.8 | 60.4 | 1.72 | 0.83 | 0.52 | 0.31 | 0.47 |
| Significance (P): | ||||||||||||
| Treatment | <0.01 | 0.09 | 0.44 | 0.40 | 0.50 | 0.39 | <0.01 | 0.13 | 0.04 | 0.32 | 0.05 | |
| Linear | <0.01 | 0.03 | 0.70 | 0.54 | 0.89 | 0.70 | <0.01 | 0.05 | <0.01 | 0.91 | 0.01 | |
| Quadratic | 0.06 | 0.20 | 0.12 | 0.13 | 0.14 | 0.12 | 0.81 | 0.43 | 0.42 | 0.53 | 0.29 | |
| Lack of fit4 | 0.05 | 0.64 | 0.83 | 0.66 | 0.89 | 0.58 | 0.09 | 0.28 | 0.48 | 0.08 | 0.45 | |
1 NDF = neutral detergent fiber; ADF = acid detergent fiber; HEMI = hemicellulose; CELL = cellulose. ↲
2 Body weight basis. ↲
3 Each value is the mean of five steers. ↲
4 Cubic response. ↲
| Treatment | IVTD | CP | NDF | Fiber Fractions | |||||||
|---|---|---|---|---|---|---|---|---|---|---|---|
| SG (% DM) |
AL (% DM) |
AF2 (%) |
DV2 (%) |
AF (%) |
DV (%) |
AF (%) |
DV (%) |
ADF (%) |
HEMI (%) |
CELL (%) |
Lignin (%) |
| 100 | 0 | 57.83 | -1.7 | 4.6 | -0.0 | 76.1 | -0.3 | 42.6 | 33.5 | 36.7 | 5.4 |
| 75 | 25 | 60.4 | 3.5 | 8.7 | -0.4 | 67.5 | 0.7 | 40.0 | 27.5 | 33.3 | 6.2 |
| 50 | 50 | 64.0 | -4.2 | 12.0 | 0.1 | 60.6 | 0.9 | 37.8 | 22.8 | 30.4 | 6.6 |
| 25 | 75 | 69.4 | -0.9 | 15.1 | -0.6 | 53.1 | 1.0 | 34.2 | 18.9 | 26.6 | 6.7 |
| Significance (P): | |||||||||||
| Treatment | <0.01 | <0.01 | <0.01 | 0.24 | <0.01 | 0.70 | <0.01 | <0.01 | <0.01 | <0.01 | |
| Linear | <0.01 | 0.50 | <0.01 | 0.25 | <0.01 | 0.31 | <0.01 | <0.01 | <0.01 | <0.01 | |
| Quadratic | <0.01 | <0.01 | 0.02 | 0.75 | 0.25 | 0.60 | 0.19 | <0.01 | 0.57 | <0.01 | |
| Lack of fit4 | 0.68 | 0.82 | 0.62 | 0.10 | 0.28 | 0.87 | 0.31 | 0.65 | 0.27 | 0.74 | |
1 CP = crude protein; NDF = neutral detergent fiber; ADF = acid detergent fiber; HEMI = hemicellulose; CELL = cellulose. ↲
2 AF = as-fed; DV = difference value (weighback concentration minus AF concentration). ↲
3 Each value is the mean of five samples. ↲
4 Cubic response. ↲
| Treatment | CP (%) |
NDF (%) |
Fiber Fractions | |||||
|---|---|---|---|---|---|---|---|---|
| SG (% DM) |
AL (% DM) |
ADF (%) |
HEMI (%) |
CELL (%) |
Lignin (%) |
Ash (%) |
||
| 100 | 0 | 6.22 | 72.7 | 41.3 | 31.4 | 31.8 | 0.9 | 0.5 |
| 75 | 25 | 7.9 | 69.7 | 41.5 | 28.1 | 30.5 | 10.1 | 0.6 |
| 50 | 50 | 9.7 | 63.6 | 39.4 | 24.2 | 27.2 | 11.1 | 0.8 |
| 25 | 75 | 11.8 | 59.1 | 37.8 | 21.3 | 24.3 | 12.2 | 0.8 |
| Significance (P): | ||||||||
| Treatment | <0.01 | <0.01 | <0.01 | <0.01 | <0.01 | <0.01 | 0.01 | |
| Linear | <0.01 | <0.01 | <0.01 | <0.01 | <0.01 | <0.01 | <0.01 | |
| Quadratic | 0.31 | 0.27 | 0.03 | 0.58 | 0.06 | 0.89 | 0.42 | |
| Lack of fit3 | 0.80 | 0.12 | 0.10 | 0.30 | 0.18 | 0.86 | 0.44 | |
1 CP = crude protein; NDF = neutral detergent fiber; ADF = acid detergent fiber; HEMI = hemicellulose; CELL = cellulose. ↲
2 Each value is the mean of five samples. ↲
3 Cubic response. ↲
V. Evaluation of Preservation Methods on Nutritive Value and Quality of Perennial Grasses
Experiment 18. Flaccidgrass: The Influence of Drying Methods on its Nutritive Value and Quality
The method of drying used to preserve forage has been noted with traditional forages to alter their nutritive value and consequently their potential quality. This change has been observed in shifts in dry matter intake, digestibility, or both. Although having potential as a hay crop, flaccidgrass has not been widely grown nor evaluated for the influence drying methods might have on changes in the hay’s nutritive value. Our objective in this experiment was to determine the changes in nutritive value and quality of flaccidgrass when frozen and fed fresh or after artificially drying at ambient temperature and stepwise drying up to 190°F.
Materials and Methods
A well-established stand of flaccidgrass provided the experimental hays. The initial growth was cut for hay on July 20, and the field was top-dressed with 70 pounds of nitrogen per acre in preparation for the production of the experimental forages. Forage for all treatments was cut using a flail harvester set to a 2.5-inch stubble starting September 9 and completed September 11. Forage was in the boot stage at 30 inches of growth with some heads (< 5%) emerging. Treatments evaluated are noted below:
-
Fresh frozen: Forage was cut, immediately baled green at 16.7% dry matter, placed in plastic bags to prevent moisture loss, and placed in a freezer at -20°F until fed.
-
Freeze-dried: Forage was cut, immediately baled green at 16.7% dry matter, bale segments of about 4 inches placed in cloth bags for subsequent freeze-drying, placed into a freezer at 20°F until freeze-dried, and returned to the freezer until fed.
-
Ambient: Forage was cut, placed in a bulk drying barn at 23% dry matter, and dried at ambient temperature (60 to 70°F) with supplemental heat (75°F) applied toward the end of drying to remove wet spots.
-
Dried at 145°F: Forage was cut, placed in a bulk drying barn at 24.5% dry matter, and forced-air dried at 145°F.
-
Dried at 190°F: Forage was cut, placed in a bulk drying barn at 23.0% dry matter, and forced-air dried at 190°F.
All hays (except Treatments 1 and 2) were stored on wooden pallets in an experimental-hay barn at the NC State University Forage-Animal Metabolism Unit in Raleigh, NC, until fed. Prior to feeding, all hays were processed using standard procedures (Appendix GP-1).
Freezing and freeze-drying capacity limited the quantity of forage that could be preserved by these methodologies (Treatments 1 and 2). Consequently, two experiments were conducted. One experiment (Experiment 18A) used steers to evaluate dry matter intake and consisted of the three treatments that were processed through the bulk drying barn (Treatments 3, 4, and 5). A 3 × 3 Latin square design was used. Three steers of similar weight (mean = 495 ± 34 pounds) were assigned at random to a treatment in period one. The second experiment (Experiment 18B) was conducted with sheep to estimate whole-tract dry matter digestibility and digestibility of neutral detergent fiber and its fiber fractions of all five treatments. A 5 ×5 Latin square design was used for this experiment. Five crossbred wethers of similar weight (mean = 84 ± 5.1 pounds) were assigned at random to a treatment in period one. The intake experiment with steers and the digestibility experiment with sheep were conducted using standard procedures (Appendix GP-2).
The as-fed forage and weighback samples from both the intake and digestibility trials were analyzed for nutritive value and fecal samples for chemical composition, as well as the nitrogen fraction of the acid detergent fiber residue, according to standard procedures (Appendix GP-7). Total daily urine and feces were collected and total daily nitrogen excreted in urine and feces determined (Appendix GP-2). The data were analyzed statistically according to the experimental design (Appendix GP-8).
Results and Discussion
Experiment 18A
Dry matter intake by steers was not altered by increasing temperatures during forced-air drying, averaging 1.9 pounds per 100 pounds of body weight (Table 18.1). Animals in all treatments were fed similarly at about 13% excess. The nutritive value, however, of the as-fed forage was altered by increasing temperatures, although differences were generally small. Forage dried by ambient air was lesser in in vitro dry matter disappearance and greater in crude protein, acid detergent fiber, hemicellulose, and lignin compared with the forage dried by the hotter temperatures. Increasing drying temperature from 145° to 190°F reduced hemicellulose and increased the lignin concentration (Table 18.1).
Some selective consumption occurred as evident from the sign and magnitude of the difference values (weighback concentration minus concentration of as-fed hay). Concentration of neutral detergent fiber was positive, and in vitro dry matter disappearance and crude protein were negative and generally not altered by drying temperatures. The noted exception was crude protein, for which drying at 145°F had a lesser difference value compared with 190°F (Table 18.1).
Experiment 18B
Dry matter digestibilities, as fed to sheep, among the five preservation methods was altered only when the forage was fresh frozen and fed after being thawed (Table 18.2). In this case, digestibilities of dry matter and neutral detergent fiber, and the constituent fiber fractions of acid detergent fiber and hemicellulose, were less in the fresh frozen forage, with cellulose digestibility approaching significance.
The nutritive value of the as-fed forage was altered by preservation method. In general, drying at 145° or 190°F reduced in vitro dry matter disappearance and increased neutral detergent fiber and its fiber constituents as well as the nitrogen fraction of the acid detergent fiber (ADF-N) residue (Table 18.3). Fresh-frozen forage had least crude protein and ADF-N and greater neutral detergent fiber, acid detergent fiber, and cellulose compared with the freeze-dried and ambient-dried forages. Freeze-drying resulted in greatest in vitro dry matter disappearance and least crude protein, neutral detergent fiber, constituent fiber fractions of hemicellulose and lignin, and ADF-N compared with the ambient drying. And drying above 145°F reduced crude protein and hemicellulose concentrations.
The difference values indicate that selective consumption occurred, with neutral detergent fiber being positive, but difference values negative for in vitro dry matter disappearance and crude protein. In general, difference values were not altered by method of preservation. The noted exception was the difference value for crude protein being lesser when drying at 190°F versus 145°F.
The quantity of urine excreted was greatest for the fresh frozen forage and consistent with its high moisture concentration following thawing and is reflected in all comparisons in which fresh frozen forage was included (Table 18.4). The freeze-dried forage had greater urine excretion than the ambient treatment, as did forage dried at 190°F compared with 145°F. The greater urine excretions are attributed to greater water intake when digesting the respective forages. Nitrogen excreted in the urine was least for the freeze-dried and greatest for the ambient and 190°F treatments.
Total feces excreted were least for the fresh frozen forage and influenced comparisons that included the fresh frozen forage. The nitrogen excreted in the feces was least in the fresh frozen forage compared with freeze-dried and ambient treatments, and the freeze-dried forage was less compared with the ambient treatment. Some fecal compositional differences were noted, depending on the variable, but differences were small and probably of little biological importance (Table 18.4). The noted exception is the ADF-N, which was least for the freeze-dried treatment and with concentrations greatest for the other preservation methods. This may have implications regarding adequate nitrogen for use in other physiological processes in the animal.
Summary and Conclusions
- Both steers and wethers consumed all the preserved forages well. The exception was the fresh-frozen, which was fed only to wethers and varied to some extent in its consistency.
-
Dry matter intake of steers was not altered by increasing drying temperature, averaging 1.9 pounds per 100 pounds of body weight.
-
Dry matter digestibility and the digestibilities of neutral detergent fiber and its constituent fiber fractions estimated for all five treatments by feeding to wethers was least for fresh frozen and the other treatments similar.
-
The addition of heat during drying generally reduced in vitro dry matter disappearance and increased neutral detergent fiber and its fiber constituents, including ADF-N.
-
Selective consumption by both steers and wethers was evident, but preservation influences were generally not noted.
| Preservation Method | DM | IVDMD | CP | NDF | Constituent Fiber Fractions | |||||||
|---|---|---|---|---|---|---|---|---|---|---|---|---|
| Intake (lb/100 lb3) |
Excess (%) |
AF (%) |
DV2 (%) |
AF (%) |
DV (%) |
AF (%) |
DV2 (%) |
ADF (%) |
HEMI (%) |
CELL (%) |
Lignin (%) |
|
| Ambient (AB) | 1.964 | 13.0 | 56.3 | -10.6 | 13.7 | -4.2 | 70.1 | 5.3 | 37.8 | 32.3 | 31.7 | 5.1 |
| 145°F (145) | 1.88 | 13.8 | 58.4 | -11.8 | 12.5 | -4.0 | 69.5 | 6.9 | 37.3 | 32.2 | 31.5 | 4.7 |
| 190°F (190) | 1.88 | 12.9 | 58.1 | -13.2 | 12.9 | -4.8 | 68.5 | 6.5 | 37.3 | 31.2 | 31.4 | 5.0 |
| Significance (P): | ||||||||||||
| Preservation Method | 0.33 | 0.23 | 0.09 | 0.47 | 0.13 | 0.07 | 0.08 | 0.36 | 0.57 | 0.03 | 0.77 | 0.05 |
| AB vs. (145+190) | 0.18 | 0.45 | 0.05 | 0.34 | 0.07 | 0.29 | 0.07 | 0.19 | 0.31 | 0.04 | 0.53 | 0.07 |
| 145 vs. 190 | 0.95 | 0.13 | 0.63 | 0.49 | 0.35 | 0.04 | 0.13 | 0.71 | 0.99 | 0.02 | 0.75 | 0.05 |
1 IVDMD = in vitro dry matter disappearance; CP = crude protein; NDF = neutral detergent fiber; ADF = acid detergent fiber; HEMI = hemicellulose; CELL = cellulose. ↲
2 DV = difference value (Weighback concentration minus AF concentration). ↲
3 Body weight basis. ↲
4 Each value is the mean of three steers. ↲
| Preservation Method | Excess Fed (%) |
Digestibilities1 | ||||
|---|---|---|---|---|---|---|
| DM (%) |
NDF (%) |
ADF (%) |
HEMI (%) |
CELL (%) |
||
| Fresh frozen (FF) | 27.0 | 53.02 | 55.3 | 50.9 | 60.6 | 59.9 |
| Freeze-dried (FD) | 29.0 | 63.3 | 62.7 | 58.8 | 67.1 | 65.7 |
| Ambient (AB) | 28.6 | 60.2 | 63.0 | 56.0 | 70.5 | 62.9 |
| 145°F (145) | 30.6 | 59.9 | 62.1 | 54.7 | 70.0 | 62.4 |
| 190°F (190) | 31.5 | 57.7 | 60.0 | 53.4 | 67.3 | 61.3 |
| Significance (P): | ||||||
| Preservation Method | 0.62 | 0.14 | 0.09 | 0.18 | 0.02 | 0.27 |
| (FF+FD+AB) vs. other | 0.16 | 0.98 | 0.71 | 0.57 | 0.16 | 0.57 |
| FF vs. (FD+AB) | 0.49 | 0.02 | 0.01 | 0.03 | <0.01 | 0.07 |
| FD vs. AB | 0.89 | 0.42 | 0.90 | 0.37 | 0.23 | 0.29 |
| 145 vs. 190 | 0.79 | 0.55 | 0.46 | 0.69 | 0.35 | 0.67 |
1 NDF = neutral detergent fiber; ADF = acid detergent fiber; HEMI = hemicellulose; CELL = cellulose. ↲
2 Each value is the mean of five sheep. ↲
| Preservation Method | IVDMD | CP | NDF | Constituent Fiber Fractions | |||||||
|---|---|---|---|---|---|---|---|---|---|---|---|
| AF (%) |
DV2 (%) |
AF (%) |
DV (%) |
AF (%) |
DV (%) |
ADF (%) |
HEMI (%) |
CELL (%) |
Lignin (%) |
ADF-N (%) |
|
| Fresh frozen (FF) | 56.53 | -10.9 | 11.7 | -3.7 | 68.6 | 5.5 | 38.5 | 30.1 | 33.3 | 4.5 | 0.20 |
| Freeze-dried (FD) | 59.7 | -7.5 | 12.7 | -4.4 | 64.7 | 7.5 | 36.5 | 28.2 | 31.8 | 4.1 | 0.20 |
| Ambient (AB) | 55.9 | -7.8 | 14.5 | -5.0 | 68.9 | 6.7 | 37.4 | 31.5 | 31.8 | 4.8 | 0.32 |
| 145°F (145) | 55.1 | -7.7 | 14.1 | -5.0 | 69.3 | 6.4 | 37. | 31.4 | 3.3 | 4.8 | 0.30 |
| 190°F (190) | 55.0 | -8.3 | 12.4 | -2.9 | 69.5 | 5.8 | 39.1 | 30.4 | 33.3 | 4.9 | 0.32 |
| Significance (P): | |||||||||||
| Preservation Method | 0.01 | 0.69 | 0.01 | 0.14 | <0.01 | 0.86 | 0.04 | <0.01 | 0.09 | 0.01 | <0.01 |
| (FF+FD+AB) vs. other | 0.01 | 0.67 | 0.53 | 0.49 | <0.01 | 0.71 | 0.05 | <0.01 | 0.29 | 0.01 | <0.01 |
| FF vs. (FD+AB) | 0.21 | 0.18 | 0.01 | 0.22 | <0.01 | 0.36 | 0.04 | 0.48 | 0.02 | 0.81 | <0.01 |
| FD vs. AB | 0.01 | 0.90 | 0.03 | 0.48 | <0.01 | 0.67 | 0.23 | <0.01 | 0.98 | <0.01 | <0.01 |
| 145 vs. 190 | 0.96 | 0.82 | 0.03 | 0.03 | 0.83 | 0.77 | 0.15 | 0.01 | 0.17 | 0.36 | 0.28 |
1 CP = crude protein; NDF = neutral detergent fiber; ADF = acid detergent fiber; HEMI = hemicellulose; CELL = cellulose; ADF-N = acid detergent fiber nitrogen. ↲
2 DV = difference value (Weighback concentration minus AF concentration). ↲
3 Each value is the mean of five sheep. ↲
| Preservation Method | Urine Excreted | Feces | |||||||||
|---|---|---|---|---|---|---|---|---|---|---|---|
| Total (lb per day) |
Total N (lb per day) |
Total (lb per day) |
N (lb per day) |
Composition1 | |||||||
| CP (%) |
NDF (%) |
ADF (%) |
HEMI (%) |
CELL (%) |
Lignin (%) |
ADF-N (%) |
|||||
| Fresh frozen (FF) | 3.22 | 0.017 | 0.43 | 0.009 | 12.6 | 64.3 | 38.3 | 25.9 | 27.2 | 8.6 | 0.96 |
| Freeze-dried (FD) | 2.4 | 0.016 | 0.57 | 0.011 | 12.3 | 62.8 | 37.3 | 25.5 | 27.0 | 8.0 | 0.80 |
| Ambient (AB) | 1.7 | 0.023 | 0.65 | 0.014 | 13.4 | 61.6 | 37.8 | 23.8 | 26.9 | 8.4 | 0.94 |
| 145°F (145) | 1.7 | 0.017 | 0.58 | 0.012 | 12.9 | 62.6 | 38.6 | 24.1 | 27.1 | 8.2 | 0.88 |
| 190°F (190) | 2.6 | 0.025 | 0.66 | 0.013 | 12.6 | 63.1 | 39.4 | 23.7 | 27.8 | 8.3 | 0.96 |
| Significance (P): | |||||||||||
| Preservation Method | <0.01 | 0.03 | <0.01 | <0.01 | 0.40 | 0.20 | 0.02 | 0.01 | 0.70 | 0.12 | 0.11 |
| (FF+FD+AB) vs. other | 0.04 | 0.39 | 0.05 | 0.07 | 0.99 | 0.99 | 0.01 | 0.01 | 0.39 | 0.59 | 0.64 |
| FF vs. (FD+AB) | <0.01 | 0.25 | <0.01 | <0.01 | 0.71 | 0.04 | 0.13 | 0.03 | 0.63 | 0.05 | 0.13 |
| FD vs. AB | <0.01 | 0.02 | 0.14 | 0.02 | 0.06 | 0.26 | 0.39 | 0.01 | 0.84 | 0.07 | 0.05 |
| 145 vs. 190 | <0.01 | 0.04 | 0.15 | 0.20 | 0.66 | 0.67 | 0.19 | 0.60 | 0.31 | 0.78 | 0.23 |
1 CP = crude protein; NDF = neutral detergent fiber; ADF = acid detergent fiber; HEMI = hemicellulose; CELL = cellulose; ADF-N = acid detergent fiber nitrogen. ↲
2 Each value is the mean of five sheep. ↲
Appendices
I. General Standard Procedures of Experimentation
The general procedure (GP) followed for each aspect in conducting the various experiments presented in this bulletin are noted below and are not repeated elsewhere. Departure or specific details related to any one experiment are noted under the Materials and Methods section of each experiment with reference to the appropriate GP outlined below. All animal experiments were conducted in the months of October through April and occasionally into May, thereby avoiding the hot summer months.
GP-1. Hay Handling
All hays evaluated in the various experiments were harvested from well-established stands. When hay was field cured, the forage was cut with a mower-conditioner and baled with a conventional square baler. When hay was artificially dried, the forage was cut with a flail chopper, blown into a self-unloading wagon, and transported to a bulk drying barn at the NC State University Forage-Animal Metabolism Unit in Raleigh, NC. After drying, the hay was baled with a conventional square baler. Prior to feeding, field-cured hay bales were passed through a hydraulic bale press (Van Dale 5000, J. Starr Industries, Fort Atkins, WI) with stationary knives spaced at 4 inches. This process reduced hay into 3- to 5-inch lengths, with essentially no visible leaf loss, and both aided feeding and minimized the potential for the hay to be tossed out of the manger. Forage that was flail-chopped was reduced into 3- to 6-inch lengths when cut and required no further processing prior to feeding.
GP-2. Dry Matter Intake and Apparent Whole-Tract Digestibility
Evaluation with steers
Forages were evaluated at the NCSU Forage-Animal Metabolism Unit in an animal facility consisting of a metal structure partitioned into a feed preparation area on one end, an enclosed but well-ventilated middle area equipped with digestion crates with moderate temperature control (ambient air maintained > 50°F and < 85°F), and a third section on the opposite end equipped with a raised, basket weave, metal platform fitted with electronic gates (American Calan Inc., Northwood, NH) and used to control animal access to mangers for individual intake measurements. The intake area was beneath an extension of the roof with three open sides. In the intake phase, each animal wore an electronically keyed collar to allow access to only one manger but had free access to trace mineralized salt and water and could lounge with other animals. Prior to each experiment, animals were conditioned to the electronic gates before random assignment to the appropriate forage treatment.
The intake phase of each experiment consisted of a 21-day period with the first seven days used for adjustment and the last 14 days to estimate daily dry matter intake (Burns et al., 1994). A recorded weight of hay was fed twice daily allowing about 13 to 15% excess. A daily sample of the fed hay was obtained for each animal and composites made on a weekly basis. The unconsumed hay (weighback) was weighed twice daily, saved separately for each animal and treatment combination, and composited each week.
The digestibility phase consisted of 12 days and either immediately followed an intake period or was conducted as a separate digestibility evaluation. In either case, animals were moved into digestion crates. The digestion phase consisted of a seven-day adjustment period followed by a five-day total fecal and urine (if applicable) collection (12 days) (Cochran and Galyean, 1994). A recorded weight of forage was fed twice daily at about 15% excess. A daily sample of the fed hays was obtained and weighback saved separately for each animal by treatment combination and composited for the five-day collection period.
Feces were collected on a plastic sheet placed on the floor immediately in back of each digestion crate. Feces were removed periodically throughout the day and the daily total weighed for each of five consecutive days. Feces were thoroughly mixed daily, and 5% of the fresh weight was placed in a freezer (5°F).
When part of the experimental objectives, a second sample was obtained and placed in a freezer for particle size determination.
When part of the objective, urine was collected in containers acidified with 6N HCl to maintain acidic conditions. The volume was determined daily, and a 5% daily aliquot was retained. The daily aliquots were pooled by steer and stored frozen for subsequent analysis.
The weekly forage samples from the 14-day intake phase, the five-day composite forage and fecal samples from the digestion phase, and the associated weighback samples from the intake and digestion phases were oven-dried (131°F) and weighed for dry matter determination, thoroughly mixed, and a 300- to 500-gram subsample ground in a Wiley Mill to pass a 1-mm screen and stored at room temperature until analyzed. The samples for fecal particle size determination remained in the freezer (5°F) until freeze-dried and were dry sieved as noted below for masticates.
In experiments using a randomized complete block design, the digestion phase followed the intake phase and completed the experiment for each animal. In Latin square-designs, however, once animals completed one period they returned to the intake facility following the digestion phase to begin the next period.
Evaluation with sheep and goats
Forage evaluations with sheep and goats occurred at the NCSU Forage-Animal Metabolism Unit in an animal facility that included a building constructed for small-ruminant research with moderate temperature control (ambient air maintained > 50°F and < 85°F). The animals were held in digestion crates with free access to salt and water. When animals were initially placed in crates, they were fitted with a collection harness for future fecal collections. After an initial standardization period (14 days), allowing conditioning to the crates and harness, each animal was randomly assigned to a treatment. The intake phase was conducted as noted above for steers. At initiation of the digestion phase, a canvas collection bag was positioned on the harness and fitted with a plastic insert for total fecal collection. The digestion phase was conducted as noted above for steers. During collection, the fecal bags were emptied daily and feces processed as described above for steers.
GP-3. Masticate Collection and Processing and Chewing Behavior
Mature, esophageally fistulated, grade British-bred steers (800 to 1,400 pounds) were used and fed a standard hay about five days before initiation of an experiment. After adjustment to treatments (offered the previous P.M.), collections generally occurred about 9:00 a.m. and 3:00 p.m. on two consecutive days. Animals were offered about 3 pounds of hay at each collection. The esophageal cannulas were removed and boluses collected by hand to ensure complete collection. The first five to six boluses were discarded, and the following 10 to 15 were collected. If chewing behavior was determined, the chews per bolus were recorded and each bolus was handled separately, obtaining a fresh- and freeze-dried weight of each prior to mixing. Otherwise the boluses were placed on a large plastic tray, gently mixed, placed into two plastic bags, and immediately quick-frozen in liquid nitrogen (-319°F). Samples were then stored in a freezer (5°F) until freeze-dried and then returned to the freezer until analyzed. The dried boluses were sampled for nutritive value analyses and used for particle size determination.
Chewing behavior monitored during the digestion phase was accomplished using a simple electronic device interfaced to a computer (Luginbuhl et al., 1987). This device transformed jaw movements into binary notation (chew or no chew). A program was written to separate chews during eating and chews during rumination.
GP-4. Preference Experiments
Preference experiments using steers, sheep, or goats were conducted in pens using individual animals. Prior to an experiment, animals were offered a meal of each forage to be evaluated to allow an association of the forage with any post-ingestive feedback produced by the forage. The order in which the forages were fed was randomized separately for each animal.
In experiments with sheep and goats (conducted in pens 4.9 × 6.5 feet), pairs of containers or multiple plastic containers with about 1.7 pounds of forage each were generally offered and animals allowed about 2.0 to 2.5 hours to feed. Forages for evaluation were randomized at presentation from the left-right position. At approximately 30 minutes after offering the feed, an intermediate weight was obtained. This was used to calculate an intake rate by dividing forage disappearance over 30 minutes by minutes spent eating.
Steers, also fed in pens (8 × 13 feet), were offered about 4.5 pounds of forage in galvanized tubs and allowed about 30 minutes to feed. Up to four mangers within a pen (16 × 26 feet) were available to a steer, allowing the maximum of four forages to be evaluated at a time. The forages were randomized at presentation and the left-right position also randomized when fed in pairs, or all randomized when fed in groups of four. A video recorder was used to record and subsequently estimate total time spent at each feeder to calculate intake rate by dividing forage disappearance by minutes at a feeder.
In some experiments when feeds were presented in pairs and the relative intake of each feed in the pair then expressed as a preference within that pair, a method termed multidimensional scaling was used. This method determined how many criteria were being used to determine preference among a collection of feeds. If equal quantities were consumed, then there is no, or zero, preference expressed. If only one of the pair is consumed, then the preference is large for one of the pair over the other feed in the pair. All pairs were tested with each animal, and then statistical tests indicated how many criteria must be present in order to create the differences expressed by the test animals. At that point, the differences were mapped graphically and we determined which of the feeds were evidenced by the steers’ eating behavior to be close to the same and which were evidenced to be different. Then estimated variables were compared with the dimensions evidenced by the steers’ behavior to develop an understanding of what is creating the preferences among the group of feeds. On occasion, the steers’ eating behavior might not be associated with any variable that we measured, but often the various estimates of nutritive value would be associated with the dimensions of preference evidenced by the steers’ behavior.
In all preference experiments, animals were disturbed periodically (2 to 3 minutes) after making a forage selection, requiring them to choose again. Care was taken to prevent consumption of all of the preferred forages. Also, sampling of all forages was conducted as appropriate for the experiment being carried out. It is worthy to note that in preference evaluations, some animals may eat considerable of one forage and zero of another, although some eating time maybe recorded for the zero intake. Estimates and statistical analysis of the dry matter intake and time-eating data are valid, whereas the wide variation (including ‘0’) makes calculation of the intake rate (grams/minute) data rather problematic, but intake rate data are included for completeness.
GP-5. Particle Size Determination
Particle size estimates of the masticate (boluses) and feces were obtained by passing two 15-gram subsamples through a Fritsch Vibrator system (Fritsch Analysette, the Tekmor Co., Cincinnati, OH). In the case of masticate, two 15-gram subsamples were separated with nine particle sizes weighed—consisting of dry matter retained on 5.60-, 4.00-, 2.80-, 1.70-, 1.00-, 0.50-, 0.25-, and 0.125-mm sieves and that which passed through the 0.125-mm sieve (<0.125 mm). The dry weight was recorded for the material retained on each sieve, and that which passed through the 0.125-mm sieve and percentage of cumulative particle weight oversize were determined and used to calculate median particle size (Fisher et al., 1988). Samples were composited across days and feeding times for each sieve size.
Particle size estimates of fecal samples were also determined as noted above for masticates, except only one sample was passed through the sieves. Sieved samples of both masticate and feces were stored either separately by individual sieve size or composites of the dry matter were made to form three particle-size classes of large (≥1.7 mm), medium (<1.7 and ≥0.50 mm), and small (<0.50 mm) prior to chemical analyses. The composite samples were ground in a cyclone mill (Udy Corp., Fort Collins, CO) to pass a 1-mm screen and stored in a freezer until analyzed.
GP-6. Digesta Kinetics
Chromium (Cr), and occasionally ytterbium (Yb), were used to mark the solid phase of the digesta to estimate gastrointestinal-tract fill of undigested dry matter (FILL), mean retention time (MRT), digesta rate of passage (ROP), and fecal output (FO). In preparation for marking of the fiber, esophageally fistulated steers were used to collect masticate of each experimental forage. The collected masticate was boiled in neutral detergent solution (without ethylenediamine tetraacetic acid) to remove cell solubles. The resulting fiber residue was dried and mordanted (heated) with chromium (8% w/w, Na2Cr2O7•5H2O) or soaked in a solution (2% w/w) of ytterbium nitrate [(Yb (NO3)3•5H2O]. Approximately 5 grams of the dried marked fiber was packed into a gelatin capsule for dosing. At dosing, the capsules were hydrated with warm water and orally administered, via a balling gun, to steers already restrained in digestion crates. The gelatin capsules (about six) containing Cr- or Yb-marked fiber delivered a known quantity of marker per animal. The ROP and MRT of the liquid phase of the digesta was determined using cobalt-ethylenediamine tetraacetic acid (Co-EDTA).The Co-EDTA was prepared by dissolving in water, and a 30 ml dose was administered via a 50 ml syringe to deliver a known quantity of marker per animal.
Fecal collections were taken rectally, or occasionally from the mat following defecation, at approximately 0, 4, 8, 12, 16, 20, 24, 28, 32, 36, 40, 44, 48, 52, 56, 64, 72, 80, 88, 96, 104, 112, 120, 128, 144 hours post dosing. Fecal samples were placed in plastic weighboats and dried in a forced-air oven (131°F), ground in a coffee grinder, and stored in bags until analyzed. All fecal samples were subsequently wet-ashed and Cr, Yb, and Co concentrations (as appropriate) determined by atomic absorption spectrophotometry (Model 5000 PerkinElmer, Norwalk, CT) (Quiroz et al., 1988).
After chemical analysis, the relationships of fecal concentrations of Co, Yb, and Co to time of dosing were fitted to a series of bi-exponential models including one or two compartment γ age-dependent, age-independent models (Ellis et al., 1994; Pond et al., 1988; Quiroz et al., 1988). Dry matter intake of individual animals was computed using the following relationship between fecal output (FO) and in vitro dry matter disappearance (IVDMD): daily dry matter intake = FO/(1-IVDMD). The IVDMD of the masticated forage was used as an estimate of apparent dry matter digestibility (Fisher et al., 1991).
GP-7. Laboratory Analysis
Nutritive value for all as-fed, weighback, and masticate samples, and chemical composition of fecal samples, as appropriate for the various experiments, were either analyzed by wet chemistry and reported, or used to develop calibration equations in association with the prediction of composition using near-infrared reflectance spectroscopy (NIRS). No distinction is made in an experiment regarding the analysis via wet chemistry or NIRS prediction.
Nutritive value estimates included in vitro dry matter disappearance as determined by a modification (Burns and Cope, 1974) of the method by Tilley and Terry (1963). In vitro true dry matter disappearance was determined by 48-hour fermentation in a batch fermentation vessel (Ankom Technology Corp., Fairport, NY) with artificial saliva and rumen inoculum (Burns and Cope, 1974) and terminated with neutral detergent solution in an Ankom 200 fiber analyzer (Ankom Technology Corp., Fairport, NY). This removed the contribution of residual microbial dry matter. Ruminal inoculum was obtained from a mature rumen-fistulated steer generally fed a mixed alfalfa (Medicago sativa L.) and orchardgrass (Dactylis glomerata L.) hay. Other nutritive value estimates of as-fed hay and masticate, and composition of feces, consisted of total nitrogen and the fiber fractions. Total nitrogen was determined colorimetrically (AOAC, 1990) with a Technicon Autoanalyzer (Bran and Luebbe, Buffalo, IL), and crude protein was estimated as 6.25 × nitrogen. The fiber fractions consisted of neutral detergent fiber (NDF), acid detergent fiber (ADF), lignin, and ash and were estimated using reagents according to Van Soest and Robertson (1980). Hemicellulose was determined by the difference between (NDF – ADF), as was cellulose, depending on procedures used. Total nonstructural carbohydrates (TNC) and its constituent starch, mono-, di-, and poly-saccharides, when reported, were determined according to Burns et al. (2006).
GP-8. Statistical Analysis
The data from the intake, digestibility, and masticate phases for each experiment were analyzed and presented as least square means from the application of mixed model methodology, as appropriate, based on the design for the particular experiment. Particle sizes, when determined, were expressed as percentages of cumulative particle weight oversize (sum of dry matter weight on each sieve vs. weight from all larger sieves) and were used to determine mean and median particle size (Fisher et al., 1988). Means for all variables found significant in each experiment were compared by either trend analysis, a set of orthogonal contrasts, or by a set of meaningful comparisons, as appropriate, within the analysis of variance. A minimum significant difference was also included at times to assist in determining differences between treatments not accommodated by the above mentioned statistical approaches.
II. References and Recent Related Publications
Association of Official Analytical Chemists (AOAC). 1990. Official Methods of Analysis. 15th ed., Arlington, VA.
Burns, J.C., and W.A. Cope. 1974. Nutritive value of crownvetch forage as influenced by structural constituents and phenolic and tannin compounds. Agron. J. 66:195-200.
Burns, J.C., D.S. Fisher, and G.E. Rottinghaus. 2006. Grazing influences on mass, nutritive value, and persistence of stockpiled Jessup tall fescue without and with novel and wild-type endophytes. Crop Sci. 46:1898-1912.
Burns, J.C., K.R. Pond, and D.S. Fisher. 1994. Measurements of intake. p. 494-532. In G.C. Fahey, Jr. et al. (ed.) Forage quality, evaluation, and utilization. ASA, CSSA, and SSSA, Madison, WI.
Cochran, R.C., and M.L. Galyean. 1994. Measurements of in vivo forage digestion by ruminants. p. 613-643. In G.C. Fahey, Jr. et al. (ed.) Forage quality, evaluation, and utilization. ASA, CSSA, and SSSA, Madison, WI.
Ellis, W.C., J.H. Matis, T.M. Hill, and M.R. Murphy. 1994. Methodology for estimating digestion and passage kinetics of forages. p. 682-756. In G.G. Fahey, Jr (ed.) Forage quality, evaluation and utilization. ASA, CSSA, and SSSA, Madison, WI.
Fisher, D.S., J.C. Burns, and K.R. Pond. 1988. Estimation of mean and median particle size of ruminant diets. J. Dairy Sci. 71:518-524.
Fisher, D.S., J.C. Burns, K.R. Pond, R.D. Mochrie, and D.H. Timothy. 1991. Effects of grass species on grazing steers: I. Diet composition and ingestive mastication. J. Anim. Sci. 69:1188-1198.
Luginbuhl, J.M., K.R. Pond, J.C. Russ, and J.C. Burns. 1987. A simple electronic device and computer interface system for monitoring chewing behavior of stall-fed ruminant animals. J. Dairy Sci. 70:1307-1312.
Pond, K.R., W.C. Ellis, J.H. Matis, H.M. Ferreiro, and J.D. Sutton. 1988. Compartmental models for estimating attributes of digesta flow in cattle. Br. J. Nutr. 60:571-595.
Quiroz, R., K.R. Pond, E.A. Tolley, and W.L. Johnson. 1988. Selection among nonlinear models for rate of passage studies in ruminants. J. Anim. Sci. 66:2977-2986.
Tilley, J., and R.A. Terry. 1963. A two-stage technique for in vitro digestion of forage crops. J. Br. Grassl. Soc. 18:104-111.
Van Soest, P.J., and J.B. Robertson. 1980. Systems of analysis for evaluating fibrous feeds. p. 49-60. In W.J. Pigden et al. (ed.) Standardization of analytical methodology for feeds. International Development Res. Center, Ottowa, Canada.
Recent Related Publications
Technical bulletins
Burns, J.C. et al. 1998. Carostan flaccidgrass: Establishment, adaptation, production, management, forage quality, and utilization. Technical Bulletin 313. North Carolina Agricultural Research Service, North Carolina State University, Raleigh, NC.
Burns, J.C. et al. 2009. Switchgrass: Establishment, management, yield, nutritive value, and utilization. Technical Bulletin 326. North Carolina Agricultural Research Service, North Carolina State University, Raleigh, NC.
Burns, J.C., D.S. Fisher, and E. S. Leonard. 2013. Cool-season forage hays: Nutritive value and quality. Technical Bulletin 331. North Carolina Cooperative Extension and North Carolina Agricultural Research Service, North Carolina State University, Raleigh, NC.
Burns, J.C. and E. S. Leonard. 2013. Silages of native switchgrass and gamagrass: Fermentation characteristics, nutritive value, and quality. Technical Bulletin 332. North Carolina Cooperative Extension and North Carolina Agricultural Research Service, North Carolina State University, Raleigh, NC.
Burns, J.C. and E. S. Leonard. 2013. Annual grasses preserved as silage: Fermentation characteristics, nutritive value and quality. Technical Bulletin 333. North Carolina Cooperative Extension and North Carolina Agricultural Research Service, North Carolina State University, Raleigh, NC.
Journal articles
Burns, J.C. 2011. Maturity and regrowth influences on quality of Caucasian bluestem. Crop Sci. 51: 1840-1849.
Burns, J.C. 2011. Advancement in assessment and the reassessment of the nutritive value of forages. Crop Sci. 51: 390-402.
Burns, J.C. 2011. Intake and digestibility among Caucasian bluestem, big bluestem, and switchgrass compared with bermudagrass. Crop Sci. 51: 2262-2275.
Burns, J.C., and D. S. Fisher. 2010. Eastern gamagrass management for pasture in the mid-Atlantic region: I. Animal performance and pasture productivity. Agron. J. 102: 171-178.
Burns, J.C., and D. S. Fisher. 2010. Eastern gamagrass management for pasture in the mid-Atlantic region: II. Diet and canopy characteristics, and stand persistence. Agron. J. 102: 179-186.
Burns, J.C., and D.S. Fisher. 2010. Steer performance and pasture productivity of Caucasian bluestem at three forage masses. Agron. J. 102:834-842.
Burns, J.C., and D.S. Fisher. 2010. Steer performance and pasture productivity of Caucasian bluestem at three forage masses. Agron. J. 102:834-842.
Burns, J.C., and D.S. Fisher. 2012. Intake and digestibility of big bluestem hay and baleage. Crop Sci. 52: 2413-2420.
Burns, J.C., and D.S. Fisher. 2012. Grazing management of flaccidgrass pastures in the autumn. Crop Sci. 52: 2392-2402.
Burns, J.C., and D.S. Fisher. 2013. Steer performance and pasture productivity among five perennial warm-season grasses. Agron. J. 105: 113-123.
Burns, J.C., and D.S. Fisher. 2013. Steer intake, digestion, and ingestive behavior of switchgrass and alfalfa hays. Crop Sci. 53:716-723.
Burns, J.C., and D.S. Fisher. 2013. Steer responses to increasing proportions of legume when fed switchgrass hay. The Professional Anim. Scientist 29:383-394.
Burns, J.C., D.S. Fisher, and K.R. Pond. 2011. Steer performance, intake, and digesta kinetics of switchgrass at three forage masses. Agron. J. 103: 337-350.
Burns, J.C., D.S. Fisher, and K.R. Pond. 2011. Flaccidgrass forage mass and canopy characteristics related to steer digesta kinetics and intake. Crop Sci. 51: 2895-2903.
Burns, J.C., D.S. Fisher, and K.R. Pond. 2012. Steer performance and pasture productivity of a Tall fescue-bermudagrass system compared with yellow bluestem and Coastal panicgrass. The Professional Anim. Scientist. 28: 272-283.
Burns, J.C., D.S. Fisher, and K.R. Pond. 2012. Steer performance, intake, and digesta kinetics and pasture productivity of flaccidgrass at each of three forage masses. Agron. J. 104: 26-35.
Burns, J.C., E.B. Godshalk, and D.H. Timothy. 2008. Registration of ‘BoMaster’ switchgrass. Journal Plant Registrations 2:31-32.
Burns, J.C., E.B. Godshalk, and D.H. Timothy. 2008. Registration of ‘Performer’ switchgrass. Journal Plant Registrations 2:29-30.
Burns, J.C., E.B. Godshalk, and D.H. Timothy. 2010. Registration of Colony lowland switchgrass. J. Plant Reg. 4:189-194.
Sanderson, M.A. and J.C. Burns. 2010. Digestibility and intake of hays from upland switchgrass cultivars. Crop Sci. 50:2641-2648.
Sauve, A.K., G.B. Huntington, C.S. Whisnant, and J.C. Burns. 2010. Intake, digestibility, and nitrogen balance of steers fed gamagrass baleage top-dressed at two rates of nitrogen and harvested at sunset and sunrise. Crop Sci. 50:427-437.
TB-335
14-CALS-4112
01/2014—VB/BS—200
Publication date: Jan. 1, 2014
Reviewed/Revised: July 31, 2023
TB-335
N.C. Cooperative Extension prohibits discrimination and harassment regardless of age, color, disability, family and marital status, gender identity, national origin, political beliefs, race, religion, sex (including pregnancy), sexual orientation and veteran status.
