
Soil fertility programs are designed to optimize crop yields, improve farm efficiency, reduce the cost of production, conserve natural resources, and protect the environment by minimizing excessive use of fertilizers (particularly nitrogen and phosphorus). An effective soil fertility program consists of soil testing coupled with plant tissue analysis. Plant tissue analysis helps determine sufficiency of nutrients not included in soil testing and determines if nutrients present in the soil are being taken up by the plant. In addition, appropriate management of tillage, crop residues, water, and pests is needed to achieve high yields.
Soil Testing Guidelines
Chemical aspects of soil fertility are monitored through soil testing and plant tissue analysis. The soil testing component of the program involves soil sampling, laboratory analysis, interpretation of laboratory results and recommendations, selection of specific amendments or fertilizers, and application of materials with calibrated equipment.
Sampling
Because the reliability of the soil test reflects the sample you submit, it is essential that you take samples in a way that accurately represents the soil on your farm.
Sample depth for cultivated fields is usually approximately 6 to 8 inches because this is where fertilizer and lime are incorporated (Figure 3-1). For continuous no-till fields, a 4-inch sampling depth is recommended. Occasionally sampling no-till fields to a depth of 4 inches and comparing to a sample taken from 4 to 8 inches deep can demonstrate the degree of pH and nutrient stratification.
Collect samples with a chrome-plated or stainless-steel sampling probe and plastic bucket that are clean and free of lime or fertilizer residues. Take multiple cores to represent the sampling area and mix them thoroughly before transfer to the soil sample box. Avoid sampling when soil is too wet, as it will be difficult to mix the cores. As a rule, if it is too wet to plow, it is too wet to sample.
Samples should be collected three to six months before planting. This will allow you to get the soil test report back in time to plan a liming and fertilization program. Growers in the coastal plain should plan to test soil every one to two years, as the sandy soils in that region do not hold nutrients as long as soils in the other parts of the state. The nutrient levels in the silt and clay loams in the piedmont and mountains change less rapidly. Sampling these areas once every three to four years is usually sufficient.
For a more thorough description of soil sampling recommendations, see Careful Soil Sampling—The Key to Reliable Soil Test Information.
Sampling Strategies
Traditional field sampling guidelines recommend collecting one composite sample consisting of 15 to 20 cores, to represent no more than 20 acres of the same soil type (Figure 3-2). Although these guidelines have proven very useful for decades, better approaches are now recommended. Technological advances in GPS and GIS allow more intensive soil sampling schemes—called precision soil sampling—enabling nutrients to be applied more precisely via variable-rate equipment.
Zone sampling is a precision sampling technique that utilizes soil type information, field topography from observation, yield maps, and other knowledge of production history to distinguish management zones for sample collection. A zone may be as small as 2 acres but may be 10 to 15 acres if site characteristics and production history are uniform. Considerable time, knowledge of soils, field management, and production history are needed to delineate zones. In each zone, 15 to 20 cores are recommended for a composite sample.
Grid sampling is another precision sampling technique utilized by much of the fertilizer industry. Typically, a 2-acre grid is used to delineate sampling units. Samples are taken either as point samples where grid lines intersect or randomly within each 2-acre grid. Grid sampling is easier than zone sampling because less expertise and time are required for delineating zones.
Several potential benefits of precision soil sampling and variable-rate applications exist. Variable application rate technology should minimize nutrient deficiencies and reduce costs by informing adjustment of application rates to meet localized lime and fertilizer needs in each subsection of a field. If these benefits can be achieved, then more efficient nutrient utilization should lead to higher yield potential while also reducing runoff and leaching risk.
For a description of more detailed precision agricultural soil sampling schemes, see Soil Sampling Strategies for Site-Specific Field Management.
Laboratory Analysis
The Soil Testing Section of the North Carolina Department of Agriculture & Consumer Services (NCDA&CS) Agronomic Services Division provides detailed chemical soil analyses, including levels of most major plant nutrients (phosphorus, potassium, calcium, magnesium, and sulfur), several micronutrients (copper, manganese, zinc), and sodium. The Soil Testing Section also determines pH, acidity, soil class, humic matter content, percent base saturation, cation exchange capacity (CEC), and weight-to-volume ratio.
Most of the year (generally April through November), routine NCDA&CS soil tests are provided at “no direct cost” to North Carolina residents. From approximately Thanksgiving through March, however, a peak-season fee of $4 is charged for the processing of all soil samples. The fee’s purpose is to encourage early sampling so the lab can operate more efficiently and provide faster customer service. The laboratory provides routine predictive analyses as well as more detailed diagnostic services that allow for the submission of linked soil and plant tissue samples from problematic areas.
The Soil Testing Section utilizes the Mehlich-3 extractant to measure nutrients, the Mehlich buffer to measure acidity for determining lime requirements, and a humic matter determination to distinguish soil classes for more appropriate lime recommendations. In September 2017, the lab began measuring pH using a weak calcium chloride (0.01 M CaCl2) solution; this test is referred to as a salt pH method.
Private soil testing laboratories are also an option. Different laboratories may utilize different methods and make different recommendations.
Interpretation of Laboratory Soil Results
For a soil test to be of value, field studies that relate crop performance to laboratory measurements are essential. These established correlations are the basis for valid fertilizer recommendations and are best attained using local data. With continuously evolving crop varieties and management systems, these interpretations should be periodically verified by laboratory agronomists and soil scientists. These experts conduct nutrient response trials in the field where soil nutrient value is known and compared with multiple levels of nutrient applications. Also, response is noted for consistency with recommended rates of fertilizer.
Soil test interpretations and recommendations consider that fertility is not the only factor that limits yield. Soil moisture, planting dates, crop varieties, weeds, insects, diseases, nematodes, soil physical conditions, and other variables can also limit production. Therefore, the goal of soil test recommendations is not to achieve a specific yield but to prevent fertility from being a yield-limiting factor. In addition, heeding soil test recommendations helps curb excessive nutrient application, which is both economically and environmentally unsound. Data from numerous research studies around the world suggest that once the soil test nutrient concentration reaches a certain level, no crop response is likely, even at very high crop yield levels (Figure 3-3).
The publication Crop Fertilization Based on North Carolina Soil Tests describes the index rating system and the interpretation of the NCDA&CS soil test report. Figure 3-4 illustrates the relationship between interpretation index percent and response in growth or yield.
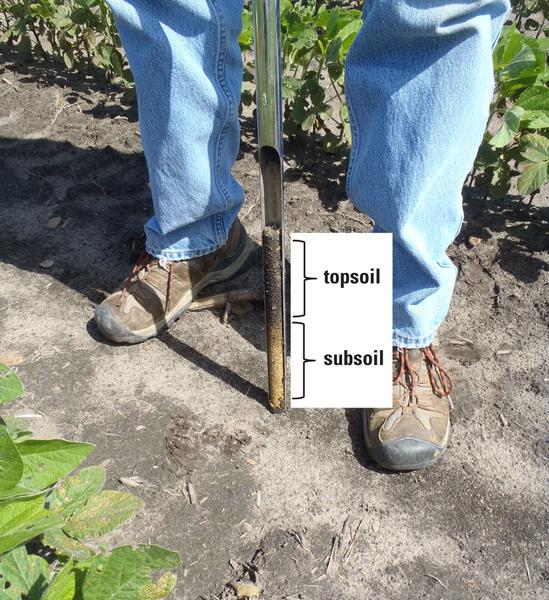
Figure 3-1. Routine soil samples should be collected from the topsoil layer (6–8 inches deep). For problem investigations, separate subsoil layer samples can be collected to detect nutrients that leach below the topsoil.
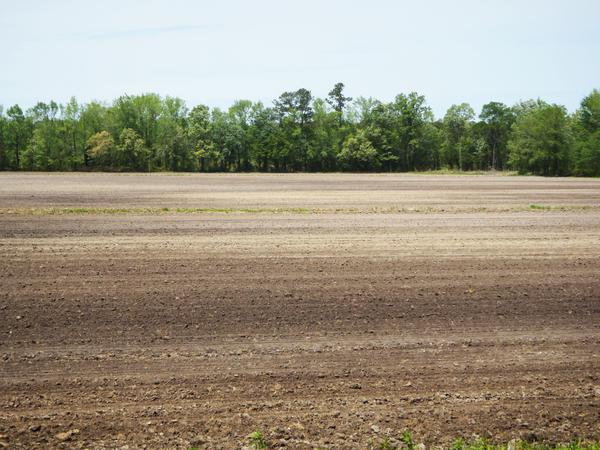
Figure 3-2. Recognizably different soil regions, if of significant acreage, should be sampled separately since they can vary in pH and nutrient composition.
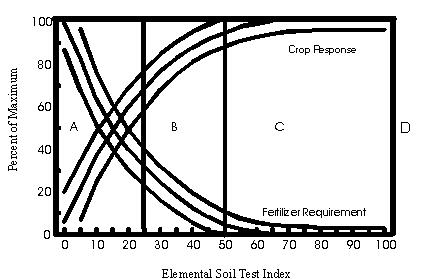
Figure 3-3. Graph illustrates the index rating system for phosphorus and potassium and the interpretation of the NCDA&CS soil test report.
Modified from Hatfield AL. 1972 and published in "Crop Fertilization Based on North Carolina Soil Tests"
Plant Tissue Analysis
Plant tissue analysis is useful because it determines sufficiency of nutrient concentrations actually present in the plant at the time of sampling. By contrast, routine soil testing doesn’t account for all nutrient elements in the soil, and there are conditions in which nutrients present in the soil are limited from being taken up into the plant.
Plant tissue analysis determines the nutrient concentrations within plants, which is useful for measuring nutrients such as nitrogen (N), iron (Fe), and boron (B) that are not included in routine soil testing by NCDA&CS. In addition, if crop growth is limited by soil pH, soil moisture, planting dates, crop varieties, weeds, insects, diseases, nematodes, soil physical conditions, or other factors, nutrients present in the soil may not be taken up by plants. Tissue analysis coupled with soil analysis can help determine the causes of resulting nutrient deficiencies.
Pay close attention to collection of appropriate plant samples (Table 3-1). For soybean seedlings (less than 12 inches tall), collect 20 to 30 whole plants, cutting 1 inch above the soil line. For larger plants up to full bloom, collect the most recently matured leaves, including the petiole, from 20 to 30 plants (typically, this is about the fourth leaf down from the bud of the plant). Sampling after pod set is not recommended because there are no established sufficiency levels for later growth stages.
For laboratory guidelines on appropriate sample collection and report interpretation, see the NCDA&CS Agronomic Services Plant/Waste/Media/Solution section.
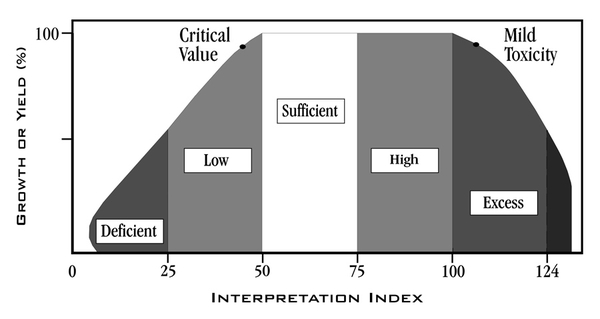
Figure 3-4. Expectation of yield or growth (%) in response to increasing nutrient concentration and interpretation index of the plant.
Source: NCDA&CS
Nutrient Recommendations
Soybeans remove a relatively large amount of nutrients from the soil compared to other crops. Total nutrient uptake depends on yield, which varies based on variety, soil, cultural practices, and weather. Soybeans take up relatively small amounts of nutrients early in the season, but the daily rate of nutrient uptake increases for most nutrients at stages R2 to R4. Table 3-2 shows the estimated uptake and removal rate of the primary and secondary nutrients contained in a 50 bu/acre yielding crop.
|
N |
P2O5 |
K2O |
Ca |
Mg |
S |
Cu |
Mn |
Zn |
|
|---|---|---|---|---|---|---|---|---|---|
|
(lb per acre) |
|||||||||
|
Uptake |
277 |
56 |
148 |
49 |
19 |
35 |
0.05 |
0.06 |
0.05 |
|
Removal |
188 |
40 |
74 |
19 |
10 |
23 |
0.05 |
0.06 |
0.05 |
The quantities in Table 3-2 should not be interpreted as the amount of fertilizer to apply each season. Nutrient applications will vary according to soil type, residual nutrient status (as measured by soil tests), and soil pH. Fertilizer and lime applications should be based on current, accurate soil tests. Studies in North Carolina and several other soybean-producing regions are evaluating whether soil test interpretations should be modified to generate different nutrient input recommendations for higher yielding crop systems. To date, it has not been clearly demonstrated that higher fertility inputs lead to higher yields. Nevertheless, improved management practices that lead to higher yields should reduce residual soil nutrient levels as measured by soil tests and lead to higher fertilizer input recommendations using current guidelines.
Macronutrients
These are the most important nutrients, due to the quantity required by crops and the frequent application needed.
Nitrogen (N)
Effectively nodulated soybeans can usually fix sufficient N for optimum plant growth. When soybeans have been a regular rotational crop in a field with effective nodulation in the past, sufficient inoculum is likely present. For fields without a history of soybean production or fields experiencing extended flooding or other severe disturbance, inoculation is strongly encouraged. Repeated field experiments have shown that inorganic N applications to nodulated soybeans are not likely to be profitable. Plant tissue analysis, however, should be a useful tool to detect N deficiencies should they occur. Visual symptoms of nitrogen deficiency typically involve yellowing of lower leaves, as shown in the Soybean Diagnostic Key (Figure 3-5).
Phosphorus (P) and Potassium (K)
Phosphorus and K recommendations provided by soil testing are expected to resolve most yield limitations. Because soybeans are late feeders of K, very early application of K prior to planting is not recommended, especially on low-CEC (cation exchange capacity), sandy soils that are prone to leaching. Phosphorus deficiency in soybean typically results in stunted plant growth, while K deficiency usually results in yellowing and necrosis of lower leaf margins (Figure 3-6).
Calcium (Ca) and Magnesium (Mg)
Calcium and Mg are traditionally supplied through the application of agricultural limes. If Mg is needed, growers should use dolomitic lime in pH management or use potassium magnesium sulfate (0-0-22, 11% Mg) to supply about 25 lb per acre when lime is not needed. Magnesium deficiency in soybean usually causes lower-leaf interveinal chlorosis (Figure 3-7). Calcium deficiency symptoms unrelated to low pH effects are not typically observed in North Carolina. Excessive Ca application through use of gypsum to improve soil properties can lead to Mg leaching in sandy soils or an imbalance of Ca and Mg.
Sulfur (S)
Sulfur deficiency has not been commonly observed in North Carolina soybean fields; when present, deficiencies are most likely to occur in very deep, coarse-textured soils. Since sulfate anions tend to leach and accumulate in subsoil clay layers, sufficient quantities may be present in some soils even though the topsoil samples analyzed at the laboratories indicate low levels. Sulfur deficiency symptoms include yellowing of the uppermost leaves (Figure 3-8). Sulfur deficiency is best diagnosed by plant tissue testing rather than soil testing. For additional information, see Sulfur Fertilization of North Carolina Crops.
Micronutrients
These nutrients are required in small amounts, but deficiencies can reduce yield because they are essential for specific functions.
Boron (B)
Boron deficiency in soybean affects rapidly expanding young tissues and can lead to misshapen and chlorotic upper leaves and abnormal plant buds (Figure 3-9).
Copper (Cu)
Copper deficiency is most likely to occur in organic soils in eastern North Carolina. It is not often seen in soybeans. Soil testing through NCDA&CS evaluates Cu and provides a recommendation when needed.
Manganese (Mn)
Manganese deficiency is relatively common in eastern North Carolina soybean fields with pH greater than 6.2 due to overapplication of lime or manures. At higher pH, Mn availability is reduced, even if it is present in the soil. Manganese deficiency usually results in leaf interveinal chlorosis and stunted growth (Figure 3-10). When in-season deficiency occurs, foliar application of 0.5 lb per acre usually corrects it; two applications spaced about seven days apart are often needed in severe cases.
Molybdenum (Mo)
Molybdenum is required by the Bradyrhizobium bacteria that form nodules on soybean roots to fix nitrogen. As soil pH decreases, Mo availability decreases, but liming to the appropriate pH will usually correct this issue. If an inoculant is used, Mo should be applied with the seed treatment. Deficiencies in the growing season can be corrected by foliar treatment.
Zinc (Zn)
Zinc is another important micronutrient, but deficiency is rarely seen in soybeans. Soil testing through NCDA&CS evaluates Zn and provides a recommendation when needed.
Lime
Soybean growth is known to be adversely affected by low soil pH. Yields are best when pH is near 6.0 on mineral soils, 5.5 on mineral-organic soils, or 5.0 on organic soils. Liming is recommended if soil pH is below recommended levels. Lime helps reduce toxic levels of aluminum and Mn, increases availability of Mo, and increases availability of P, Ca, and Mg (if dolomitic).
Liming should be based on current soil test results. Although soybeans respond well to lime, pH above recommended levels can cause micronutrient deficiencies. Since lime is relatively immobile in the soil, it should be incorporated, if possible, for adequate pH adjustment in the root zone. In addition, lime is most effective when applied at least three months prior to planting soybeans, especially in no-till production. In no-till fields, earlier and more frequent liming at lower application rates may be desirable because lime is left on the surface instead of incorporated, as in conventional tillage.
Figure 3-11 shows the availability of nutrients at various pH levels. The narrower the bar, the less available the nutrient is at that pH.
Sources of Lime and Fertilizer
Product recommendations provided through a soil test report state lime or nutrient recommendations on an amount-per-acre basis. The recommendations do not include additional instructions on sources or combinations of specific nutrients, due to the large number of alternatives (including numerous sources each of blended or co-precipitated granules, soil- or foliar-applied solutions, fertigation, and animal wastes). All products should be evaluated based on composition analysis provided on the product label. North Carolina is fortunate to have an agricultural lime law that protects consumers. Liming materials should be evaluated based on their effective neutralizing value (ENV), which is determined by both chemical composition (calcium carbonate equivalence, or CCE) and the particle sizes (finer particles react faster). See Soil Acidity and Liming for Agricultural Soils.
Producers should develop their own specific nutrient management program. Descriptions of fertilizer materials, including selected specialty, alternative, or fertilizer efficiency enhancer materials, can be found in the Fertilizer Use chapter of the North Carolina Agricultural Chemicals Manual. Consult Cooperative Extension agents, NCDA&CS regional agronomists, or other professional agronomists, as needed.
Manures can also be a cost-effective source of nutrients for maintaining adequate soil fertility. When using any source of manure nutrients (poultry litter, swine manure, or dairy manure), it is critical to follow state rules and regulations, which are dependent on whether the manure is sourced from a permitted or “deemed permitted” facility. At a minimum, state rules require:
-
Applying at no greater than agronomic rates
-
Maintaining 100-foot setbacks from perennial streams and waterways
-
Not applying to ground that is flooded, saturated with water, frozen, or covered with snow
-
Not applying while any precipitation is occurring
Determining the appropriate agronomic rate is critical for land application of manures. You must have a current soil test report (no older than three years) and current waste analysis (done within 60 days of application). You must also understand the N needs of the crops to be grown, which can be found using the realistic yield expectation tool. While manures are often applied to meet crop N needs, soybeans can fix their own nitrogen, making P-based or K-based applications more appropriate. Manures contain an array of nutrients, which are often not balanced in ratios that perfectly match crop needs. This imbalance can cause accumulation of P, K, Ca, or metals (Zn and Cu) in your soils when applied at N-based rates; excessive Zn and Cu can create toxicity issues, which can reduce yields. It is critical to use a current soil test report to avoid issues related to nutrient accumulation. You also must make sure spreaders are calibrated to apply the target rates uniformly across the application area. Serious issues have arisen from the misapplication of nutrients, and these problems can take decades to remediate. The most common manure-related toxicity issue is caused by high soil Zn. While soybeans are fairly resistant to toxicity, no land application of Zn-containing materials (including manures) should occur when the soil test Zn-index exceeds 3,000. If toxicity symptoms arise, deep tillage and pH elevation are the only two mitigation strategies available to growers. For more information, see Mitigating Zinc and Copper Toxicity in North Carolina Soils.
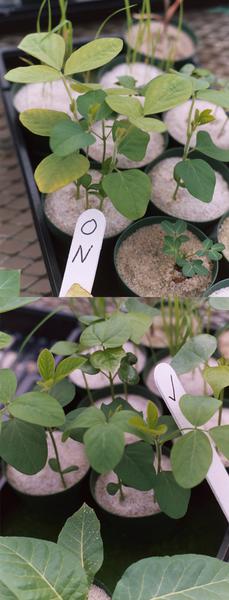
Figure 3-5. Nitrogen deficiency induced in the greenhouse (top) and normal plants (bottom).
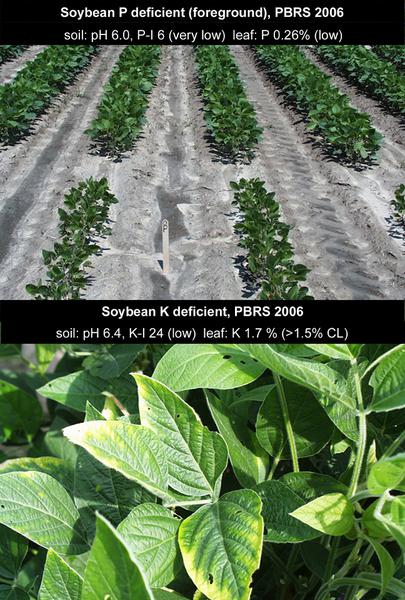
Figure 3-6. Phosphorus-deficient soybean (top, foreground) with soil P-Index of 6 (very low) and leaf P of 0.26% (low). Potassium-deficient soybean (bottom) with soil K-Index of 24 (low) and leaf K of 1.7% (near the critical level threshold of 1.5%).
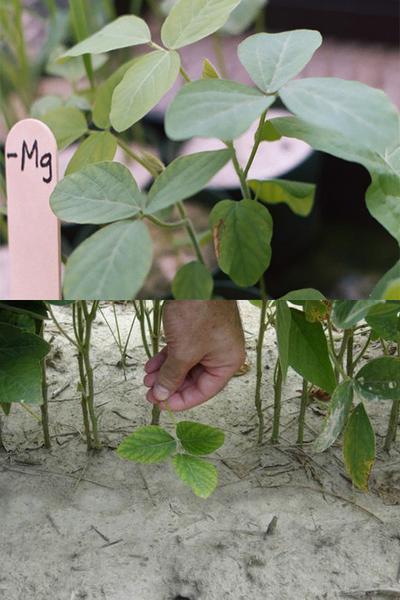
Figure 3-7. Magnesium deficiency induced in greenhouse plants (top) and similar lower-leaf symptoms observed in field soil with low pH (bottom).
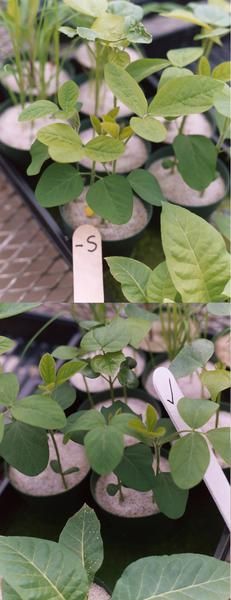
Figure 3-8. Sulfur deficiency induced in the greenhouse (top) and normal plants (bottom).
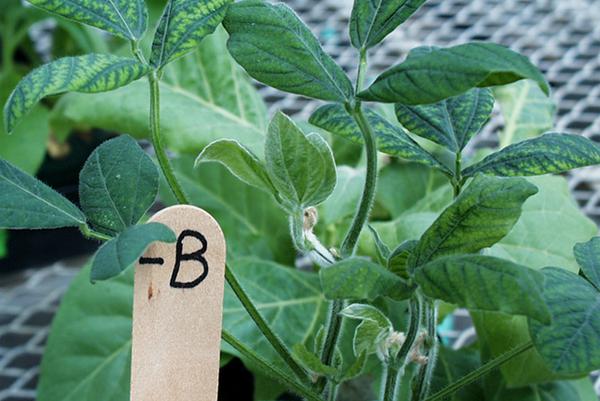
Figure 3-9. Boron deficiency induced in the greenhouse.
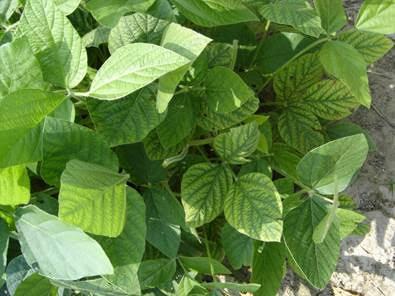
Figure 3-10. Manganese deficiency symptoms observed in the field.
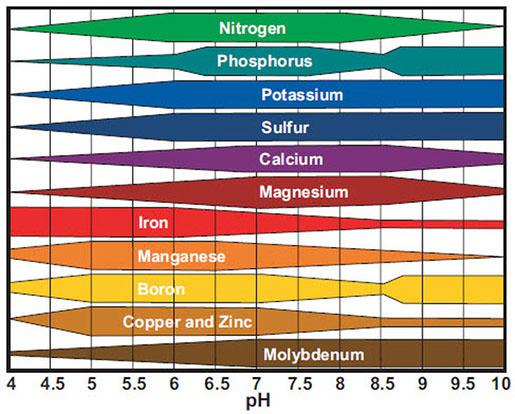
Figure 3-11. The relative availability of different nutrient elements varies with soil pH, as indicated by the width of each bar.
Application of Materials
Product recommendations are based on expected plant performance with a uniform product distribution and an availability to the plant as needed during the season. In practice, achieving uniform product distribution requires careful maintenance and operation of equipment. See the Chemical Application Equipment chapter in the North Carolina Agricultural Chemicals Manual.
Broadcast Spreaders
Broadcast spreaders are used to apply fertilizer, lime, and other commonly used amendments. Spreaders can have single-spinner, twin-spinner, or air-boom designs. A large spinner spreader typically consists of a hopper, a drag chain or belt, a discharge gate, a chute, and one or two spinners.
Spinner spreaders should produce a pattern that is heavy in the center and tapering at the edges. Desirable patterns for a spinner spreader are the “triangle,” the “oval,” and the “flat top” (Figure 3-12).
Proper spacing of the swaths in the field is critical to applying product correctly. Swath spacing should be the width across the pattern where each side delivers 50% of the rate. If the swath spacing is too wide, some areas will not receive enough product between the passes of the spreader. If the swath spacing is too close, some areas will receive too much product. Be sure to check the spread pattern and maintain proper swath spacing in the field. Improper swath spacing or a bad spread pattern for products such as fertilizers and manures can result in striped or uneven crop development (Figure 3-13). If passes are too far apart, underapplication occurs; if passes overlap too closely, overapplication may occur, increasing the possibility of crop toxicity issues. It is essential to recognize the difference between the width of the spread pattern and the swath width. Figure 3-12 illustrates the spread pattern width as the maximum width the product is distributed. In contrast, swath width is the spacing of the applicator’s passes through the field.
Air-boom spreaders use a high-volume air stream to suspend the product particles and convey them through tubes to diffusers spaced along the boom. The product is metered into an air chamber where the air stream catches the material and divides it into the tubes running to the diffusers. The product is uniformly distributed along the width of the boom with a very slight taper on the outside edges. As with the spinner spreader, proper swath spacing is critical. Because the air-boom pattern has little taper, precise swath spacing must be maintained. Smooth delivery of material is important.
Fertilizer spreader settings, operation, and maintenance require considerable care and consideration of design settings. Check the discharge mechanism for blockage or wear. Check the drive mechanism to make sure it is functioning properly. Slipping wheels, worn belts, and worn chains can seriously affect performance and should be repaired. Check the spinners for holes in the bottom or in the vanes. Check for caked material on the vanes as well. Pay close attention to the speed of the spinner; excessively high or low speeds can cause improper application patterns. On air-boom spreaders, be sure to check the air chamber and tubes for blockages and leaks. Refer to your operator’s manual for correct settings and adjustments on all machines.
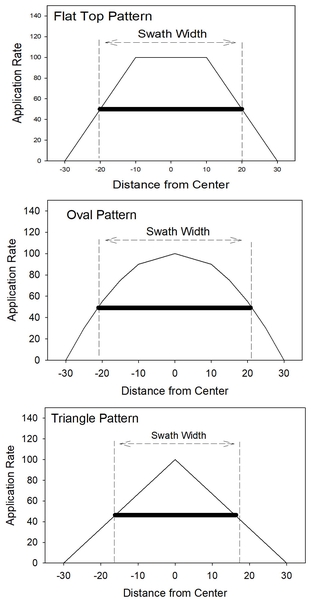
Figure 3-12. Spinner-spreader application patterns, with graphs indicating total spread widths and appropriate swath spacings.
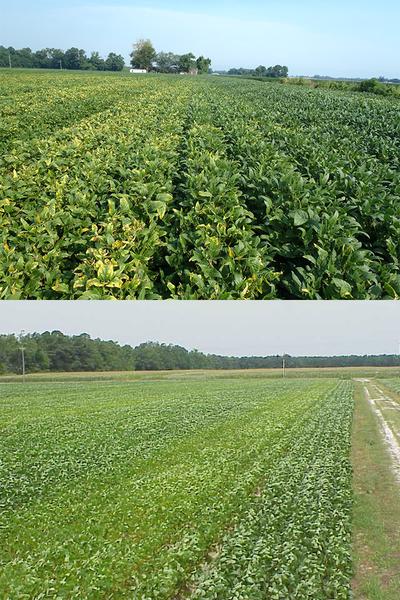
Figure 3-13. Streaks in soybean fields associated with inaccurate spread patterns of K fertilizer (top) and lime (bottom).
Acknowledgments
The authors thank Carl Crozier for his contributions to the previous version of this chapter.
Publication date: July 31, 2025
AG-835
Other Publications in North Carolina Soybean Production Guide
- 1. The Soybean Plant
- 2. Variety Selection
- 3. Fertilization and Nutrient Management
- 4. Soil Health, Tillage, Cover Crops, and Crop Rotation
- 5. Planting Decisions
- 6. Weed Management
- 7. Soybean Diseases and Management
- 8. Soybean Nematode Management
- 9. Insect Management
- 10. Water Management in Soybeans
- 11. Late-Season Management, Harvesting, Drying, and Storage
- 12. Soybean Marketing in North Carolina
N.C. Cooperative Extension prohibits discrimination and harassment regardless of age, color, disability, family and marital status, gender identity, national origin, political beliefs, race, religion, sex (including pregnancy), sexual orientation and veteran status.