
Planting decisions depend on a number of factors, including soil texture, tillage practices, cropping rotation, equipment availability, and grower preferences. Critical planting decisions discussed here include planting date, row spacing, seeding rate, planting mechanism, planting depth, and seeder calibration and maintenance.
Planting Date
Planting date is one of the most important agronomic decisions affecting soybean yield, with earlier planting dates typically resulting in more main stem nodes and subsequently higher yields (see "The Best Soybean Planting Date"). However, the great diversity of soil types, weather conditions, and rotations encountered statewide result in a wide range of recommended soybean planting dates. North Carolina growers plant soybeans from late March to as late as the end of July.
Vegetative growth on soybean plants “builds the factory” to drive photosynthesis and ultimately fill seed. (See The Soybean Growth Cycle: Important Risks, Management and Misconceptions.) Planting date directly impacts the number of days of vegetative growth that drive photosynthesis prior to flowering. Controls of soybean flowering are described in detail in Soybean Flowering Fallacy. When planting is delayed past the optimum date, yield reductions are expected due to less time for vegetative growth prior to flowering. Historical and recently generated data indicate that North Carolina soybeans need to reach 3 feet tall for maximum yield (Figure 5-1). Closure of the canopy prior to flowering is also a production benchmark. We know that the selected MG and planting date collectively affect canopy height, and if the selected planting date and MG combination do not allow for timely canopy closure (lapped middles), soybean yield can decline (Figure 5-2).
We have seen a very consistent quadratic response of planting date and plant height, largely regardless of the MG used (Figure 5-3). Figure 5-3 demonstrates that the tallest soybeans were planted from mid-April to mid-May (shown by teal and red lines). The shortest soybeans were planted in July followed by the next shortest soybeans planted in mid-March to early April. Figure 5-4 shows the differences in five MG5 variety plants planted from March through July.
Ongoing research in the NC State Extension Soybean Program has sought to determine the optimal planting period for soybean production in North Carolina. Unexpectedly, our research over five years in North Carolina has shown that soybeans planted before mid-April often achieve shorter plant heights than those planted in full season (planting dates from late April through mid-June). This is a realized risk of planting before mid-April across the state, particularly in the coastal plain and piedmont. Why are we seeing shorter plant heights with planting dates before mid-April, when we would generally expect that the earliest planted beans would be the tallest? Based on our research, we have consistently seen that the early-season temperatures have not driven vegetative growth in soybeans planted before mid-April, compared to temperatures that drive vegetative growth in full-season soybeans planted in May and early June.
Optimum Planting Period: If you look at the data generated across environments in North Carolina, the May 1 planting date maximized yield (Figure 5-5). However, yield response to planting date was flat from about April 20 through May 20, which is our newly defined optimum planting period across the state (Figure 5-5). The historically defined optimum planting period was May 1 through June 10; however, new genetics and more aggressive management have resulted in a shift of the optimum planting period earlier in the calendar year statewide.
It is evident that the trends for soybean yield response to planting date are largely the same across North Carolina; however, there is some geographical variation in how soybean yield responds to earlier planting dates. In the tidewater region, the yield penalty for planting before mid-April is less pronounced than it is with planting before mid-April in other North Carolina regions, which means that based on this data growers can plant in the first two weeks of April in the tidewater region without large yield penalty, especially when earlier-maturing varieties are used.
Planting Before Mid-April: Outside of the tidewater region, we have fairly consistently seen significant yield penalty with planting soybeans before mid-April, regardless of the MG used. In our small-plot research trials, we have observed the following risks when planting before mid-April: cool soils synergizing other issues that include early-season insect pressure; intensified seedling disease issues; preemergence herbicide injury; lower soil/air temperature limiting vegetative growth before the soybeans move into reproductive development; and seed quality issues on the back end of the season, particularly when an early-maturing variety is planted before mid-April. The 2023 USDA Risk Management Agency (RMA) early-replant coverage date is now April 1 for soybeans across North Carolina, as our data have consistently demonstrated that planting in the first half of April is not any riskier from a yield perspective than planting in mid-June. However, based on our data generated since 2019, we would caution growers planting in the first two weeks of April outside of the tidewater region to consider the risks articulated here.
Planting Past Mid-May: Our data consistently show yield declines when planting date is delayed past the third week of May. Many of North Carolina’s full-season soybeans are getting planted past the optimal planting period. Considerable yield gains could be made from pushing soybean planting into the optimum period of April 20 through May 20 on those acres.
Planting date and MG interact to influence yield. Growers should use the BeanPACK support tool to help make decisions about which MGs to plant across the diverse soybean planting dates used in the state.

Figure 5-1. Relationship between soybean planting height and soybean yield in research conducted across North Carolina from 2019 to 2023.
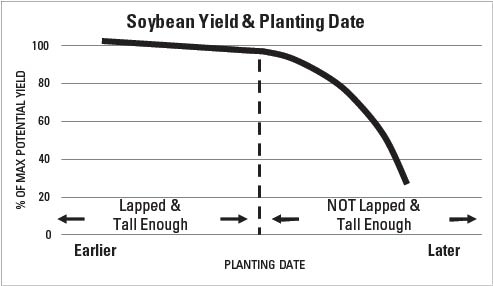
Figure 5-2. Relationship between yield and planting date is shown.

Figure 5-3. The impact of planting date and MG on soybean plant height combined over 20 North Carolina locations.
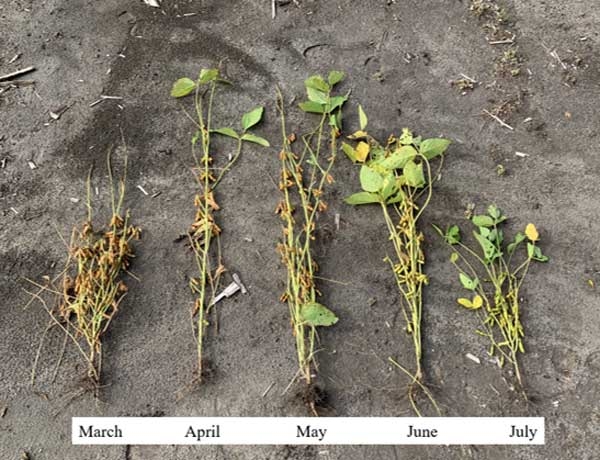
Figure 5-4. Soybean planting date impact on soybean height in an MG5 variety in Sampson County, North Carolina.
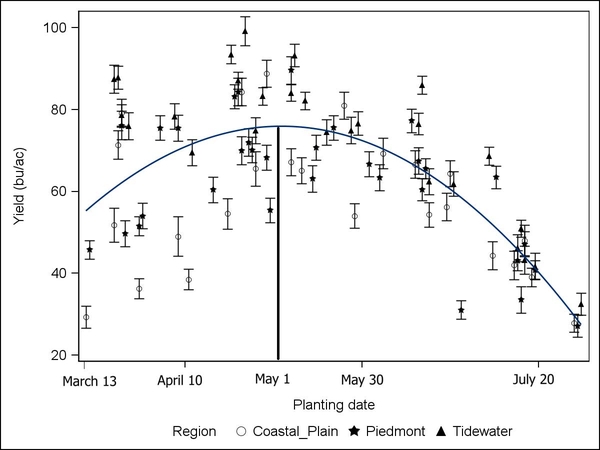
Figure 5-5. Soybean yield response to planting date combined over MG and seeding rate in 15 North Carolina soybean production environments from 2019 to 2023. Each dot represents an individual environment by planting date combination.
Row Spacing
A wide range of row spacings has been used successfully in North Carolina soybean production. Often, row spacing decisions are based on what equipment is already available. Narrower row spacing allows for quicker canopy closure and greater light interception; helps block light from reaching weeds; minimizes moisture loss; and, in some circumstances, increases soybean yield. The yield benefit from using narrow rows is more pronounced when the time from emergence (VE) to pod set (R3) is shortened, such as when planting at later planting dates, when using earlier-maturing varieties, and at high temperatures. See How to Pick the Right Soybean Row Spacing.
In a recent analysis of 877 North Carolina Soybean Yield Contest entries, row spacing was found not to impact soybean yield. This is consistent with a recent analysis of management practices on soybean yield in 3,568 producer fields in the Upper Midwest, which determined no influence of row spacing on soybean yield (see Benchmarking Soybean Production Systems in the North Central US). These data indicate that row spacing typically has minimal impact on soybean yield when other optimum production practices are employed—for example, on-time planting, effective weed management, and nonlimiting soil moisture (see How to Pick the Right Soybean Row Spacing).
In contrast, small-plot research in North Carolina has often shown yield advantages from narrow row spacing (< 30 inches) versus wider row spacing (36 to 42 inches) (Figure 5-6). When row spacing was investigated in small plots in MG3 and MG4 production across the state in 2018 and 2019 at May planting dates, 15-inch row spacing yielded 7 bu/acre more than 30-inch row spacing, on average. Producers entering the Soybean Yield Contest are typically using earlier-than-average soybean planting dates, which may negate the positive impact of narrower row spacing on yield observed in recent small-plot research (see Managing Early Maturing Soybeans in North Carolina). Also, in producer fields, wheel-track damage from pest management can lead to 1% to 5% yield declines in narrow rows not typically observed in small-plot research, due to differing methods of pest management between producer fields and these plots (see Wheel Traffic to Narrow-Row Reproductive-Stage Soybean Lowers Yield).
An additional potential benefit of investing in a narrower row planter for soybean planting in North Carolina would be to facilitate soybean planting simultaneously with other row crops to ensure soybeans are planted early enough to maximize yield.
In the coastal plain, there is also interest in the value of ripping under a wide row versus using a narrower row. To investigate, research was conducted by the NC State Extension Soybean Program in full-season planting dates in 2021 and 2022. We found that canopy closure was 25% greater at R1 (beginning flowering) in the narrow row (15 in.) versus wider row spacings (36 to 38 in.). However, there was often no impact of row spacing on soybean yield and, when there was, it was usually the narrow row providing an advantage over the wider ripped row (Figure 5-7).

Figure 5-6. Yield difference between narrow row (<30 in.) and wide row (36-42 in.) soybeans.

Figure 5-7. Row spacing impact on soybean yield in each environment.
Seeding Rate
Soybean yield is relatively insensitive to plant population. Soybeans have the unique ability to compensate for variable plant populations through additional branching in lower populations or when interplant competition is reduced; therefore, a wide range of seeding rates is acceptable. Final stands as low as 50,000 plants for May-planted beans, 75,000 plants for June-planted beans, and 100,000 plants for July-planted beans were found to produce reasonable yields in historical research (Figure 5-8).
Figure 5-8 represents the results of 64 tests planted in 15-inch rows in May, 73 tests planted in June, and 11 tests planted in July. The tests were repeated four times at each location, so the lines on the graph represent the results of 256 tests planted in May, 292 tests planted in June, and 44 tests planted in July. Planted in May, 50,000 plants per acre yielded essentially as high as 175,000 plants per acre, and anything in between. Yields were lower when planted in June, as expected, but the yield pattern for the June planting date (solid line) looks very much like the May line. Even the July line (dotted line) doesn’t look much different from the other two lines.
Figure 5-8 does a better job of helping farmers decide whether they need to replant a poor stand than of helping them decide how many seeds per acre to plant. The graph indicates it is not necessary to replant a field that has 75,000 good plants per acre left, but farmers may be justified in absorbing the cost of replanting for peace of mind. Farmers can also use the graph to determine their minimum acceptable plant population before deciding to purchase “insurance” in the form of extra seed. There’s no reason that farmers should agree on how much of that “insurance” they want to buy.
Since this research was conducted, soybean seeding-rate decisions have become more nuanced, due to rising seed costs and shifting management strategies. The wide range of planting dates (late March to late July) and maturity groups (MG2–MG8) used in North Carolina interact with the optimal soybean seeding rates.
Field research has been conducted the past several years across the state to understand how soybean seeding rate impacts soybean yield across diverse production practices. To determine how seeding rate impacts yield and revenue, we have been evaluating soybean seeding rates of 75,000 seeds/acre, 100,000 seeds/acre, 125,000 seeds/acre, 150,000 seeds/acre, and 175,000 seeds/acre using MG2-MG4 (indeterminate) and MG5-MG7 (determinate) across soybean planting dates from mid-March through mid-July. All plots were planted on 15-inch row spacing.
North Carolina is known for having three major soybean production regions: coastal plain, piedmont, and tidewater. These regions are characterized by their soil type, weather patterns, and rotational complexity, all which impact productivity. Questions have arisen about the need to adjust our seeding rate recommendations based on the different regions in North Carolina; however, results from this research indicate that yield response to seeding rate is somewhat consistent across regions (Figure 5-9). Planting date and MG have a larger impact on the need to adjust seeding rate than the region does.
Soybean planting date and MG selections are two of the most important management considerations for optimizing soybean production practices in North Carolina, and both interact with seeding rate.
Planting Date: As in previous research, this research found that seeding rate needs to increase as planting date is delayed to maximize both yield and revenue. In planting situations earlier than mid-May, soybean seeding rates of 120,000 to 150,000 seeds/acre generally maximized yield, while with later planting dates (past mid-June), seeding rates of 165,000 to 175,000 seeds/acre were needed to maximize yield.
Maturity Group: When using earlier soybean MGs (2-4), higher seeding rates (20,000 to 25,000 seeds/acre) were often needed to maximize soybean yield than when using later soybean MGs (5-8).
There is a cost associated with overseeding, and therefore it is important to understand the economically optimal seeding rates. Across all soybean planting date and MG combinations in this research, the agronomically optimal seeding rate (seeding rate that maximized yield) was higher than the economically optimal seeding rate (Figure 5-11). On average, for all these planting dates and MG combinations, the seeding rate that maximized revenue was 18,000 seeds/acre lower than the seeding rate that maximized yield.
Because soybean seed size varies among varieties and even within the same variety, planting rates should be considered in terms of plants per foot of row, not pounds per acre. Two plants per foot of row in a 7-inch row is very close to 150,000 plants per acre (represented by the vertical line at the right side of Figure 5-8). One plant per foot of 7-inch row is 75,000 plants per acre (represented by the vertical line at the left side of Figure 5-8). To most farmers, two plants per foot of 7-inch row looks sparse, while 10 plants per foot of 35-inch row looks generous, even though both produce 150,000 plants per acre. Table 5-12 is useful for calculating the number of seed and plants needed per foot of row for desired populations.
The recommendations in Table 5-12 assume that half a stand will still exceed the population that would require replanting. Farmers should feel free to adjust (up or down) how much extra seed they want to buy as insurance against having to replant. To determine how many plants per foot of row are needed for a given population, divide the desired plants/acre by the row ft/ac.
Aim for final stands of 75,000 plants for May-planted soybeans, 90,000 plants for June-planted soybeans, and 100,000 plants for July-planted soybeans. Table 5-13 can be used to calculate the number of seeds needed per acre, based on expected percent germination of the seed.

Figure 5-8. Relationship between soybean yield and plant populations.
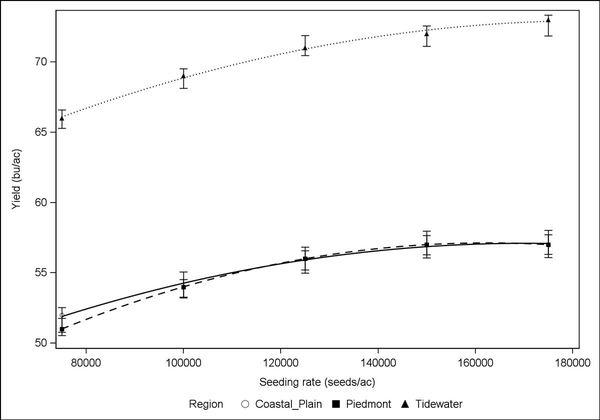
Figure 5-9. Soybean seeding rate impact on yield (combined over planting dates, maturity groups, and 15 North Carolina environments) in the coastal plain, piedmont, and tidewater regions.
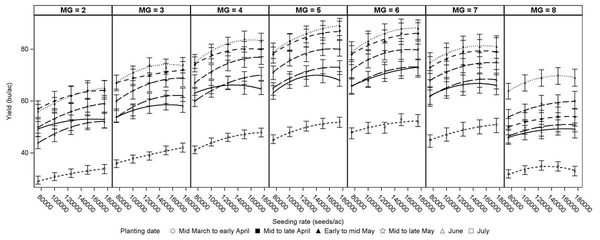
Figure 5-10. Seeding rate impact on soybean yield across planting dates for each MG combined over 15 North Carolina environments.
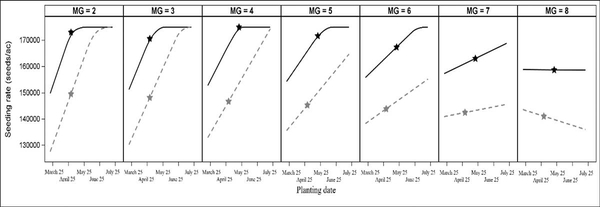
Figure 5-11. Seeding rate that maximized yield (black line) and revenue (red line) for each MG across planting date combined over 15 North Carolina environments. The black star represents the planting date and seeding rate that maximized yield for that MG. The red star represents the planting date and seeding rate that maximized revenue for that MG.
Planting Mechanism
There are increasing questions about the advantages of precision planting of soybeans in North Carolina compared to the more traditional method of drilling soybeans. This was investigated in North Carolina in 2021 and 2022.
In our studies, we compared precision planting of soybeans to drilling of soybeans in three different MGs (4, 5, and 6) at five different seeding rates: 75,000, 100,000, 125,000, 150,000, and 175,000 seeds per acre. These trials were planted in mid-May at four coastal plain locations in 2021 and 2022. Combined over environments, there were minimal differences between the two planting mechanisms and their effect on yield across MGs. The MG6 soybeans trended toward having a yield penalty when precision-planted (Figure 5-12). There was no interaction of seeding rate and planting mechanism on yield in this study, meaning that regardless of seeding rate, the planting mechanism did not impact yield. At one location, the MG4 that was precision-planted outyielded the MG4 that was drilled, across all seeding rates; the higher yield was presumably due to more branching capacity at uniform spacing. We are interested in further exploring the interaction of branching capacity and planting mechanism in the future.
We measured soybean emergence after planting in our studies. Generally, precision planting led to more rapid emergence than drilling soybeans. However, planter type did not ultimately impact final soybean stand or soybean plant height.
Recent work conducted at the University of Wisconsin-Madison showed that precision planting provided yield advantages only at very low populations (40,000 seeds/acre). See Does Precision Planting Really Matter in Soybean?
Based on our recent trials in North Carolina—coupled with results from other U.S. regions—we have not seen data that would indicate that precision-planting soybeans will provide yield advantages across many production scenarios. However, we have seen some interesting results in this dataset that warrant more investigation in our environment.

Figure 5-12. Impact on yield of precision planting versus drilling soybeans combined over environment and seeding rate in research conducted in 2021 and 2022 in four North Carolina coastal plain environments.
Planting Depth
Soybean seeds need to be planted deep enough to get good seed-to-soil contact and shallow enough that they don’t expend more energy than necessary to get out of the ground—usually about ¾ to 1¼ inches deep. If using a preemergence broadleaf herbicide (especially metribuzin), a depth of 1½ to 2 inches is recommended to decrease the likelihood that the soybean seedling will take up the herbicide. If planting no-till, be sure the seeds are in contact with the soil, not just the residue on the soil surface.
Southern soybean varieties will emerge from deeper depths than previously described, but the deeper the planting depth, the weaker the seedling will be when it emerges. It is probably better to plant too deep (at the risk of a weaker seedling at emergence) than too shallow (at the risk of not getting good contact of the seed with the soil, so moisture can get to the seed). If planting depth is not very uniform (as when planting with a drill), make sure that most of the seeds are deep enough to get covered with some soil, even though other seeds will likely be planted deeper than recommended.
Seeder Calibration and Maintenance
It is essential to properly maintain planting equipment before going to the field. An improperly prepared planter or drill will be more difficult to calibrate, may not deposit the seed correctly in the furrow, and may be prone to break down in the field during planting. The best source of information on planter or seeder maintenance and preparation is your operator’s manual. If you do not have a manual, contact the equipment manufacturer. Even for older implements, they can often provide an operator’s manual.
Maintenance and Preparation
Most implements have several areas in common that the owner or operator should focus on the following:
Seed hopper—Check the hopper for leaks and damage. Small holes in the hopper bottom or side wall will allow seed to fall through, resulting in loss. Check the inside of the hopper for corroded areas or blockages. Anything that impedes the flow of seed from the hopper can affect planting performance.
Seed meter—Whether it’s seed plates for drums in a row-crop planter or seed wheels in a drill, the metering mechanism is responsible for measuring the seed rate and ensuring correct population. Inspect the metering mechanism carefully for damage. For row-crop planters, make sure you have the correct plate for the seed you have selected. A mismatch can lead to excessive skips or doubles.
Air delivery—If you are using an air planter, pressure, or vacuum, check the air delivery and pressure at the seed meter. Most systems have a pressure gauge on the common air tube near the fan. Adjust the air pressure to match the recommendation for the size and type of seed you are planting. Check the air pressure and delivery at the metering unit as well. A blockage in the air tube between the metering unit and the pressure gauge at the fan will affect the air delivery.
Meter Drive—The seed meter is typically driven by one of three mechanisms:
-
Press wheel—Press wheel drives have a drive chain from the row press wheel that provides power to turn the seed meter, particularly on older planters. Check the condition of the chain and sprockets for each unit. Check the wheel and drive bearings to make sure the press wheel turns freely.
-
Drive wheel—Many planters use a drive wheel on the planter frame to deliver power to a countershaft. Individual seed meters take power from this shaft. In this system, multiple rows are all driven at the same rate. On larger units, there may be more than one drive wheel. In this case, each wheel provides power to a section of row units or seed meters. Check the condition of the chains and sprockets to enhance performance. Check the bearings for smooth rotation. Also check the drive wheel carefully. If the tire is the wrong size or badly worn, or if the air pressure is incorrect, there may be a significant error in seed population during planting. Air pressure in the tire can change at any time due to leaks, punctures, or other damage. Check the inflation pressure often.
-
Hydraulic drive—Hydraulic drives take the place of press wheel or drive wheel systems on some planters. The hydraulic drive is controlled by an automatic rate controller in the tractor. Drive speed is calibrated to true ground speed by the rate controller. Check the system pressure and adjust the flow delivery as recommended by the planter manual. Check for proper drive-speed calibration at the start of each season, and monitor performance as you plant. Be sure to keep all hydraulic connections clean. Dirt is the worst enemy of a hydraulic system. The quick connects between the tractor and the implement are an easy point of entry for dirt in the hydraulic system.
Preseason maintenance is the key to successful planting. Your preseason preparation can be made easier by practicing good maintenance when you finish planting for the season. Store the planter ready-to-go or as recommended by the manufacturer, and your preparations at the beginning of the planting season will be much simpler.
Calibration
Calibration is the process of proving the planter or drill is delivering the seed at the rate intended. You should not assume the rate charts provided by the manufacturer in the manual will be exact for every application. Those charts represent what the manufacturer perceives to be average or representative conditions across a wide range of planting environments. Changes in seed properties, field condition, equipment condition, and a host of other factors can influence the result. To ensure successful planting, calibrate your planting equipment.
Calibrating a Row-Crop Planter
Row-crop planters typically singulate individual seed. As such, calibration is often based on seed spacing in the furrow or seeds per foot of row length.
Determine the seed rate. Seed rate is the number of seed to plant per acre. It takes into account the germination percentage for the seed used and the emergence percentage. Germination percentage is usually on the seed label. Emergence may be available for specific areas or conditions.
\(\text{Seed Rate, } \frac{\text{seed}}{\text{acre}} = \frac{\text{(Plant Population)}}{(\text{% Germination}\ \times\ \text{% Emergence})} \)
Calculate the seed spacing in seeds per foot of row. To do this, you will need to know the row spacing you will use and the seed rate calculated in Step 1.
\(\text{Seed Spacing, } \frac{\text{seed}}{\text{ft}} = \frac{\text{Seed Rate, } \frac{\text{seed}}{\text{acre}} \times\ \text{Row spacing, inches}}{43,560 \, {\text{sq ft per acre}}\ \times\ 12\ \text{inches/ft}} \)
Alternatively, your manual may include a planting table with spacing quoted in inches per seed.
\(\text{Seed Spacing, } \frac{\text{inches}}{\text{seed}} = \frac{43,560 \text{ sq ft per acre}\ \times \ 144 \text{ sq in per sq ft}}{\text{Seed Rate, } \frac{\text{seed}}{\text{acre}} \times\ \text{Row Spacing, inches}} \)
-
Set your planter up as indicated in the manual. If you are using a planter with a ground-drive system to power the seed meter, use the chain and sprocket combinations recommended in the planter manual. If you are using a hydraulic drive, set the drive speed and pressure as indicated in your manual.
-
Fill the hopper with enough seed to give you smooth seed feeding into the meter. If using an air planter, set the air pressure as recommended.
-
Run the planter at the recommended speed for several feet to get the meter filled and delivering seed to the ground. Check the seed spacing in the furrow and compare it to the spacing you calculated, either seed per foot of row or seed per inch. You may want to disengage the furrow closing wheel to make measurement easier. Also, make a dry run with the planter positioned just low enough to engage the drive (note that this may not accurately represent field conditions).
-
To measure seed per foot, measure a length of row several feet long. Count the number of seeds present in that space and divide the count into the distance measured. The result is seed per foot of row.
-
To measure inches per seed, pick a section of seed in the furrow and measure from the first seed to the last seed. Divide this measurement by the number of spaces between seed in the measured distance. The result is inches per seed.
-
Compare your spacing to the spacing necessary to achieve the population you want. If your spacing is too high or too low, make the necessary drive adjustments to correct the spacing.
Calibrating a Grain Drill
Grain drills meter seed by volume, not by singulating each seed. While not as precise as a row-crop planter unit, grain drills are effective at establishing a uniform plant population when properly calibrated. Grain drills can be calibrated by counting the seed dropped in the calibration test or by weighing the seed.
-
Mark off a calibration distance in an area representative of field conditions. You can use a distance of 100 to 200 feet in one of the fields to be planted. Longer distances give more accurate calibrations but require you to handle more seed.
-
Drive the calibration distance with the seed hopper half full and the seeding mechanism disengaged. Count the number of revolutions that the drill drive wheel makes to cover this distance. You can mark the drive wheel with paint, tape, or something to make it easy to count revolutions. You should drive the test distance at least twice, once in each direction, to get the average count.
-
Set the drill drive mechanism for the rate you want to achieve. Look at the seeding chart in the hopper or in the owner’s manual, and choose the seed type from the chart. If your seed is not listed, pick something close to its size for a first run. Make the necessary adjustments to the drive mechanism.
-
To collect seed during calibration, you can spread a large tarp on the ground or shop floor to catch the seed. You could also place a bucket under each seed tube and catch the seed discharged.
-
With the drill hitched to the tractor, engage the seeder drive mechanism and turn the drive wheel by hand for the number of revolutions counted in Step 2. You may need to use a jack or blocks to safely position the drill and still allow you to turn the drive wheel.
-
After collecting the seed for the number of turns required, combine all seed in a container and weigh the seed. If a scale is not available, you can count the seed and compare the result to a population chart.
Seed per acre is determined from the weight of the seed collected and the area used for calibration. Area is determined from the drill swath and the calibration distance used.
\(\text{Seed per Acre, } \frac{\text{lb}}{\text{acre}} = \frac{\text{Weight of collected seed, lb}\ \times \ 43,560 \text{ sq ft per acre}}{\text{Calibration Distance, ft}\ \times\ \text{Drill Swath, ft}}\)
Pounds per acre of seed can be converted to number of seeds per acre if you know the number of seeds per pound for the variety planted.
\(\text{Number of Seed per Acre}=\text{Seed per Acre,}\ \frac{\text{lb}}{\text{acre}}\times \frac{\text{seed count}}{\text{lb}}\)
-
Compare the seeding rate achieved by the drill to the population target you want to achieve. Adjust the drive mechanism accordingly to zero in on your population target.
Variable-Rate Planting
Variable-rate planting or seeding can be used effectively to optimize productivity in each field. In variable-rate planting, seed populations are adjusted on the fly by a variable-rate control system while planting in the field. Population changes or prescriptions can be based on soil-type maps, previous yield maps, management zones, or maps with other attributes.
To make variable-rate planting work, you will need several pieces of precision agriculture technology:
-
GPS/GNSS receiver—The receiver will determine field position any time you are in the field. It is necessary to determine your position when reading and planting a prescription from a map.
-
Field computer—Also called a field display, the field computer is responsible for reading the position information and the prescription map and sending the seed rate information to the variable-rate controller. Some field computers or displays have the GPS/GNSS receivers built in; others require external receivers.
-
Variable-rate controller—The rate controller is often a part of the field computer or may be an added module. It takes the rate calculation from the field computer and converts it into a control signal for the variable-rate drive.
-
Variable-rate drive—The rate drive is a hydraulic or electric motor that turns the seed metering mechanism. Hydraulic drives typically power several row units. Electric motors are often mounted on individual row units and provide individual control.
-
Prescription map—The prescription map contains the rate information. As you move from one zone to another, the field computer keeps track of the specific rate information, such as the seed population, and—in some cases—the variety to be planted. This is the information read in the field to achieve variable rate.
The advantage that variable-rate planting offers is the ability to match seed populations or varieties to specific areas in the field. Many farmers have fields with variable soil types or some spots that consistently perform better than others. With variable-rate planting, you can put the population or variety in each part of the field that matches its yield potential.
Publication date: July 31, 2025
AG-835
Other Publications in North Carolina Soybean Production Guide
- 1. The Soybean Plant
- 2. Variety Selection
- 3. Fertilization and Nutrient Management
- 4. Soil Health, Tillage, Cover Crops, and Crop Rotation
- 5. Planting Decisions
- 6. Weed Management
- 7. Soybean Diseases and Management
- 8. Soybean Nematode Management
- 9. Insect Management
- 10. Water Management in Soybeans
- 11. Late-Season Management, Harvesting, Drying, and Storage
- 12. Soybean Marketing in North Carolina
Recommendations for the use of agricultural chemicals are included in this publication as a convenience to the reader. The use of brand names and any mention or listing of commercial products or services in this publication does not imply endorsement by NC State University or N.C. A&T State University nor discrimination against similar products or services not mentioned. Individuals who use agricultural chemicals are responsible for ensuring that the intended use complies with current regulations and conforms to the product label. Be sure to obtain current information about usage regulations and examine a current product label before applying any chemical. For assistance, contact your local N.C. Cooperative Extension county center.
N.C. Cooperative Extension prohibits discrimination and harassment regardless of age, color, disability, family and marital status, gender identity, national origin, political beliefs, race, religion, sex (including pregnancy), sexual orientation and veteran status.