Notify me when new publications are added.
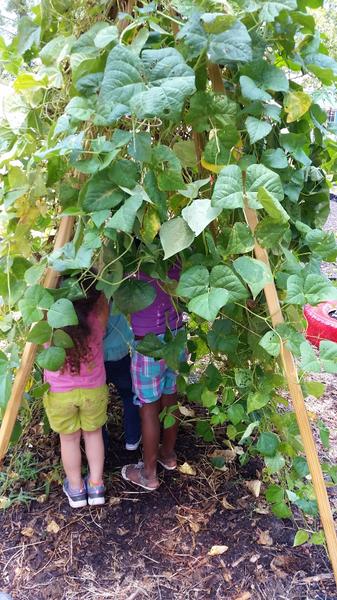
This publication focuses on easy-to-grow, child-friendly, warm-season fruits and vegetables suitable for childcare center gardening. This is the third of fifteen publications about childcare center production gardens.
This publication focuses on easy-to-grow, child-friendly, cool-season vegetables suitable for childcare center gardening. This is the fourth of fifteen publications about childcare center production gardens.
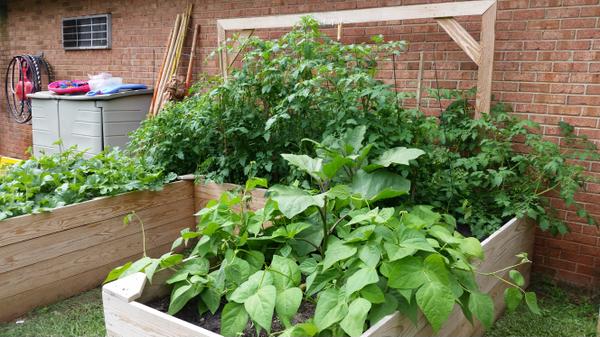
This publication focuses on developing fruit and vegetable production gardens in the Outdoor Learning Environment (OLE) of childcare centers. Included are basic garden design and layout to help childcare centers get started in year-round gardening activities. This is the second of fifteen publications about childcare center production gardens.
This publication provides information about how producers can prepare for selling produce to wholesale distributors. It includes tips and examples to help farmers expand their businesses.
This infographic provides a visual interpretation of the 2022 Census of Agriculture, which is collected and maintained by the U.S. Department of Agriculture, for Piedmont Triad Council of Government in North Carolina. The infographic is intended to provide a simple, clear snapshot of local agriculture and the many ways in which it impacts local economies. There are 16 regional Council of Governments (CoGs) across North Carolina. You can find more information about each CoG through the North Carolina Association of Regional Councils of Governments
This infographic provides a visual interpretation of the 2017 Census of Agriculture, which is collected and maintained by the U.S. Department of Agriculture, for Cumberland County in North Carolina. The infographic is intended to provide a simple, clear snapshot of local agriculture and the many ways in which it impacts local economies.
This infographic provides a visual interpretation of the 2017 Census of Agriculture, which is collected and maintained by the U.S. Department of Agriculture, for Granville County in North Carolina. The infographic is intended to provide a simple, clear snapshot of local agriculture and the many ways in which it impacts local economies.
This infographic provides a visual interpretation of the 2017 Census of Agriculture, which is collected and maintained by the U.S. Department of Agriculture, for Tyrrell County in North Carolina. The infographic is intended to provide a simple, clear snapshot of local agriculture and the many ways in which it impacts local economies.
This infographic provides a visual interpretation of the 2022 Census of Agriculture, which is collected and maintained by the U.S. Department of Agriculture, for Gates County in North Carolina. The infographic is intended to provide a simple, clear snapshot of local agriculture and the many ways in which it impacts local economies.
This infographic provides a visual interpretation of the 2022 Census of Agriculture, which is collected and maintained by the U.S. Department of Agriculture, for Halifax County in North Carolina. The infographic is intended to provide a simple, clear snapshot of local agriculture and the many ways in which it impacts local economies.
This infographic provides a visual interpretation of the 2022 Census of Agriculture, which is collected and maintained by the U.S. Department of Agriculture, for Perquimans County in North Carolina. The infographic is intended to provide a simple, clear snapshot of local agriculture and the many ways in which it impacts local economies.
This infographic provides a visual interpretation of the 2017 Census of Agriculture, which is collected and maintained by the U.S. Department of Agriculture, for Transylvania County in North Carolina. The infographic is intended to provide a simple, clear snapshot of local agriculture and the many ways in which it impacts local economies.
This infographic provides a visual interpretation of the 2022 Census of Agriculture, which is collected and maintained by the U.S. Department of Agriculture, for Granville County in North Carolina. The infographic is intended to provide a simple, clear snapshot of local agriculture and the many ways in which it impacts local economies.
This infographic provides a visual interpretation of the 2022 Census of Agriculture, which is collected and maintained by the U.S. Department of Agriculture, for Mid-Carolina Council of Government in North Carolina. The infographic is intended to provide a simple, clear snapshot of local agriculture and the many ways in which it impacts local economies. There are 16 regional Council of Governments (CoGs) across North Carolina. You can find more information about each CoG through the North Carolina Association of Regional Councils of Governments

This chapter of the Farm to Early Care and Education Resource Guide for North Carolina Extension Agents discusses potential partner organizations.
This infographic provides a visual interpretation of the 2022 Census of Agriculture, which is collected and maintained by the U.S. Department of Agriculture, for Transylvania County in North Carolina. The infographic is intended to provide a simple, clear snapshot of local agriculture and the many ways in which it impacts local economies.
This infographic provides a visual interpretation of the 2022 Census of Agriculture, which is collected and maintained by the U.S. Department of Agriculture, for Kerr-Tar Council of Government in North Carolina. The infographic is intended to provide a simple, clear snapshot of local agriculture and the many ways in which it impacts local economies. There are 16 regional Council of Governments (CoGs) across North Carolina. You can find more information about each CoG through the North Carolina Association of Regional Councils of Governments

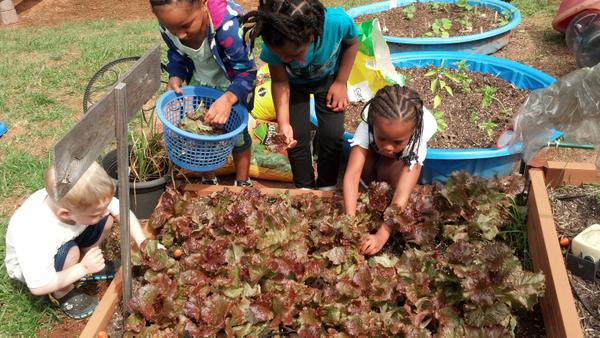
This factsheet summarizes the benefits of fruit and vegetable gardening with children. It includes age-appropriate activities for childcare providers to engage young children using fresh produce from the garden for cooking and eating.
This infographic provides a visual interpretation of the 2017 Census of Agriculture, which is collected and maintained by the U.S. Department of Agriculture, for Mecklenburg County in North Carolina. The infographic is intended to provide a simple, clear snapshot of local agriculture and the many ways in which it impacts local economies.
This infographic provides a visual interpretation of the 2017 Census of Agriculture, which is collected and maintained by the U.S. Department of Agriculture, for Mitchell County in North Carolina. The infographic is intended to provide a simple, clear snapshot of local agriculture and the many ways in which it impacts local economies.
This publication provides guidance to retail and wholesale buyers about purchasing local foods for grocery stores.
This infographic provides a visual interpretation of the 2022 Census of Agriculture, which is collected and maintained by the U.S. Department of Agriculture, for Western Piedmont Council of Government in North Carolina. The infographic is intended to provide a simple, clear snapshot of local agriculture and the many ways in which it impacts local economies. There are 16 regional Council of Governments (CoGs) across North Carolina. You can find more information about each CoG through the North Carolina Association of Regional Councils of Governments.
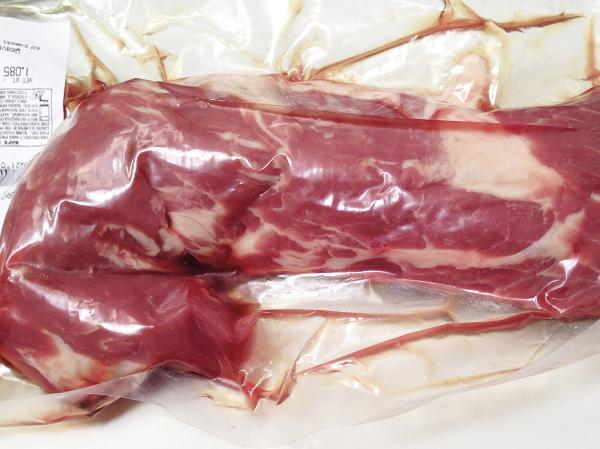
This publication guides small- and medium-scale pastured meat producers in North Carolina through the steps of selling niche meat products to grocery stores.
This infographic provides a visual interpretation of the 2017 Census of Agriculture, which is collected and maintained by the U.S. Department of Agriculture, for Nash County in North Carolina. The infographic is intended to provide a simple, clear snapshot of local agriculture and the many ways in which it impacts local economies.
This infographic provides a visual interpretation of the 2017 Census of Agriculture, which is collected and maintained by the U.S. Department of Agriculture, for Caldwell County in North Carolina. The infographic is intended to provide a simple, clear snapshot of local agriculture and the many ways in which it impacts local economies.
This infographic provides a visual interpretation of the 2017 Census of Agriculture, which is collected and maintained by the U.S. Department of Agriculture, for Duplin County in North Carolina. The infographic is intended to provide a simple, clear snapshot of local agriculture and the many ways in which it impacts local economies.
This infographic provides a visual interpretation of the 2017 Census of Agriculture, which is collected and maintained by the U.S. Department of Agriculture, for Lenoir County in North Carolina. The infographic is intended to provide a simple, clear snapshot of local agriculture and the many ways in which it impacts local economies.
This infographic provides a visual interpretation of the 2022 Census of Agriculture, which is collected and maintained by the U.S. Department of Agriculture, for Currituck County in North Carolina. The infographic is intended to provide a simple, clear snapshot of local agriculture and the many ways in which it impacts local economies.
This infographic provides a visual interpretation of the 2017 Census of Agriculture, which is collected and maintained by the U.S. Department of Agriculture, for Hertford County in North Carolina. The infographic is intended to provide a simple, clear snapshot of local agriculture and the many ways in which it impacts local economies.
This infographic provides a visual interpretation of the 2017 Census of Agriculture, which is collected and maintained by the U.S. Department of Agriculture, for Perquimans County in North Carolina. The infographic is intended to provide a simple, clear snapshot of local agriculture and the many ways in which it impacts local economies.
This infographic provides a visual interpretation of the 2022 Census of Agriculture, which is collected and maintained by the U.S. Department of Agriculture, for Ashe County in North Carolina. The infographic is intended to provide a simple, clear snapshot of local agriculture and the many ways in which it impacts local economies.
This infographic provides a visual interpretation of the 2017 Census of Agriculture, which is collected and maintained by the U.S. Department of Agriculture, for Caswell County in North Carolina. The infographic is intended to provide a simple, clear snapshot of local agriculture and the many ways in which it impacts local economies.
This infographic provides a visual interpretation of the 2017 Census of Agriculture, which is collected and maintained by the U.S. Department of Agriculture, for Robeson County in North Carolina. The infographic is intended to provide a simple, clear snapshot of local agriculture and the many ways in which it impacts local economies.

This chapter of the Farm to Early Care and Education Resource Guide for North Carolina Extension Agents discusses special considerations for early childhood gardening, cooking, and local food programs and provides resources for successful Farm to ECE initiatives.
This infographic provides a visual interpretation of the 2022 Census of Agriculture, which is collected and maintained by the U.S. Department of Agriculture, for Chatham County in North Carolina. The infographic is intended to provide a simple, clear snapshot of local agriculture and the many ways in which it impacts local economies.
This infographic provides a visual interpretation of the 2017 Census of Agriculture, which is collected and maintained by the U.S. Department of Agriculture, for Henderson County in North Carolina. The infographic is intended to provide a simple, clear snapshot of local agriculture and the many ways in which it impacts local economies.
This infographic provides a visual interpretation of the 2017 Census of Agriculture, which is collected and maintained by the U.S. Department of Agriculture, for North Carolina. The infographic is intended to provide a simple, clear snapshot of state agriculture and the many ways in which it impacts local economies.
This infographic provides a visual interpretation of the 2017 Census of Agriculture, which is collected and maintained by the U.S. Department of Agriculture, for Ashe County in North Carolina. The infographic is intended to provide a simple, clear snapshot of local agriculture and the many ways in which it impacts local economies.
This infographic provides a visual interpretation of the 2017 Census of Agriculture, which is collected and maintained by the U.S. Department of Agriculture, for Martin County in North Carolina. The infographic is intended to provide a simple, clear snapshot of local agriculture and the many ways in which it impacts local economies.
This infographic provides a visual interpretation of the 2017 Census of Agriculture, which is collected and maintained by the U.S. Department of Agriculture, for Rockingham County in North Carolina. The infographic is intended to provide a simple, clear snapshot of local agriculture and the many ways in which it impacts local economies.
This infographic provides a visual interpretation of the 2022 Census of Agriculture, which is collected and maintained by the U.S. Department of Agriculture, for Bladen County in North Carolina. The infographic is intended to provide a simple, clear snapshot of local agriculture and the many ways in which it impacts local economies.
This infographic provides a visual interpretation of the 2017 Census of Agriculture, which is collected and maintained by the U.S. Department of Agriculture, for Chowan County in North Carolina. The infographic is intended to provide a simple, clear snapshot of local agriculture and the many ways in which it impacts local economies.
This infographic provides a visual interpretation of the 2017 Census of Agriculture, which is collected and maintained by the U.S. Department of Agriculture, for Halifax County in North Carolina. The infographic is intended to provide a simple, clear snapshot of local agriculture and the many ways in which it impacts local economies.
This infographic provides a visual interpretation of the 2017 Census of Agriculture, which is collected and maintained by the U.S. Department of Agriculture, for Lincoln County in North Carolina. The infographic is intended to provide a simple, clear snapshot of local agriculture and the many ways in which it impacts local economies.
This infographic provides a visual interpretation of the 2022 Census of Agriculture, which is collected and maintained by the U.S. Department of Agriculture, for Lumber Council of Government in North Carolina. The infographic is intended to provide a simple, clear snapshot of local agriculture and the many ways in which it impacts local economies. There are 16 regional Council of Governments (CoGs) across North Carolina. You can find more information about each CoG through the North Carolina Association of Regional Councils of Governments

This publication includes simple recipes that childcare center cooks and educators can use to engage children in snacking and cooking with fresh warm-season fruits and vegetables from on-site production gardens and elsewhere. This is the fifth of fifteen publications about childcare center production gardens.
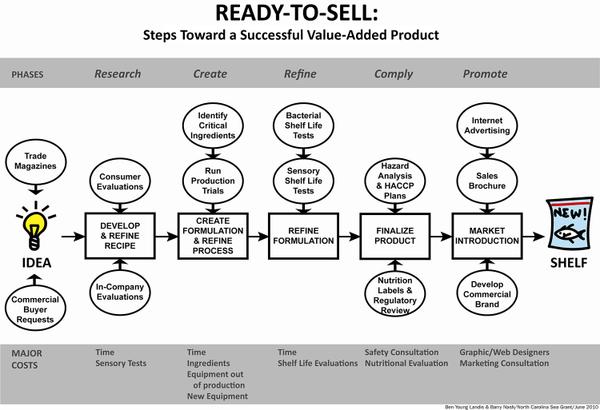
This publication introduces producers to general principles for successfully creating new value-added products and where to find specific guidance at each developmental stage.
This infographic provides a visual interpretation of the 2017 Census of Agriculture, which is collected and maintained by the U.S. Department of Agriculture, for Carteret County in North Carolina. The infographic is intended to provide a simple, clear snapshot of local agriculture and the many ways in which it impacts local economies.
This infographic provides a visual interpretation of the 2017 Census of Agriculture, which is collected and maintained by the U.S. Department of Agriculture, for Forsyth County in North Carolina. The infographic is intended to provide a simple, clear snapshot of local agriculture and the many ways in which it impacts local economies.
This infographic provides a visual interpretation of the 2017 Census of Agriculture, which is collected and maintained by the U.S. Department of Agriculture, for Gaston County in North Carolina. The infographic is intended to provide a simple, clear snapshot of local agriculture and the many ways in which it impacts local economies.
This infographic provides a visual interpretation of the 2017 Census of Agriculture, which is collected and maintained by the U.S. Department of Agriculture, for Lee County in North Carolina. The infographic is intended to provide a simple, clear snapshot of local agriculture and the many ways in which it impacts local economies.
This infographic provides a visual interpretation of the 2017 Census of Agriculture, which is collected and maintained by the U.S. Department of Agriculture, for Madison County in North Carolina. The infographic is intended to provide a simple, clear snapshot of local agriculture and the many ways in which it impacts local economies.
This infographic provides a visual interpretation of the 2017 Census of Agriculture, which is collected and maintained by the U.S. Department of Agriculture, for McDowell County in North Carolina. The infographic is intended to provide a simple, clear snapshot of local agriculture and the many ways in which it impacts local economies.
This infographic provides a visual interpretation of the 2017 Census of Agriculture, which is collected and maintained by the U.S. Department of Agriculture, for Montgomery County in North Carolina. The infographic is intended to provide a simple, clear snapshot of local agriculture and the many ways in which it impacts local economies.
This infographic provides a visual interpretation of the 2017 Census of Agriculture, which is collected and maintained by the U.S. Department of Agriculture, for Warren County in North Carolina. The infographic is intended to provide a simple, clear snapshot of local agriculture and the many ways in which it impacts local economies.
This infographic provides a visual interpretation of the 2017 Census of Agriculture, which is collected and maintained by the U.S. Department of Agriculture, for Yancey County in North Carolina. The infographic is intended to provide a simple, clear snapshot of local agriculture and the many ways in which it impacts local economies.
This infographic provides a visual interpretation of the 2022 Census of Agriculture, which is collected and maintained by the U.S. Department of Agriculture, for Burke County in North Carolina. The infographic is intended to provide a simple, clear snapshot of local agriculture and the many ways in which it impacts local economies.
This infographic provides a visual interpretation of the 2017 Census of Agriculture, which is collected and maintained by the U.S. Department of Agriculture, for Buncombe County in North Carolina. The infographic is intended to provide a simple, clear snapshot of local agriculture and the many ways in which it impacts local economies.
This infographic provides a visual interpretation of the 2017 Census of Agriculture, which is collected and maintained by the U.S. Department of Agriculture, for Hyde County in North Carolina. The infographic is intended to provide a simple, clear snapshot of local agriculture and the many ways in which it impacts local economies.
This infographic provides a visual interpretation of the 2017 Census of Agriculture, which is collected and maintained by the U.S. Department of Agriculture, for Watauga County in North Carolina. The infographic is intended to provide a simple, clear snapshot of local agriculture and the many ways in which it impacts local economies.
This infographic provides a visual interpretation of the 2022 Census of Agriculture, which is collected and maintained by the U.S. Department of Agriculture, for Allegheny County in North Carolina. The infographic is intended to provide a simple, clear snapshot of local agriculture and the many ways in which it impacts local economies.
This infographic provides a visual interpretation of the 2022 Census of Agriculture, which is collected and maintained by the U.S. Department of Agriculture, for Haywood County in North Carolina. The infographic is intended to provide a simple, clear snapshot of local agriculture and the many ways in which it impacts local economies.
This infographic provides a visual interpretation of the 2022 Census of Agriculture, which is collected and maintained by the U.S. Department of Agriculture, for Orange County in North Carolina. The infographic is intended to provide a simple, clear snapshot of local agriculture and the many ways in which it impacts local economies.
This infographic provides a visual interpretation of the 2022 Census of Agriculture, which is collected and maintained by the U.S. Department of Agriculture, for Union County in North Carolina. The infographic is intended to provide a simple, clear snapshot of local agriculture and the many ways in which it impacts local economies.
This infographic provides a visual interpretation of the 2022 Census of Agriculture, which is collected and maintained by the U.S. Department of Agriculture, for Watauga County in North Carolina. The infographic is intended to provide a simple, clear snapshot of local agriculture and the many ways in which it impacts local economies.
This infographic provides a visual interpretation of the 2017 Census of Agriculture, which is collected and maintained by the U.S. Department of Agriculture, for Beaufort County in North Carolina. The infographic is intended to provide a simple, clear snapshot of local agriculture and the many ways in which it impacts local economies.
This infographic provides a visual interpretation of the 2017 Census of Agriculture, which is collected and maintained by the U.S. Department of Agriculture, for Chatham County in North Carolina. The infographic is intended to provide a simple, clear snapshot of local agriculture and the many ways in which it impacts local economies.
This infographic provides a visual interpretation of the 2017 Census of Agriculture, which is collected and maintained by the U.S. Department of Agriculture, for Person County in North Carolina. The infographic is intended to provide a simple, clear snapshot of local agriculture and the many ways in which it impacts local economies.
This infographic provides a visual interpretation of the 2017 Census of Agriculture, which is collected and maintained by the U.S. Department of Agriculture, for Pitt County in North Carolina. The infographic is intended to provide a simple, clear snapshot of local agriculture and the many ways in which it impacts local economies.
This infographic provides a visual interpretation of the 2017 Census of Agriculture, which is collected and maintained by the U.S. Department of Agriculture, for Yadkin County in North Carolina. The infographic is intended to provide a simple, clear snapshot of local agriculture and the many ways in which it impacts local economies.
This infographic provides a visual interpretation of the 2022 Census of Agriculture, which is collected and maintained by the U.S. Department of Agriculture, for Durham County in North Carolina. The infographic is intended to provide a simple, clear snapshot of local agriculture and the many ways in which it impacts local economies.
This infographic provides a visual interpretation of the 2022 Census of Agriculture, which is collected and maintained by the U.S. Department of Agriculture, for Harnett County in North Carolina. The infographic is intended to provide a simple, clear snapshot of local agriculture and the many ways in which it impacts local economies.
This infographic provides a visual interpretation of the 2017 Census of Agriculture, which is collected and maintained by the U.S. Department of Agriculture, for Anson County in North Carolina. The infographic is intended to provide a simple, clear snapshot of local agriculture and the many ways in which it impacts local economies.
This infographic provides a visual interpretation of the 2017 Census of Agriculture, which is collected and maintained by the U.S. Department of Agriculture, for Bertie County in North Carolina. The infographic is intended to provide a simple, clear snapshot of local agriculture and the many ways in which it impacts local economies.
This infographic provides a visual interpretation of the 2017 Census of Agriculture, which is collected and maintained by the U.S. Department of Agriculture, for Cabarrus County in North Carolina. The infographic is intended to provide a simple, clear snapshot of local agriculture and the many ways in which it impacts local economies.
This infographic provides a visual interpretation of the 2017 Census of Agriculture, which is collected and maintained by the U.S. Department of Agriculture, for Cherokee County in North Carolina. The infographic is intended to provide a simple, clear snapshot of local agriculture and the many ways in which it impacts local economies.
This infographic provides a visual interpretation of the 2017 Census of Agriculture, which is collected and maintained by the U.S. Department of Agriculture, for Hoke County in North Carolina. The infographic is intended to provide a simple, clear snapshot of local agriculture and the many ways in which it impacts local economies.
This infographic provides a visual interpretation of the 2017 Census of Agriculture, which is collected and maintained by the U.S. Department of Agriculture, for Johnson County in North Carolina. The infographic is intended to provide a simple, clear snapshot of local agriculture and the many ways in which it impacts local economies.
This infographic provides a visual interpretation of the 2017 Census of Agriculture, which is collected and maintained by the U.S. Department of Agriculture, for Sampson County in North Carolina. The infographic is intended to provide a simple, clear snapshot of local agriculture and the many ways in which it impacts local economies.
This infographic provides a visual interpretation of the 2017 Census of Agriculture, which is collected and maintained by the U.S. Department of Agriculture, for Swain County in North Carolina. The infographic is intended to provide a simple, clear snapshot of local agriculture and the many ways in which it impacts local economies.
This infographic provides a visual interpretation of the 2017 Census of Agriculture, which is collected and maintained by the U.S. Department of Agriculture, for Wilson County in North Carolina. The infographic is intended to provide a simple, clear snapshot of local agriculture and the many ways in which it impacts local economies.

This resource guide explores how Early Care and Education programs serve families and show potential collaborations for Extension agents; inspires new local collaboration by highlighting successful programs within communities; and encourages cross-program activities to increase program support from Extension across North Carolina.
This infographic provides a visual interpretation of the 2022 Census of Agriculture, which is collected and maintained by the U.S. Department of Agriculture for North Carolina. The infographic is intended to provide a simple, clear snapshot of local agriculture and the many ways in which it impacts local economies.
This infographic provides a visual interpretation of the 2022 Census of Agriculture, which is collected and maintained by the U.S. Department of Agriculture, for Beaufort County in North Carolina. The infographic is intended to provide a simple, clear snapshot of local agriculture and the many ways in which it impacts local economies.
This infographic provides a visual interpretation of the 2022 Census of Agriculture, which is collected and maintained by the U.S. Department of Agriculture, for Caldwell County in North Carolina. The infographic is intended to provide a simple, clear snapshot of local agriculture and the many ways in which it impacts local economies.
This infographic provides a visual interpretation of the 2022 Census of Agriculture, which is collected and maintained by the U.S. Department of Agriculture, for Columbus County in North Carolina. The infographic is intended to provide a simple, clear snapshot of local agriculture and the many ways in which it impacts local economies.
This infographic provides a visual interpretation of the 2022 Census of Agriculture, which is collected and maintained by the U.S. Department of Agriculture, for Guilford County in North Carolina. The infographic is intended to provide a simple, clear snapshot of local agriculture and the many ways in which it impacts local economies.
This infographic provides a visual interpretation of the 2022 Census of Agriculture, which is collected and maintained by the U.S. Department of Agriculture, for Person County in North Carolina. The infographic is intended to provide a simple, clear snapshot of local agriculture and the many ways in which it impacts local economies.
This infographic provides a visual interpretation of the 2022 Census of Agriculture, which is collected and maintained by the U.S. Department of Agriculture, for Mid-East Council of Government in North Carolina. The infographic is intended to provide a simple, clear snapshot of local agriculture and the many ways in which it impacts local economies. There are 16 regional Council of Governments (CoGs) across North Carolina. You can find more information about each CoG through the North Carolina Association of Regional Councils of Governments

This publication includes simple recipes that childcare center cooks and educators can use to engage children in snacking and cooking with fresh cool-season fruits and vegetables from on-site production gardens and elsewhere. This is the sixth of fifteen publications about childcare center production gardens.
This infographic provides a visual interpretation of the 2017 Census of Agriculture, which is collected and maintained by the U.S. Department of Agriculture, for Bladen County in North Carolina. The infographic is intended to provide a simple, clear snapshot of local agriculture and the many ways in which it impacts local economies.
This infographic provides a visual interpretation of the 2017 Census of Agriculture, which is collected and maintained by the U.S. Department of Agriculture, for Currituck County in North Carolina. The infographic is intended to provide a simple, clear snapshot of local agriculture and the many ways in which it impacts local economies.
This infographic provides a visual interpretation of the 2017 Census of Agriculture, which is collected and maintained by the U.S. Department of Agriculture, for Moore County in North Carolina. The infographic is intended to provide a simple, clear snapshot of local agriculture and the many ways in which it impacts local economies.
This infographic provides a visual interpretation of the 2017 Census of Agriculture, which is collected and maintained by the U.S. Department of Agriculture, for Polk County in North Carolina. The infographic is intended to provide a simple, clear snapshot of local agriculture and the many ways in which it impacts local economies.
This infographic provides a visual interpretation of the 2022 Census of Agriculture, which is collected and maintained by the U.S. Department of Agriculture, for Brunswick County in North Carolina. The infographic is intended to provide a simple, clear snapshot of local agriculture and the many ways in which it impacts local economies.
This infographic provides a visual interpretation of the 2022 Census of Agriculture, which is collected and maintained by the U.S. Department of Agriculture, for Camden County in North Carolina. The infographic is intended to provide a simple, clear snapshot of local agriculture and the many ways in which it impacts local economies.
This infographic provides a visual interpretation of the 2022 Census of Agriculture, which is collected and maintained by the U.S. Department of Agriculture, for Clay County in North Carolina. The infographic is intended to provide a simple, clear snapshot of local agriculture and the many ways in which it impacts local economies.
This infographic provides a visual interpretation of the 2022 Census of Agriculture, which is collected and maintained by the U.S. Department of Agriculture, for Yancey County in North Carolina. The infographic is intended to provide a simple, clear snapshot of local agriculture and the many ways in which it impacts local economies.
This infographic provides a visual interpretation of the 2022 Census of Agriculture, which is collected and maintained by the U.S. Department of Agriculture, for Nash County in North Carolina. The infographic is intended to provide a simple, clear snapshot of local agriculture and the many ways in which it impacts local economies.
This infographic provides a visual interpretation of the 2022 Census of Agriculture, which is collected and maintained by the U.S. Department of Agriculture, for Northampton County in North Carolina. The infographic is intended to provide a simple, clear snapshot of local agriculture and the many ways in which it impacts local economies.
This infographic provides a visual interpretation of the 2022 Census of Agriculture, which is collected and maintained by the U.S. Department of Agriculture, for Yadkin County in North Carolina. The infographic is intended to provide a simple, clear snapshot of local agriculture and the many ways in which it impacts local economies.
This infographic provides a visual interpretation of the 2022 Census of Agriculture, which is collected and maintained by the U.S. Department of Agriculture, for Eastern Carolina Council of Government in North Carolina. The infographic is intended to provide a simple, clear snapshot of local agriculture and the many ways in which it impacts local economies. There are 16 regional Council of Governments (CoGs) across North Carolina. You can find more information about each CoG through the North Carolina Association of Regional Councils of Governments
This infographic provides a visual interpretation of the 2022 Census of Agriculture, which is collected and maintained by the U.S. Department of Agriculture, for Upper Coastal Plain Council of Government in North Carolina. The infographic is intended to provide a simple, clear snapshot of local agriculture and the many ways in which it impacts local economies. There are 16 regional Council of Governments (CoGs) across North Carolina. You can find more information about each CoG through the North Carolina Association of Regional Councils of Governments
This infographic provides a visual interpretation of the 2017 Census of Agriculture, which is collected and maintained by the U.S. Department of Agriculture, for Avery County in North Carolina. The infographic is intended to provide a simple, clear snapshot of local agriculture and the many ways in which it impacts local economies.
This infographic provides a visual interpretation of the 2017 Census of Agriculture, which is collected and maintained by the U.S. Department of Agriculture, for Brunswick County in North Carolina. The infographic is intended to provide a simple, clear snapshot of local agriculture and the many ways in which it impacts local economies.
This infographic provides a visual interpretation of the 2017 Census of Agriculture, which is collected and maintained by the U.S. Department of Agriculture, for Burke County in North Carolina. The infographic is intended to provide a simple, clear snapshot of local agriculture and the many ways in which it impacts local economies.
This infographic provides a visual interpretation of the 2017 Census of Agriculture, which is collected and maintained by the U.S. Department of Agriculture, for Greene County in North Carolina. The infographic is intended to provide a simple, clear snapshot of local agriculture and the many ways in which it impacts local economies.
This infographic provides a visual interpretation of the 2017 Census of Agriculture, which is collected and maintained by the U.S. Department of Agriculture, for Harnett County in North Carolina. The infographic is intended to provide a simple, clear snapshot of local agriculture and the many ways in which it impacts local economies.
This infographic provides a visual interpretation of the 2017 Census of Agriculture, which is collected and maintained by the U.S. Department of Agriculture, for Randolph County in North Carolina. The infographic is intended to provide a simple, clear snapshot of local agriculture and the many ways in which it impacts local economies.
This infographic provides a visual interpretation of the 2017 Census of Agriculture, which is collected and maintained by the U.S. Department of Agriculture, for Union County in North Carolina. The infographic is intended to provide a simple, clear snapshot of local agriculture and the many ways in which it impacts local economies.
This infographic provides a visual interpretation of the 2022 Census of Agriculture, which is collected and maintained by the U.S. Department of Agriculture, for Anson County in North Carolina. The infographic is intended to provide a simple, clear snapshot of local agriculture and the many ways in which it impacts local economies.
This infographic provides a visual interpretation of the 2022 Census of Agriculture, which is collected and maintained by the U.S. Department of Agriculture, for Avery County in North Carolina. The infographic is intended to provide a simple, clear snapshot of local agriculture and the many ways in which it impacts local economies.
This infographic provides a visual interpretation of the 2022 Census of Agriculture, which is collected and maintained by the U.S. Department of Agriculture, for Davie County in North Carolina. The infographic is intended to provide a simple, clear snapshot of local agriculture and the many ways in which it impacts local economies.
This infographic provides a visual interpretation of the 2022 Census of Agriculture, which is collected and maintained by the U.S. Department of Agriculture, for Greene County in North Carolina. The infographic is intended to provide a simple, clear snapshot of local agriculture and the many ways in which it impacts local economies.
This infographic provides a visual interpretation of the 2022 Census of Agriculture, which is collected and maintained by the U.S. Department of Agriculture, for Lenoir County in North Carolina. The infographic is intended to provide a simple, clear snapshot of local agriculture and the many ways in which it impacts local economies.
This infographic provides a visual interpretation of the 2022 Census of Agriculture, which is collected and maintained by the U.S. Department of Agriculture, for Mecklenburg County in North Carolina. The infographic is intended to provide a simple, clear snapshot of local agriculture and the many ways in which it impacts local economies.
This infographic provides a visual interpretation of the 2022 Census of Agriculture, which is collected and maintained by the U.S. Department of Agriculture, for Moore County in North Carolina. The infographic is intended to provide a simple, clear snapshot of local agriculture and the many ways in which it impacts local economies.
This infographic provides a visual interpretation of the 2022 Census of Agriculture, which is collected and maintained by the U.S. Department of Agriculture, for New Hanover County in North Carolina. The infographic is intended to provide a simple, clear snapshot of local agriculture and the many ways in which it impacts local economies.
This infographic provides a visual interpretation of the 2022 Census of Agriculture, which is collected and maintained by the U.S. Department of Agriculture, for Wayne County in North Carolina. The infographic is intended to provide a simple, clear snapshot of local agriculture and the many ways in which it impacts local economies.
This infographic provides a visual interpretation of the 2022 Census of Agriculture, which is collected and maintained by the U.S. Department of Agriculture, for Centralina Council of Government in North Carolina. The infographic is intended to provide a simple, clear snapshot of local agriculture and the many ways in which it impacts local economies. There are 16 regional Council of Governments (CoGs) across North Carolina. You can find more information about each CoG through the North Carolina Association of Regional Councils of Governments
This infographic provides a visual interpretation of the 2017 Census of Agriculture, which is collected and maintained by the U.S. Department of Agriculture, for Davie County in North Carolina. The infographic is intended to provide a simple, clear snapshot of local agriculture and the many ways in which it impacts local economies.
This infographic provides a visual interpretation of the 2017 Census of Agriculture, which is collected and maintained by the U.S. Department of Agriculture, for Stanly County in North Carolina. The infographic is intended to provide a simple, clear snapshot of local agriculture and the many ways in which it impacts local economies.
This infographic provides a visual interpretation of the 2017 Census of Agriculture, which is collected and maintained by the U.S. Department of Agriculture, for Washington County in North Carolina. The infographic is intended to provide a simple, clear snapshot of local agriculture and the many ways in which it impacts local economies.
This publication provides information to help farms make decisions about raising prices on meat products in a landscape of price increases.
This chapter of the Farm to Early Care and Education Resource Guide for North Carolina Extension Agents discusses the roles and benefits of farm to ECE programs.
This infographic provides a visual interpretation of the 2022 Census of Agriculture, which is collected and maintained by the U.S. Department of Agriculture, for Alexander County in North Carolina. The infographic is intended to provide a simple, clear snapshot of local agriculture and the many ways in which it impacts local economies.
This chapter of the Farm to Early Care and Education Resource Guide for North Carolina Extension Agents discusses how to ensure Farm to ECE programs are welcoming to all.
This infographic provides a visual interpretation of the 2022 Census of Agriculture, which is collected and maintained by the U.S. Department of Agriculture, for Cabarrus County in North Carolina. The infographic is intended to provide a simple, clear snapshot of local agriculture and the many ways in which it impacts local economies.
This infographic provides a visual interpretation of the 2022 Census of Agriculture, which is collected and maintained by the U.S. Department of Agriculture, for Cumberland County in North Carolina. The infographic is intended to provide a simple, clear snapshot of local agriculture and the many ways in which it impacts local economies.
This infographic provides a visual interpretation of the 2022 Census of Agriculture, which is collected and maintained by the U.S. Department of Agriculture, for Hyde County in North Carolina. The infographic is intended to provide a simple, clear snapshot of local agriculture and the many ways in which it impacts local economies.
This infographic provides a visual interpretation of the 2022 Census of Agriculture, which is collected and maintained by the U.S. Department of Agriculture, for Lee County in North Carolina. The infographic is intended to provide a simple, clear snapshot of local agriculture and the many ways in which it impacts local economies.
This infographic provides a visual interpretation of the 2022 Census of Agriculture, which is collected and maintained by the U.S. Department of Agriculture, for Martin County in North Carolina. The infographic is intended to provide a simple, clear snapshot of local agriculture and the many ways in which it impacts local economies.
This infographic provides a visual interpretation of the 2022 Census of Agriculture, which is collected and maintained by the U.S. Department of Agriculture, for McDowell County in North Carolina. The infographic is intended to provide a simple, clear snapshot of local agriculture and the many ways in which it impacts local economies.
This infographic provides a visual interpretation of the 2022 Census of Agriculture, which is collected and maintained by the U.S. Department of Agriculture, for Pasquotank County in North Carolina. The infographic is intended to provide a simple, clear snapshot of local agriculture and the many ways in which it impacts local economies.
This infographic provides a visual interpretation of the 2022 Census of Agriculture, which is collected and maintained by the U.S. Department of Agriculture, for Pitt County in North Carolina. The infographic is intended to provide a simple, clear snapshot of local agriculture and the many ways in which it impacts local economies.
This infographic provides a visual interpretation of the 2022 Census of Agriculture, which is collected and maintained by the U.S. Department of Agriculture, for Sampson County in North Carolina. The infographic is intended to provide a simple, clear snapshot of local agriculture and the many ways in which it impacts local economies.
This infographic provides a visual interpretation of the 2022 Census of Agriculture, which is collected and maintained by the U.S. Department of Agriculture, for High Country Council of Government in North Carolina. The infographic is intended to provide a simple, clear snapshot of local agriculture and the many ways in which it impacts local economies. There are 16 regional Council of Governments (CoGs) across North Carolina. You can find more information about each CoG through the North Carolina Association of Regional Councils of Governments
This infographic provides a visual interpretation of the 2017 Census of Agriculture, which is collected and maintained by the U.S. Department of Agriculture, for Clay County in North Carolina. The infographic is intended to provide a simple, clear snapshot of local agriculture and the many ways in which it impacts local economies.
This infographic provides a visual interpretation of the 2017 Census of Agriculture, which is collected and maintained by the U.S. Department of Agriculture, for Craven County in North Carolina. The infographic is intended to provide a simple, clear snapshot of local agriculture and the many ways in which it impacts local economies.
This infographic provides a visual interpretation of the 2017 Census of Agriculture, which is collected and maintained by the U.S. Department of Agriculture, for Davidson County in North Carolina. The infographic is intended to provide a simple, clear snapshot of local agriculture and the many ways in which it impacts local economies.
This infographic provides a visual interpretation of the 2017 Census of Agriculture, which is collected and maintained by the U.S. Department of Agriculture, for Franklin County in North Carolina. The infographic is intended to provide a simple, clear snapshot of local agriculture and the many ways in which it impacts local economies.
This infographic provides a visual interpretation of the 2017 Census of Agriculture, which is collected and maintained by the U.S. Department of Agriculture, for Jones County in North Carolina. The infographic is intended to provide a simple, clear snapshot of local agriculture and the many ways in which it impacts local economies.
This infographic provides a visual interpretation of the 2017 Census of Agriculture, which is collected and maintained by the U.S. Department of Agriculture, for Orange County in North Carolina. The infographic is intended to provide a simple, clear snapshot of local agriculture and the many ways in which it impacts local economies.
This infographic provides a visual interpretation of the 2017 Census of Agriculture, which is collected and maintained by the U.S. Department of Agriculture, for Pamlico County in North Carolina. The infographic is intended to provide a simple, clear snapshot of local agriculture and the many ways in which it impacts local economies.
This infographic provides a visual interpretation of the 2017 Census of Agriculture, which is collected and maintained by the U.S. Department of Agriculture, for Rowan County in North Carolina. The infographic is intended to provide a simple, clear snapshot of local agriculture and the many ways in which it impacts local economies.
This infographic provides a visual interpretation of the 2017 Census of Agriculture, which is collected and maintained by the U.S. Department of Agriculture, for Wake County in North Carolina. The infographic is intended to provide a simple, clear snapshot of local agriculture and the many ways in which it impacts local economies.
This infographic provides a visual interpretation of the 2022 Census of Agriculture, which is collected and maintained by the U.S. Department of Agriculture, for Bertie County in North Carolina. The infographic is intended to provide a simple, clear snapshot of local agriculture and the many ways in which it impacts local economies.
This infographic provides a visual interpretation of the 2022 Census of Agriculture, which is collected and maintained by the U.S. Department of Agriculture, for Buncombe County in North Carolina. The infographic is intended to provide a simple, clear snapshot of local agriculture and the many ways in which it impacts local economies.
This infographic provides a visual interpretation of the 2022 Census of Agriculture, which is collected and maintained by the U.S. Department of Agriculture, for Cherokee County in North Carolina. The infographic is intended to provide a simple, clear snapshot of local agriculture and the many ways in which it impacts local economies.
This infographic provides a visual interpretation of the 2022 Census of Agriculture, which is collected and maintained by the U.S. Department of Agriculture, for Craven County in North Carolina. The infographic is intended to provide a simple, clear snapshot of local agriculture and the many ways in which it impacts local economies.
This infographic provides a visual interpretation of the 2022 Census of Agriculture, which is collected and maintained by the U.S. Department of Agriculture, for Dare County in North Carolina. The infographic is intended to provide a simple, clear snapshot of local agriculture and the many ways in which it impacts local economies.
This infographic provides a visual interpretation of the 2022 Census of Agriculture, which is collected and maintained by the U.S. Department of Agriculture, for Lincoln County in North Carolina. The infographic is intended to provide a simple, clear snapshot of local agriculture and the many ways in which it impacts local economies.
This infographic provides a visual interpretation of the 2022 Census of Agriculture, which is collected and maintained by the U.S. Department of Agriculture, for Macon County in North Carolina. The infographic is intended to provide a simple, clear snapshot of local agriculture and the many ways in which it impacts local economies.
This infographic provides a visual interpretation of the 2022 Census of Agriculture, which is collected and maintained by the U.S. Department of Agriculture, for Robeson County in North Carolina. The infographic is intended to provide a simple, clear snapshot of local agriculture and the many ways in which it impacts local economies.
This infographic provides a visual interpretation of the 2022 Census of Agriculture, which is collected and maintained by the U.S. Department of Agriculture, for Rockingham County in North Carolina. The infographic is intended to provide a simple, clear snapshot of local agriculture and the many ways in which it impacts local economies.
This infographic provides a visual interpretation of the 2022 Census of Agriculture, which is collected and maintained by the U.S. Department of Agriculture, for Warren County in North Carolina. The infographic is intended to provide a simple, clear snapshot of local agriculture and the many ways in which it impacts local economies.
This infographic provides a visual interpretation of the 2022 Census of Agriculture, which is collected and maintained by the U.S. Department of Agriculture, for Wilson County in North Carolina. The infographic is intended to provide a simple, clear snapshot of local agriculture and the many ways in which it impacts local economies.
This infographic provides a visual interpretation of the 2022 Census of Agriculture, which is collected and maintained by the U.S. Department of Agriculture, for Cape Fear Council of Government in North Carolina. The infographic is intended to provide a simple, clear snapshot of local agriculture and the many ways in which it impacts local economies. There are 16 regional Council of Governments (CoGs) across North Carolina. You can find more information about each CoG through the North Carolina Association of Regional Councils of Governments
This infographic provides a visual interpretation of the 2017 Census of Agriculture, which is collected and maintained by the U.S. Department of Agriculture, for Alexander County in North Carolina. The infographic is intended to provide a simple, clear snapshot of local agriculture and the many ways in which it impacts local economies.
This infographic provides a visual interpretation of the 2017 Census of Agriculture, which is collected and maintained by the U.S. Department of Agriculture, for Cleveland County in North Carolina. The infographic is intended to provide a simple, clear snapshot of local agriculture and the many ways in which it impacts local economies.
This infographic provides a visual interpretation of the 2017 Census of Agriculture, which is collected and maintained by the U.S. Department of Agriculture, for Edgecombe County in North Carolina. The infographic is intended to provide a simple, clear snapshot of local agriculture and the many ways in which it impacts local economies.
This infographic provides a visual interpretation of the 2017 Census of Agriculture, which is collected and maintained by the U.S. Department of Agriculture, for Graham County in North Carolina. The infographic is intended to provide a simple, clear snapshot of local agriculture and the many ways in which it impacts local economies.
This infographic provides a visual interpretation of the 2017 Census of Agriculture, which is collected and maintained by the U.S. Department of Agriculture, for Haywood County in North Carolina. The infographic is intended to provide a simple, clear snapshot of local agriculture and the many ways in which it impacts local economies.
This infographic provides a visual interpretation of the 2017 Census of Agriculture, which is collected and maintained by the U.S. Department of Agriculture, for Jackson County in North Carolina. The infographic is intended to provide a simple, clear snapshot of local agriculture and the many ways in which it impacts local economies.
This infographic provides a visual interpretation of the 2017 Census of Agriculture, which is collected and maintained by the U.S. Department of Agriculture, for Wayne County in North Carolina. The infographic is intended to provide a simple, clear snapshot of local agriculture and the many ways in which it impacts local economies.
This infographic provides a visual interpretation of the 2017 Census of Agriculture, which is collected and maintained by the U.S. Department of Agriculture, for Wilkes County in North Carolina. The infographic is intended to provide a simple, clear snapshot of local agriculture and the many ways in which it impacts local economies.
A local food directory is a listing of farms and food businesses where customers can find local food. Directories are a tool to connect consumers and producers. People who want to buy local food have to know where to find it. Many Extension offices across the state either generate their own directory or provide support for one. Volunteers, such as Extension Master Food Volunteers can help by helping to gather information about farms and food businesses. This guide outlines a process on how to engage volunteers in building a local food directory.
This infographic provides a visual interpretation of the 2022 Census of Agriculture, which is collected and maintained by the U.S. Department of Agriculture, for Caswell County in North Carolina. The infographic is intended to provide a simple, clear snapshot of local agriculture and the many ways in which it impacts local economies.
This infographic provides a visual interpretation of the 2022 Census of Agriculture, which is collected and maintained by the U.S. Department of Agriculture, for Cleveland County in North Carolina. The infographic is intended to provide a simple, clear snapshot of local agriculture and the many ways in which it impacts local economies.
This infographic provides a visual interpretation of the 2022 Census of Agriculture, which is collected and maintained by the U.S. Department of Agriculture, for Edgecombe County in North Carolina. The infographic is intended to provide a simple, clear snapshot of local agriculture and the many ways in which it impacts local economies.
This infographic provides a visual interpretation of the 2022 Census of Agriculture, which is collected and maintained by the U.S. Department of Agriculture, for Iredell County in North Carolina. The infographic is intended to provide a simple, clear snapshot of local agriculture and the many ways in which it impacts local economies.
This infographic provides a visual interpretation of the 2022 Census of Agriculture, which is collected and maintained by the U.S. Department of Agriculture, for Jackson County in North Carolina. The infographic is intended to provide a simple, clear snapshot of local agriculture and the many ways in which it impacts local economies.
This infographic provides a visual interpretation of the 2022 Census of Agriculture, which is collected and maintained by the U.S. Department of Agriculture, for Polk County in North Carolina. The infographic is intended to provide a simple, clear snapshot of local agriculture and the many ways in which it impacts local economies.
This infographic provides a visual interpretation of the 2022 Census of Agriculture, which is collected and maintained by the U.S. Department of Agriculture, for Rutherford County in North Carolina. The infographic is intended to provide a simple, clear snapshot of local agriculture and the many ways in which it impacts local economies.
This infographic provides a visual interpretation of the 2022 Census of Agriculture, which is collected and maintained by the U.S. Department of Agriculture, for Surry County in North Carolina. The infographic is intended to provide a simple, clear snapshot of local agriculture and the many ways in which it impacts local economies.
This infographic provides a visual interpretation of the 2022 Census of Agriculture, which is collected and maintained by the U.S. Department of Agriculture, for Tyrrell County in North Carolina. The infographic is intended to provide a simple, clear snapshot of local agriculture and the many ways in which it impacts local economies.
This infographic provides a visual interpretation of the 2022 Census of Agriculture, which is collected and maintained by the U.S. Department of Agriculture, for Wilkes County in North Carolina. The infographic is intended to provide a simple, clear snapshot of local agriculture and the many ways in which it impacts local economies.
This infographic provides a visual interpretation of the 2022 Census of Agriculture, which is collected and maintained by the U.S. Department of Agriculture, for Central Pines Council of Government in North Carolina. The infographic is intended to provide a simple, clear snapshot of local agriculture and the many ways in which it impacts local economies. There are 16 regional Council of Governments (CoGs) across North Carolina. You can find more information about each CoG through the North Carolina Association of Regional Councils of Governments
This infographic provides a visual interpretation of the 2017 Census of Agriculture, which is collected and maintained by the U.S. Department of Agriculture, for Camden County in North Carolina. The infographic is intended to provide a simple, clear snapshot of local agriculture and the many ways in which it impacts local economies.
This infographic provides a visual interpretation of the 2017 Census of Agriculture, which is collected and maintained by the U.S. Department of Agriculture, for Dare County in North Carolina. The infographic is intended to provide a simple, clear snapshot of local agriculture and the many ways in which it impacts local economies.
This infographic provides a visual interpretation of the 2017 Census of Agriculture, which is collected and maintained by the U.S. Department of Agriculture, for New Hanover County in North Carolina. The infographic is intended to provide a simple, clear snapshot of local agriculture and the many ways in which it impacts local economies.
This infographic provides a visual interpretation of the 2017 Census of Agriculture, which is collected and maintained by the U.S. Department of Agriculture, for Pasquotank County in North Carolina. The infographic is intended to provide a simple, clear snapshot of local agriculture and the many ways in which it impacts local economies.
This infographic provides a visual interpretation of the 2017 Census of Agriculture, which is collected and maintained by the U.S. Department of Agriculture, for Richmond County in North Carolina. The infographic is intended to provide a simple, clear snapshot of local agriculture and the many ways in which it impacts local economies.
This infographic provides a visual interpretation of the 2017 Census of Agriculture, which is collected and maintained by the U.S. Department of Agriculture, for Scotland County in North Carolina. The infographic is intended to provide a simple, clear snapshot of local agriculture and the many ways in which it impacts local economies.
This infographic provides a visual interpretation of the 2022 Census of Agriculture, which is collected and maintained by the U.S. Department of Agriculture, for Alamance County in North Carolina. The infographic is intended to provide a simple, clear snapshot of local agriculture and the many ways in which it impacts local economies.
This infographic provides a visual interpretation of the 2022 Census of Agriculture, which is collected and maintained by the U.S. Department of Agriculture, for Chowan County in North Carolina. The infographic is intended to provide a simple, clear snapshot of local agriculture and the many ways in which it impacts local economies.
This infographic provides a visual interpretation of the 2022 Census of Agriculture, which is collected and maintained by the U.S. Department of Agriculture, for Franklin County in North Carolina. The infographic is intended to provide a simple, clear snapshot of local agriculture and the many ways in which it impacts local economies.
This infographic provides a visual interpretation of the 2022 Census of Agriculture, which is collected and maintained by the U.S. Department of Agriculture, for Hertford County in North Carolina. The infographic is intended to provide a simple, clear snapshot of local agriculture and the many ways in which it impacts local economies.
This infographic provides a visual interpretation of the 2022 Census of Agriculture, which is collected and maintained by the U.S. Department of Agriculture, for Madison County in North Carolina. The infographic is intended to provide a simple, clear snapshot of local agriculture and the many ways in which it impacts local economies.
This infographic provides a visual interpretation of the 2022 Census of Agriculture, which is collected and maintained by the U.S. Department of Agriculture, for Mitchell County in North Carolina. The infographic is intended to provide a simple, clear snapshot of local agriculture and the many ways in which it impacts local economies.
This infographic provides a visual interpretation of the 2022 Census of Agriculture, which is collected and maintained by the U.S. Department of Agriculture, for Foothills Council of Government in North Carolina. The infographic is intended to provide a simple, clear snapshot of local agriculture and the many ways in which it impacts local economies. There are 16 regional Council of Governments (CoGs) across North Carolina. You can find more information about each CoG through the North Carolina Association of Regional Councils of Governments
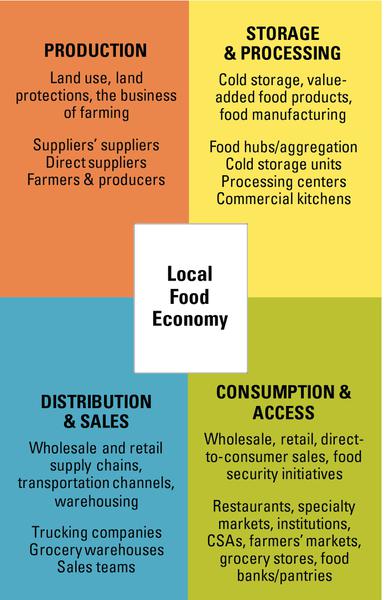
This publication serves as a guide on building local food economies for planners, economic developers, and local government professionals.
This infographic provides a visual interpretation of the 2017 Census of Agriculture, which is collected and maintained by the U.S. Department of Agriculture, for Alleghany County in North Carolina. The infographic is intended to provide a simple, clear snapshot of local agriculture and the many ways in which it impacts local economies.
This infographic provides a visual interpretation of the 2017 Census of Agriculture, which is collected and maintained by the U.S. Department of Agriculture, for Catawba County in North Carolina. The infographic is intended to provide a simple, clear snapshot of local agriculture and the many ways in which it impacts local economies.
This infographic provides a visual interpretation of the 2017 Census of Agriculture, which is collected and maintained by the U.S. Department of Agriculture, for Columbus County in North Carolina. The infographic is intended to provide a simple, clear snapshot of local agriculture and the many ways in which it impacts local economies.
This infographic provides a visual interpretation of the 2017 Census of Agriculture, which is collected and maintained by the U.S. Department of Agriculture, for Durham County in North Carolina. The infographic is intended to provide a simple, clear snapshot of local agriculture and the many ways in which it impacts local economies.
This infographic provides a visual interpretation of the 2017 Census of Agriculture, which is collected and maintained by the U.S. Department of Agriculture, for Gates County in North Carolina. The infographic is intended to provide a simple, clear snapshot of local agriculture and the many ways in which it impacts local economies.
This infographic provides a visual interpretation of the 2017 Census of Agriculture, which is collected and maintained by the U.S. Department of Agriculture, for Guilford County in North Carolina. The infographic is intended to provide a simple, clear snapshot of local agriculture and the many ways in which it impacts local economies.
This infographic provides a visual interpretation of the 2017 Census of Agriculture, which is collected and maintained by the U.S. Department of Agriculture, for Macon County in North Carolina. The infographic is intended to provide a simple, clear snapshot of local agriculture and the many ways in which it impacts local economies.
This infographic provides a visual interpretation of the 2017 Census of Agriculture, which is collected and maintained by the U.S. Department of Agriculture, for Northampton County in North Carolina. The infographic is intended to provide a simple, clear snapshot of local agriculture and the many ways in which it impacts local economies.
Online sales can benefit tech-savvy local food producers who are looking for an emerging way to connect with consumers. There are multiple online sales platforms that can help ease the administrative burden of direct-to-consumer sales and help with online marketing to reach consumers. Here is a list of resources that farmers can utilize and a list of questions to consider when thinking about adopting an online platform. With the growing popularity of online shopping, producers should consider becoming involved in online sales to consumers as a strategy to make their agribusiness more resilient.
This infographic provides a visual interpretation of the 2022 Census of Agriculture, which is collected and maintained by the U.S. Department of Agriculture, for Catawba County in North Carolina. The infographic is intended to provide a simple, clear snapshot of local agriculture and the many ways in which it impacts local economies.
This infographic provides a visual interpretation of the 2022 Census of Agriculture, which is collected and maintained by the U.S. Department of Agriculture, for Davidson County in North Carolina. The infographic is intended to provide a simple, clear snapshot of local agriculture and the many ways in which it impacts local economies.
This infographic provides a visual interpretation of the 2022 Census of Agriculture, which is collected and maintained by the U.S. Department of Agriculture, for Graham County in North Carolina. The infographic is intended to provide a simple, clear snapshot of local agriculture and the many ways in which it impacts local economies.
This infographic provides a visual interpretation of the 2022 Census of Agriculture, which is collected and maintained by the U.S. Department of Agriculture, for Hoke County in North Carolina. The infographic is intended to provide a simple, clear snapshot of local agriculture and the many ways in which it impacts local economies.
This infographic provides a visual interpretation of the 2022 Census of Agriculture, which is collected and maintained by the U.S. Department of Agriculture, for Jones County in North Carolina. The infographic is intended to provide a simple, clear snapshot of local agriculture and the many ways in which it impacts local economies.
This infographic provides a visual interpretation of the 2022 Census of Agriculture, which is collected and maintained by the U.S. Department of Agriculture, for Richmond County in North Carolina. The infographic is intended to provide a simple, clear snapshot of local agriculture and the many ways in which it impacts local economies.
This infographic provides a visual interpretation of the 2022 Census of Agriculture, which is collected and maintained by the U.S. Department of Agriculture, for Scotland County in North Carolina. The infographic is intended to provide a simple, clear snapshot of local agriculture and the many ways in which it impacts local economies.
This infographic provides a visual interpretation of the 2022 Census of Agriculture, which is collected and maintained by the U.S. Department of Agriculture, for Stanly County in North Carolina. The infographic is intended to provide a simple, clear snapshot of local agriculture and the many ways in which it impacts local economies.
This infographic provides a visual interpretation of the 2022 Census of Agriculture, which is collected and maintained by the U.S. Department of Agriculture, for Washington County in North Carolina. The infographic is intended to provide a simple, clear snapshot of local agriculture and the many ways in which it impacts local economies.
This infographic provides a visual interpretation of the 2022 Census of Agriculture, which is collected and maintained by the U.S. Department of Agriculture, for Albemarle Council of Government in North Carolina. The infographic is intended to provide a simple, clear snapshot of local agriculture and the many ways in which it impacts local economies. There are 16 regional Council of Governments (CoGs) across North Carolina. You can find more information about each CoG through the North Carolina Association of Regional Councils of Governments.
This infographic provides a visual interpretation of the 2017 Census of Agriculture, which is collected and maintained by the U.S. Department of Agriculture, for Onslow County in North Carolina. The infographic is intended to provide a simple, clear snapshot of local agriculture and the many ways in which it impacts local economies.
This infographic provides a visual interpretation of the 2022 Census of Agriculture, which is collected and maintained by the U.S. Department of Agriculture, for Duplin County in North Carolina. The infographic is intended to provide a simple, clear snapshot of local agriculture and the many ways in which it impacts local economies.
This infographic provides a visual interpretation of the 2022 Census of Agriculture, which is collected and maintained by the U.S. Department of Agriculture, for Forsyth County in North Carolina. The infographic is intended to provide a simple, clear snapshot of local agriculture and the many ways in which it impacts local economies.
This infographic provides a visual interpretation of the 2022 Census of Agriculture, which is collected and maintained by the U.S. Department of Agriculture, for Henderson County in North Carolina. The infographic is intended to provide a simple, clear snapshot of local agriculture and the many ways in which it impacts local economies.
This infographic provides a visual interpretation of the 2022 Census of Agriculture, which is collected and maintained by the U.S. Department of Agriculture, for Pender County in North Carolina. The infographic is intended to provide a simple, clear snapshot of local agriculture and the many ways in which it impacts local economies.
This infographic provides a visual interpretation of the 2017 Census of Agriculture, which is collected and maintained by the U.S. Department of Agriculture, for Surry County in North Carolina. The infographic is intended to provide a simple, clear snapshot of local agriculture and the many ways in which it impacts local economies.
This infographic provides a visual interpretation of the 2022 Census of Agriculture, which is collected and maintained by the U.S. Department of Agriculture, for Land of Sky Council of Government in North Carolina. The infographic is intended to provide a simple, clear snapshot of local agriculture and the many ways in which it impacts local economies. There are 16 regional Council of Governments (CoGs) across North Carolina. You can find more information about each CoG through the North Carolina Association of Regional Councils of Governments
This infographic provides a visual interpretation of the 2017 Census of Agriculture, which is collected and maintained by the U.S. Department of Agriculture, for Iredell County in North Carolina. The infographic is intended to provide a simple, clear snapshot of local agriculture and the many ways in which it impacts local economies.
This infographic provides a visual interpretation of the 2017 Census of Agriculture, which is collected and maintained by the U.S. Department of Agriculture, for Rutherford County in North Carolina. The infographic is intended to provide a simple, clear snapshot of local agriculture and the many ways in which it impacts local economies.
This infographic provides a visual interpretation of the 2022 Census of Agriculture, which is collected and maintained by the U.S. Department of Agriculture, for Carteret County in North Carolina. The infographic is intended to provide a simple, clear snapshot of local agriculture and the many ways in which it impacts local economies.
This infographic provides a visual interpretation of the 2022 Census of Agriculture, which is collected and maintained by the U.S. Department of Agriculture, for Swain County in North Carolina. The infographic is intended to provide a simple, clear snapshot of local agriculture and the many ways in which it impacts local economies.
This infographic provides a visual interpretation of the 2017 Census of Agriculture, which is collected and maintained by the U.S. Department of Agriculture, for Alamance County in North Carolina. The infographic is intended to provide a simple, clear snapshot of local agriculture and the many ways in which it impacts local economies.
This infographic provides a visual interpretation of the 2017 Census of Agriculture, which is collected and maintained by the U.S. Department of Agriculture, for Stokes County in North Carolina. The infographic is intended to provide a simple, clear snapshot of local agriculture and the many ways in which it impacts local economies.
Throughout 2020, food supply chains and market channels across the state and nation continued to be disrupted by the COVID-19 pandemic. This factsheet highlights the impact the pandemic had on specialty crop producers in North Carolina from May through July 2020 and from October through December 2020. These surveys were part of a series of surveys conducted by the Center for Environmental Farming Systems, the NC State Local Foods Program, and the NC State Department of Horticultural Science throughout 2020 to capture the impact of the COVID-19 pandemic on specialty crop producers within North Carolina.
This infographic provides a visual interpretation of the 2022 Census of Agriculture, which is collected and maintained by the U.S. Department of Agriculture, for Johnston County in North Carolina. The infographic is intended to provide a simple, clear snapshot of local agriculture and the many ways in which it impacts local economies.
This infographic provides a visual interpretation of the 2022 Census of Agriculture, which is collected and maintained by the U.S. Department of Agriculture, for Pamlico County in North Carolina. The infographic is intended to provide a simple, clear snapshot of local agriculture and the many ways in which it impacts local economies.
This infographic provides a visual interpretation of the 2022 Census of Agriculture, which is collected and maintained by the U.S. Department of Agriculture, for Rowan County in North Carolina. The infographic is intended to provide a simple, clear snapshot of local agriculture and the many ways in which it impacts local economies.
This infographic provides a visual interpretation of the 2022 Census of Agriculture, which is collected and maintained by the U.S. Department of Agriculture, for Stokes County in North Carolina. The infographic is intended to provide a simple, clear snapshot of local agriculture and the many ways in which it impacts local economies.
This infographic provides a visual interpretation of the 2022 Census of Agriculture, which is collected and maintained by the U.S. Department of Agriculture, for Vance County in North Carolina. The infographic is intended to provide a simple, clear snapshot of local agriculture and the many ways in which it impacts local economies.
This infographic provides a visual interpretation of the 2022 Census of Agriculture, which is collected and maintained by the U.S. Department of Agriculture, for Wake County in North Carolina. The infographic is intended to provide a simple, clear snapshot of local agriculture and the many ways in which it impacts local economies.
This infographic provides a visual interpretation of the 2022 Census of Agriculture, which is collected and maintained by the U.S. Department of Agriculture, for Southwestern Council of Government in North Carolina. The infographic is intended to provide a simple, clear snapshot of local agriculture and the many ways in which it impacts local economies. There are 16 regional Council of Governments (CoGs) across North Carolina. You can find more information about each CoG through the North Carolina Association of Regional Councils of Governments
This infographic provides a visual interpretation of the 2017 Census of Agriculture, which is collected and maintained by the U.S. Department of Agriculture, for Pender County in North Carolina. The infographic is intended to provide a simple, clear snapshot of local agriculture and the many ways in which it impacts local economies.
This infographic provides a visual interpretation of the 2022 Census of Agriculture, which is collected and maintained by the U.S. Department of Agriculture, for Randolph County in North Carolina. The infographic is intended to provide a simple, clear snapshot of local agriculture and the many ways in which it impacts local economies.
This infographic provides a visual interpretation of the 2017 Census of Agriculture, which is collected and maintained by the U.S. Department of Agriculture, for Vance County in North Carolina. The infographic is intended to provide a simple, clear snapshot of local agriculture and the many ways in which it impacts local economies.
This infographic provides a visual interpretation of the 2022 Census of Agriculture, which is collected and maintained by the U.S. Department of Agriculture, for Montgomery County in North Carolina. The infographic is intended to provide a simple, clear snapshot of local agriculture and the many ways in which it impacts local economies.
This infographic provides a visual interpretation of the 2022 Census of Agriculture, which is collected and maintained by the U.S. Department of Agriculture, for Gaston County in North Carolina. The infographic is intended to provide a simple, clear snapshot of local agriculture and the many ways in which it impacts local economies.
This infographic provides a visual interpretation of the 2022 Census of Agriculture, which is collected and maintained by the U.S. Department of Agriculture, for Onslow County in North Carolina. The infographic is intended to provide a simple, clear snapshot of local agriculture and the many ways in which it impacts local economies.
