Notify me when new publications are added.
This fact sheet provides key strategies for marketing local foods based on demographic trends seen in recent scholarly literature.
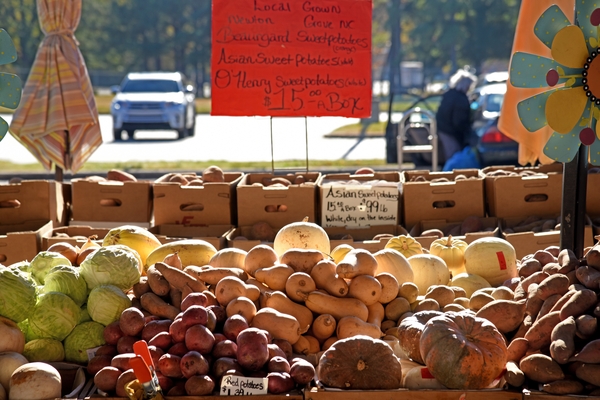
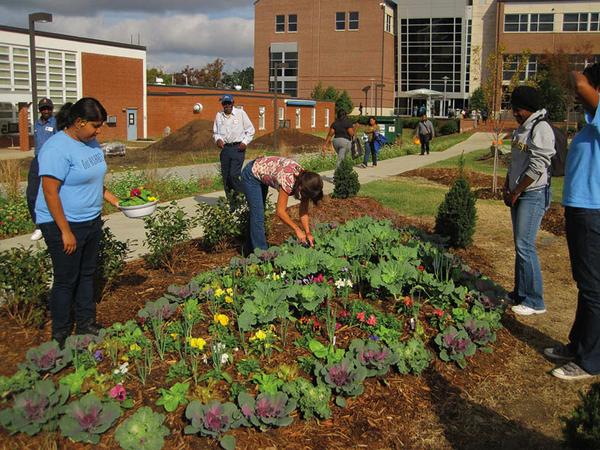
This publication discusses the environmental, economic, health, and community benefits that local food systems provide to communities.
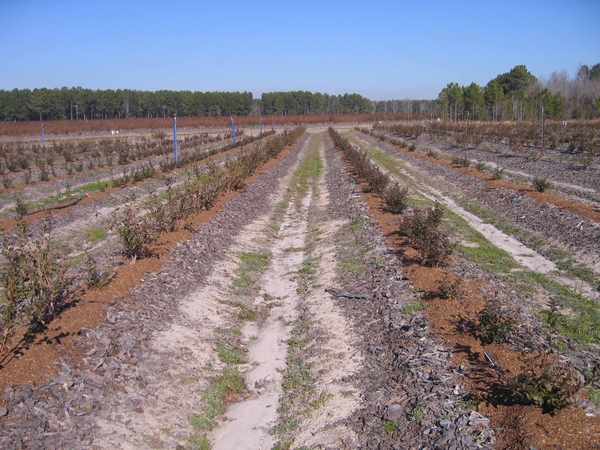
Blueberries are a native North American fruit, and North Carolina is one of the largest producers of highbush blueberries. Although commercial production is mostly limited to southeastern North Carolina, blueberries can be grown anywhere in the state if the right blueberry species and proper soil modifications are used. Limiting factors include pH, water availability and cold-hardiness.
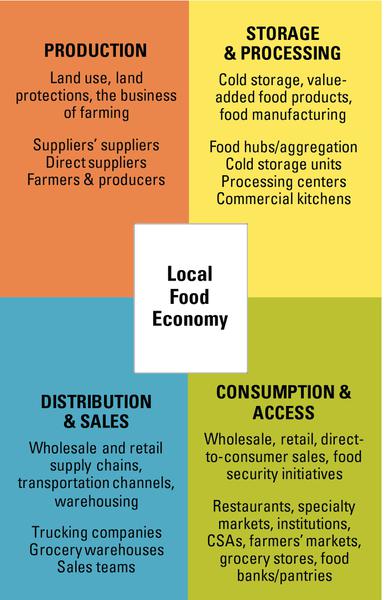
This publication serves as a guide on building local food economies for planners, economic developers, and local government professionals.

Social media usage is at an all time high, with the majority of individuals older than 18 saying they regularly use platforms like Facebook and YouTube. More than 60% of adults ages 18 to 29 routinely use Instagram, TikTok, and Snapchat. This means that one of the most effective ways to market local food to all age groups, and Millennials and Generation Z in particular, is through social media. Age, however, is not the only demographic to consider when marketing local food. Data also shows that gender plays a significant role in social media usage; women are more likely to use platforms like Facebook, Instagram, and TikTok than men regardless of their age. Agents should consider this when using social media and should focus on marketing to female consumers–a demographic that has already been shown to have favorable opinions of local food. Marketing local food is important for Extension agents who work in the local food space because N.C. Cooperative Extension’s purpose is to support agriculture and the people of North Carolina. The following is a set of best practices for social media usage to promote local food.
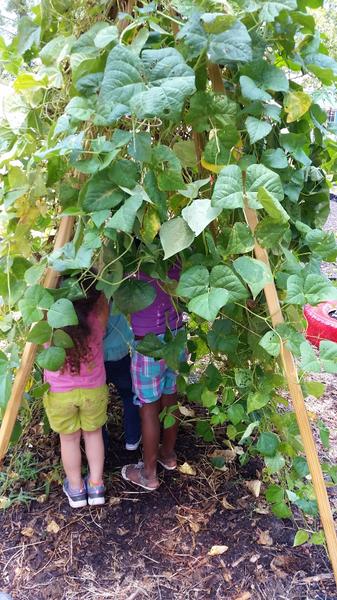
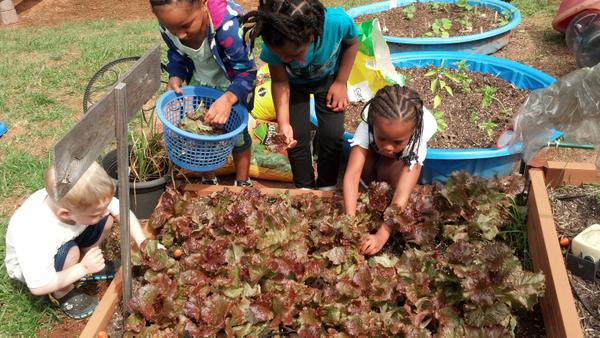
This publication focuses on developing fruit and vegetable production gardens in the Outdoor Learning Environment (OLE) of childcare centers. Included are basic garden design and layout to help childcare centers get started in year-round gardening activities. This is the second of fifteen publications about childcare center production gardens.

This factsheet is a guide to introducing children to common garden insects in an early childcare setting. It includes age-appropriate activities for childcare providers to engage young children in identifying garden insects at all life stages.

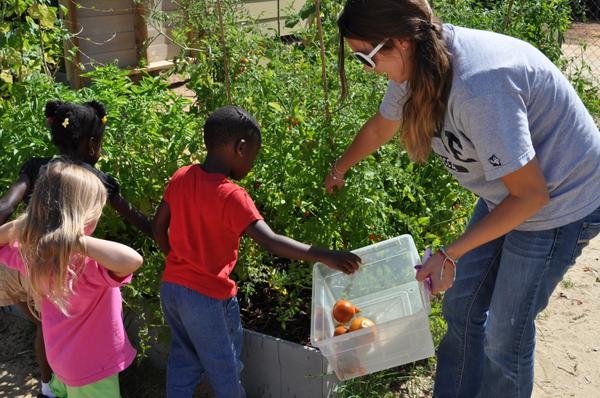
This factsheet summarizes the benefits of fruit and vegetable gardening with children. It includes age-appropriate activities for childcare providers to engage young children using fresh produce from the garden for cooking and eating.
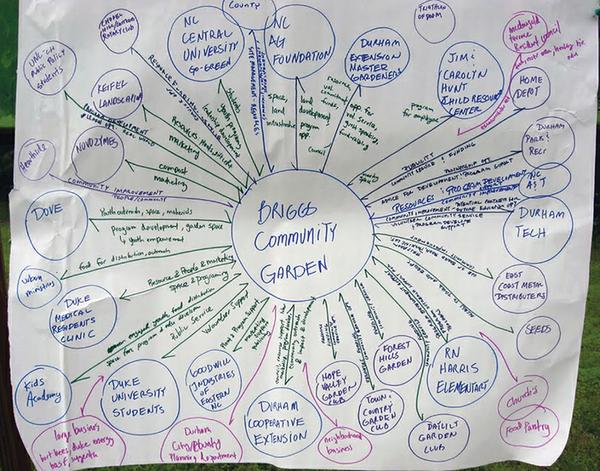
This publication, chapter 4 of Collard Greens and Common Ground: A North Carolina Community Food Gardening Handbook, discusses step-by-step methods for designing a new community food garden.
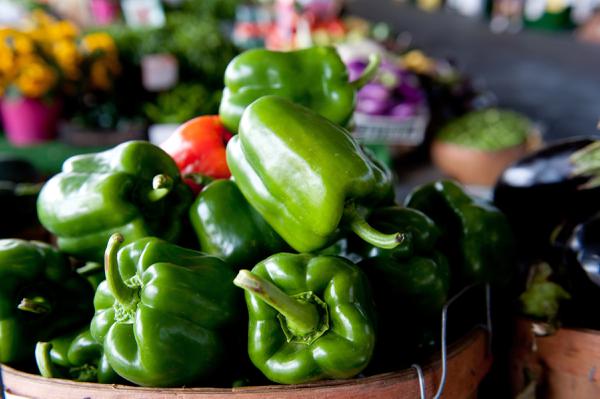
This publication provides guidance to retail and wholesale buyers about purchasing local foods for grocery stores.
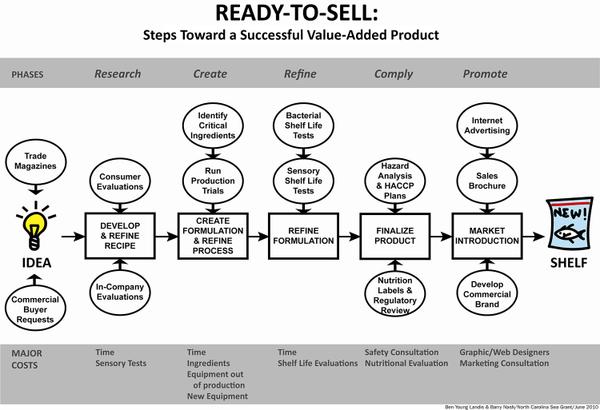
This publication introduces producers to general principles for successfully creating new value-added products and where to find specific guidance at each developmental stage.
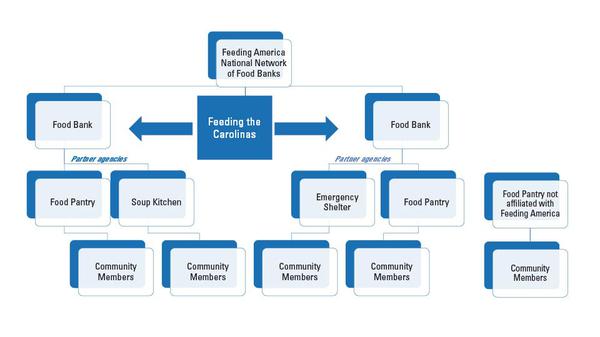
This publication, part of the Farm to Food Bank Resource Guide, describes food banks and food pantries and their role in North Carolina.
There are many different ways to buy local food, and this guide provides information that childcare centers and technical assistance providers can use to understand where to find local food, what to expect, and how to decide which local food source is right for different centers.
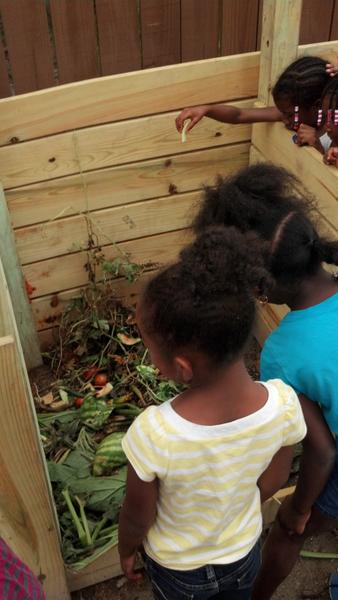
This publication is a how-to guide for starting a garden-related standard compost bin in a childcare center Outdoor Learning Environment (OLE). Included is guidance on design, construction, and management of compost bins as well as curriculum connections. This is the seventh of fifteen publications about childcare center production gardens.

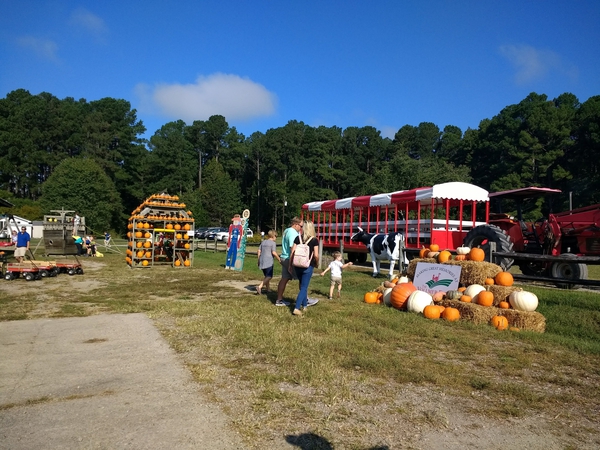
This publication shares the result of a survey study that aims to discover whether visiting agritourism facilities would spark an interest in local foods and local agricultural products by participants.
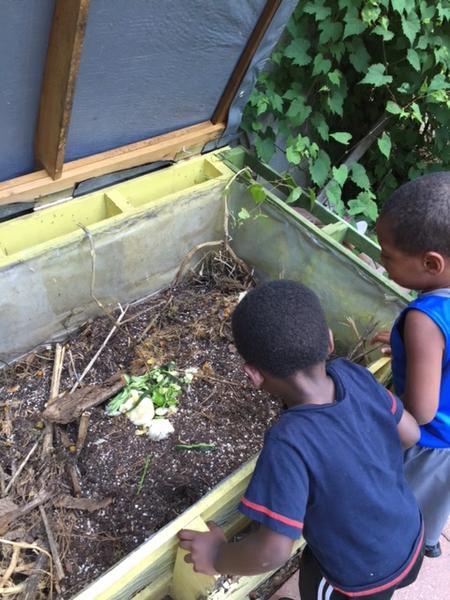
This publication is a how-to guide for starting a garden-related vermicomposting bin in a childcare center Outdoor Learning Environment (OLE) or indoors. Included is guidance on design, construction, and management of vermicomposting bins as well as curriculum connections. This is the eighth of fifteen publications about childcare center production gardens.
This publication, part of the Farm to Food Bank Resource Guide, discusses food donations given directly to food banks and food pantries in North Carolina.
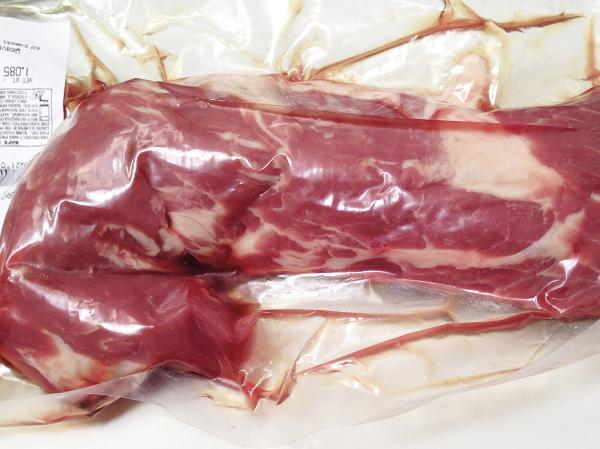
This publication provides information to help farms make decisions about raising prices on meat products in a landscape of price increases.
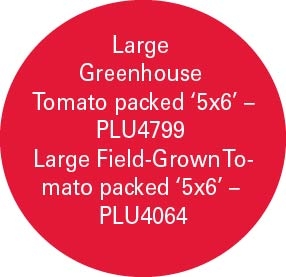
PLU and UPC codes are two widely used tracking mechanisms that help retailers efficiently ring produce into the register in the checkout lane, track sales, control inventory, and market products. Being knowledgeable about these labels in advance of approaching a retailer shows a grower’s awareness of the retailer’s industry. This factsheet contains information adapted from the Produce Marketing Association (Produce Marketing Association 2013).
This publication, chapter 3 of Collard Greens and Common Ground: A North Carolina Community Food Gardening Handbook, offers community garden organizers insight on choosing potential sites for a community food garden.

This publication will help you start selling fluid milk directly to grocery stores. Approaching retailers, labeling, invoicing, vendor requirements and delivery are covered.
This publication provides production protocol guidelines developed by North Carolina State University and Amazing Grazing to assist producers in creating local grass-fed beef production systems.

This chapter of the Farm to Early Care and Education Resource Guide for North Carolina Extension Agents discusses potential partner organizations.
This chapter of the Farm to Early Care and Education Resource Guide for North Carolina Extension Agents discusses special considerations for early childhood gardening, cooking, and local food programs and provides resources for successful Farm to ECE initiatives.
This publication focuses on easy-to-grow, child-friendly, cool-season vegetables suitable for childcare center gardening. This is the fourth of fifteen publications about childcare center production gardens.
This publication, chapter 9 of Collard Greens and Common Ground: A North Carolina Community Food Gardening Handbook, focuses on planting strategies and planting times for various crops in food gardens.

This resource guide explores how Early Care and Education programs serve families and show potential collaborations for Extension agents; inspires new local collaboration by highlighting successful programs within communities; and encourages cross-program activities to increase program support from Extension across North Carolina.
This publication focuses on easy-to-grow, child-friendly, warm-season fruits and vegetables suitable for childcare center gardening. This is the third of fifteen publications about childcare center production gardens.
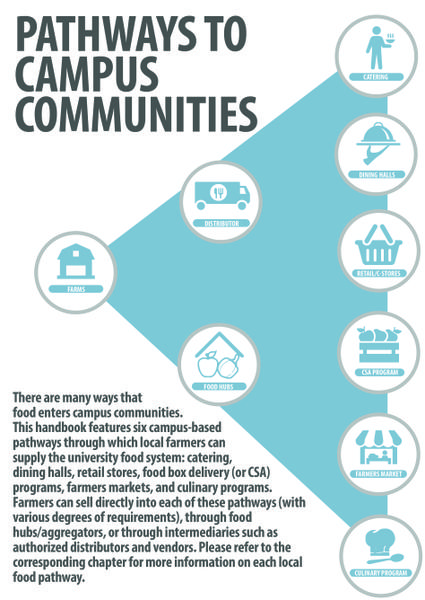
This guide provides information to Extension educators on Farm to University programming so farmers can take advantage of student demand for fresher, local foods. This programming helps drive campus demand for local foods and create connections between farmers and campus food services.
This publication documents the lessons learned by agritourism operators whose businesses were impacted by the COVID-19 crisis in North Carolina. Understanding the practices used by these operators provides insights for strengthening the industry's resilience during a public health crisis.

This publication includes simple recipes that childcare center cooks and educators can use to engage children in snacking and cooking with fresh cool-season fruits and vegetables from on-site production gardens and elsewhere. This is the sixth of fifteen publications about childcare center production gardens.
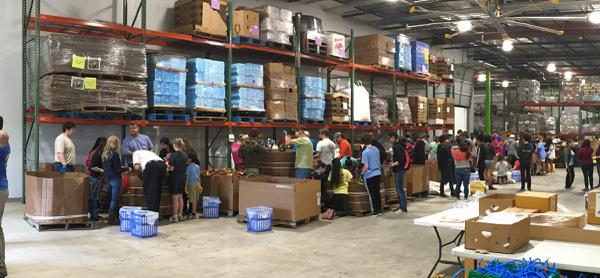
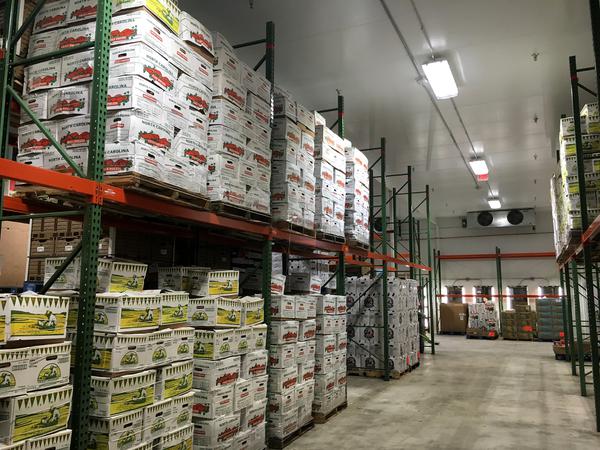
This publication provides information and success stories related to food banks, food pantries, food donation programs, and other resources for addressing food insecurity.
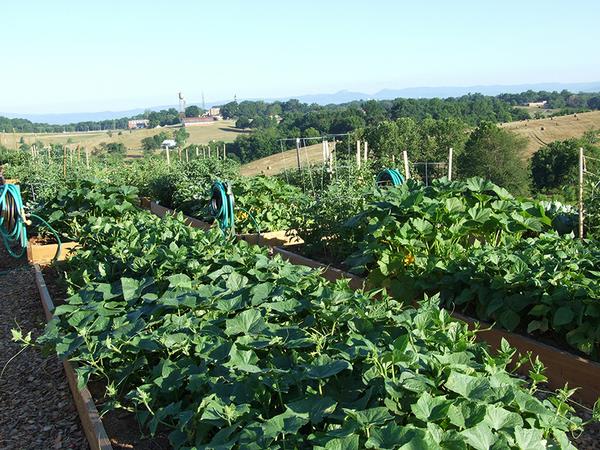
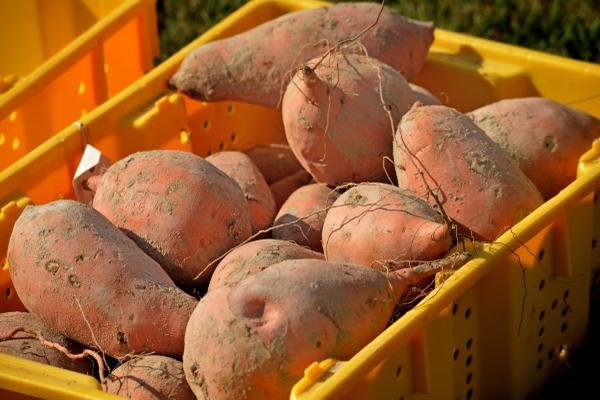
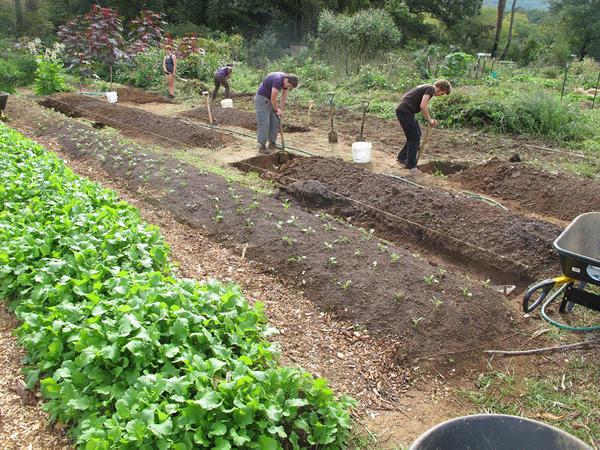
This guide provides an overview of market gardens for small and beginning farmers in North Carolina, with a focus on planning that can result in a profitable market garden enterprise. This publication is a starting reference point for anyone interested in market gardens.
With increasing demand for product transparency, a growing number of producers, processing plant operators, and packinghouse operators are interested in adding claims to the labels of their meat and poultry products to further characterize or add value to those products. Label claims become increasingly important for producers and plant operators selling to secondary markets, such as retail grocers, rather than direct to consumer. This guide provides information to producers about special claims and the requirements and documentation needed to support those claims.
This publication, chapter 2 of Collard Greens and Common Ground: A North Carolina Community Food Gardening Handbook, guides readers through several initial steps in starting a community garden.
This publication, chapter 10 of Collard Greens and Common Ground: A North Carolina Community Food Gardening Handbook, discusses food safety when growing crops in a community garden, including pesticides, sanitation, and irrigation.
This publication guides small- and medium-scale pastured meat producers in North Carolina through the steps of selling niche meat products to grocery stores.
A Farmers’ Market Tour is a great way to introduce your program participants to an abundant source of local fruits and vegetables. It can also reinforce messaging about healthy eating and local foods. This guide was designed to be used as part of a regular series of nutrition education classes, such as SNAP-Ed, the Expanded Food and Nutrition Education Program (EFNEP), Faithful Families Eating Smart and Moving More, or other community nutrition education programs.
This publication provides practical tips on how to promote health eating by incorporating fresh, local foods into nutrition education and cooking classes. Topics include getting started, knowing what's in season, and where to buy local foods.
This chapter of the Farm to Early Care and Education Resource Guide for North Carolina Extension Agents discusses how to ensure Farm to ECE programs are welcoming to all.

This publication provides production protocol guidelines developed by North Carolina State University and Amazing Grazing to assist producers in creating beef finishing systems.
 (1)-01_62zXfaM.jpg)
This publication provides production protocol guidelines developed by North Carolina State University and Amazing Grazing to assist producers in creating local pasture-raised and pasture-finished beef production systems.
This publication, chapter 13 of Collard Greens and Common Ground: A North Carolina Community Food Gardening Handbook, offers strategies for dealing with common gardening problems in a community garden setting.
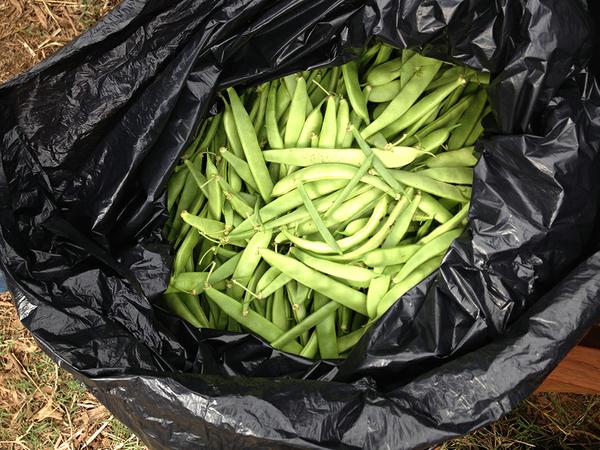
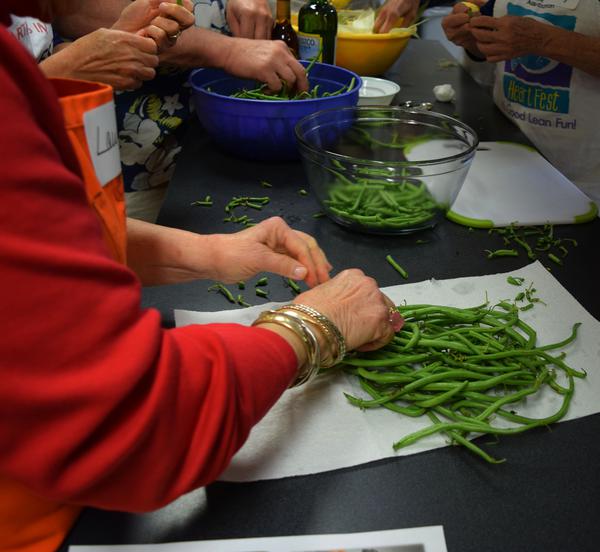
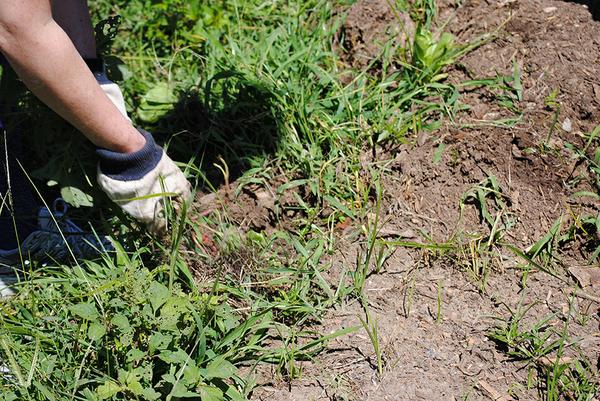
This publication, part of the Farm to Food Bank Resource Guide, discusses the process of gleaning in North Carolina.
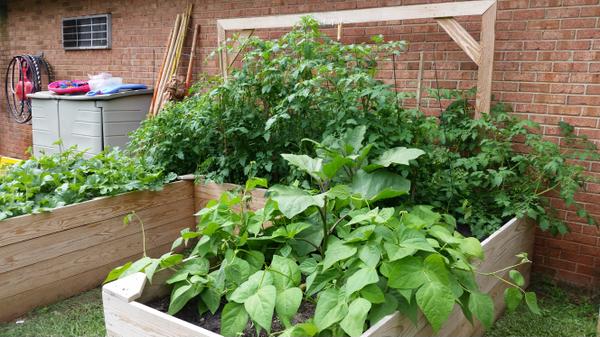
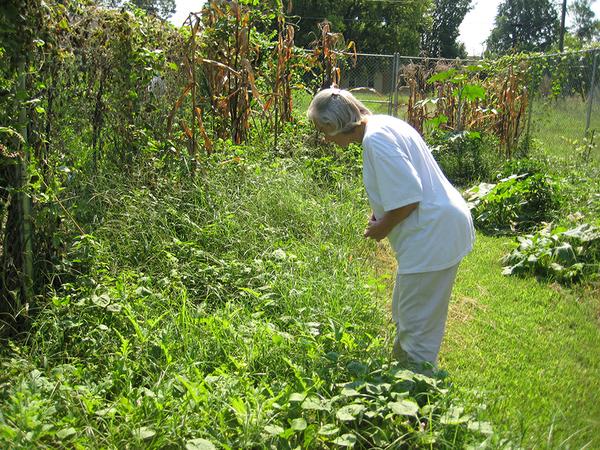
This publication, part of the Farm to Food Bank Resource Guide, discusses using community and home gardens to supplement food for food banks and pantries in North Carolina.
This publication includes simple recipes that childcare center cooks and educators can use to engage children in snacking and cooking with fresh warm-season fruits and vegetables from on-site production gardens and elsewhere. This is the fifth of fifteen publications about childcare center production gardens.

This publication, part of the Farm to Food Bank Resource Guide, discusses venison donation programs in North Carolina.
This infographic provides a visual interpretation of the 2017 Census of Agriculture, which is collected and maintained by the U.S. Department of Agriculture, for Lee County in North Carolina. The infographic is intended to provide a simple, clear snapshot of local agriculture and the many ways in which it impacts local economies.
This infographic provides a visual interpretation of the 2017 Census of Agriculture, which is collected and maintained by the U.S. Department of Agriculture, for North Carolina. The infographic is intended to provide a simple, clear snapshot of state agriculture and the many ways in which it impacts local economies.
This publication, part of the Farm to Food Bank Resource Guide, discusses setting up a market or farm stand at a food pantry in North Carolina.
This infographic provides a visual interpretation of the 2017 Census of Agriculture, which is collected and maintained by the U.S. Department of Agriculture, for Franklin County in North Carolina. The infographic is intended to provide a simple, clear snapshot of local agriculture and the many ways in which it impacts local economies.
This infographic provides a visual interpretation of the 2017 Census of Agriculture, which is collected and maintained by the U.S. Department of Agriculture, for Vance County in North Carolina. The infographic is intended to provide a simple, clear snapshot of local agriculture and the many ways in which it impacts local economies.
Throughout 2020, food supply chains and market channels across the state and nation continued to be disrupted by the COVID-19 pandemic. This factsheet highlights the impact the pandemic had on specialty crop producers in North Carolina from May through July 2020 and from October through December 2020. These surveys were part of a series of surveys conducted by the Center for Environmental Farming Systems, the NC State Local Foods Program, and the NC State Department of Horticultural Science throughout 2020 to capture the impact of the COVID-19 pandemic on specialty crop producers within North Carolina.
 (1)-01.jpg)
This publication is an introduction to the three production protocol guidelines developed by North Carolina State University and Amazing Grazing to assist producers in creating beef finishing systems.

This publication, part of the Farm to Food Bank Resource Guide, discusses 4-H projects that raise and harvest chickens for local food pantries in North Carolina.
This infographic provides a visual interpretation of the 2017 Census of Agriculture, which is collected and maintained by the U.S. Department of Agriculture, for Granville County in North Carolina. The infographic is intended to provide a simple, clear snapshot of local agriculture and the many ways in which it impacts local economies.
This infographic provides a visual interpretation of the 2017 Census of Agriculture, which is collected and maintained by the U.S. Department of Agriculture, for Mecklenburg County in North Carolina. The infographic is intended to provide a simple, clear snapshot of local agriculture and the many ways in which it impacts local economies.
This infographic provides a visual interpretation of the 2017 Census of Agriculture, which is collected and maintained by the U.S. Department of Agriculture, for Pamlico County in North Carolina. The infographic is intended to provide a simple, clear snapshot of local agriculture and the many ways in which it impacts local economies.
Online sales can benefit tech-savvy local food producers who are looking for an emerging way to connect with consumers. There are multiple online sales platforms that can help ease the administrative burden of direct-to-consumer sales and help with online marketing to reach consumers. Here is a list of resources that farmers can utilize and a list of questions to consider when thinking about adopting an online platform. With the growing popularity of online shopping, producers should consider becoming involved in online sales to consumers as a strategy to make their agribusiness more resilient.
This publication, chapter 7 of Collard Greens and Common Ground: A North Carolina Community Food Gardening Handbook, offers users management tips for a community garden, including a seasonal maintenance calendar.
This infographic provides a visual interpretation of the 2017 Census of Agriculture, which is collected and maintained by the U.S. Department of Agriculture, for Currituck County in North Carolina. The infographic is intended to provide a simple, clear snapshot of local agriculture and the many ways in which it impacts local economies.
This infographic provides a visual interpretation of the 2017 Census of Agriculture, which is collected and maintained by the U.S. Department of Agriculture, for Orange County in North Carolina. The infographic is intended to provide a simple, clear snapshot of local agriculture and the many ways in which it impacts local economies.
A local food directory is a listing of farms and food businesses where customers can find local food. Directories are a tool to connect consumers and producers. People who want to buy local food have to know where to find it. Many Extension offices across the state either generate their own directory or provide support for one. Volunteers, such as Extension Master Food Volunteers can help by helping to gather information about farms and food businesses. This guide outlines a process on how to engage volunteers in building a local food directory.
This publication presents the results of interviews with women in agritourism across North Carolina. It discusses the successes, challenges, and opportunities these women face in the agritourism industry and offers conclusions on strategies to overcome challenges and improve success.
This infographic provides a visual interpretation of the 2017 Census of Agriculture, which is collected and maintained by the U.S. Department of Agriculture, for Burke County in North Carolina. The infographic is intended to provide a simple, clear snapshot of local agriculture and the many ways in which it impacts local economies.
This infographic provides a visual interpretation of the 2017 Census of Agriculture, which is collected and maintained by the U.S. Department of Agriculture, for Halifax County in North Carolina. The infographic is intended to provide a simple, clear snapshot of local agriculture and the many ways in which it impacts local economies.
This infographic provides a visual interpretation of the 2017 Census of Agriculture, which is collected and maintained by the U.S. Department of Agriculture, for Jackson County in North Carolina. The infographic is intended to provide a simple, clear snapshot of local agriculture and the many ways in which it impacts local economies.
This infographic provides a visual interpretation of the 2017 Census of Agriculture, which is collected and maintained by the U.S. Department of Agriculture, for Mitchell County in North Carolina. The infographic is intended to provide a simple, clear snapshot of local agriculture and the many ways in which it impacts local economies.
This infographic provides a visual interpretation of the 2017 Census of Agriculture, which is collected and maintained by the U.S. Department of Agriculture, for Swain County in North Carolina. The infographic is intended to provide a simple, clear snapshot of local agriculture and the many ways in which it impacts local economies.
This infographic provides a visual interpretation of the 2017 Census of Agriculture, which is collected and maintained by the U.S. Department of Agriculture, for Wake County in North Carolina. The infographic is intended to provide a simple, clear snapshot of local agriculture and the many ways in which it impacts local economies.
This chapter of the Farm to Early Care and Education Resource Guide for North Carolina Extension Agents discusses the roles and benefits of farm to ECE programs.
This infographic provides a visual interpretation of the 2017 Census of Agriculture, which is collected and maintained by the U.S. Department of Agriculture, for Alamance County in North Carolina. The infographic is intended to provide a simple, clear snapshot of local agriculture and the many ways in which it impacts local economies.
This infographic provides a visual interpretation of the 2017 Census of Agriculture, which is collected and maintained by the U.S. Department of Agriculture, for Avery County in North Carolina. The infographic is intended to provide a simple, clear snapshot of local agriculture and the many ways in which it impacts local economies.
This infographic provides a visual interpretation of the 2017 Census of Agriculture, which is collected and maintained by the U.S. Department of Agriculture, for Buncombe County in North Carolina. The infographic is intended to provide a simple, clear snapshot of local agriculture and the many ways in which it impacts local economies.
This infographic provides a visual interpretation of the 2017 Census of Agriculture, which is collected and maintained by the U.S. Department of Agriculture, for Caldwell County in North Carolina. The infographic is intended to provide a simple, clear snapshot of local agriculture and the many ways in which it impacts local economies.
This infographic provides a visual interpretation of the 2017 Census of Agriculture, which is collected and maintained by the U.S. Department of Agriculture, for Cumberland County in North Carolina. The infographic is intended to provide a simple, clear snapshot of local agriculture and the many ways in which it impacts local economies.
This infographic provides a visual interpretation of the 2017 Census of Agriculture, which is collected and maintained by the U.S. Department of Agriculture, for Gaston County in North Carolina. The infographic is intended to provide a simple, clear snapshot of local agriculture and the many ways in which it impacts local economies.
This infographic provides a visual interpretation of the 2017 Census of Agriculture, which is collected and maintained by the U.S. Department of Agriculture, for Lenoir County in North Carolina. The infographic is intended to provide a simple, clear snapshot of local agriculture and the many ways in which it impacts local economies.
This infographic provides a visual interpretation of the 2017 Census of Agriculture, which is collected and maintained by the U.S. Department of Agriculture, for Northampton County in North Carolina. The infographic is intended to provide a simple, clear snapshot of local agriculture and the many ways in which it impacts local economies.
This infographic provides a visual interpretation of the 2017 Census of Agriculture, which is collected and maintained by the U.S. Department of Agriculture, for Onslow County in North Carolina. The infographic is intended to provide a simple, clear snapshot of local agriculture and the many ways in which it impacts local economies.
This infographic provides a visual interpretation of the 2017 Census of Agriculture, which is collected and maintained by the U.S. Department of Agriculture, for Pitt County in North Carolina. The infographic is intended to provide a simple, clear snapshot of local agriculture and the many ways in which it impacts local economies.
This infographic provides a visual interpretation of the 2017 Census of Agriculture, which is collected and maintained by the U.S. Department of Agriculture, for Robeson County in North Carolina. The infographic is intended to provide a simple, clear snapshot of local agriculture and the many ways in which it impacts local economies.
This infographic provides a visual interpretation of the 2017 Census of Agriculture, which is collected and maintained by the U.S. Department of Agriculture, for Rockingham County in North Carolina. The infographic is intended to provide a simple, clear snapshot of local agriculture and the many ways in which it impacts local economies.
This infographic provides a visual interpretation of the 2017 Census of Agriculture, which is collected and maintained by the U.S. Department of Agriculture, for Tyrrell County in North Carolina. The infographic is intended to provide a simple, clear snapshot of local agriculture and the many ways in which it impacts local economies.
This infographic provides a visual interpretation of the 2017 Census of Agriculture, which is collected and maintained by the U.S. Department of Agriculture, for Washington County in North Carolina. The infographic is intended to provide a simple, clear snapshot of local agriculture and the many ways in which it impacts local economies.
This infographic provides a visual interpretation of the 2017 Census of Agriculture, which is collected and maintained by the U.S. Department of Agriculture, for Watauga County in North Carolina. The infographic is intended to provide a simple, clear snapshot of local agriculture and the many ways in which it impacts local economies.
This infographic provides a visual interpretation of the 2017 Census of Agriculture, which is collected and maintained by the U.S. Department of Agriculture, for Beaufort County in North Carolina. The infographic is intended to provide a simple, clear snapshot of local agriculture and the many ways in which it impacts local economies.
This infographic provides a visual interpretation of the 2017 Census of Agriculture, which is collected and maintained by the U.S. Department of Agriculture, for Henderson County in North Carolina. The infographic is intended to provide a simple, clear snapshot of local agriculture and the many ways in which it impacts local economies.
This infographic provides a visual interpretation of the 2017 Census of Agriculture, which is collected and maintained by the U.S. Department of Agriculture, for Hoke County in North Carolina. The infographic is intended to provide a simple, clear snapshot of local agriculture and the many ways in which it impacts local economies.
This infographic provides a visual interpretation of the 2017 Census of Agriculture, which is collected and maintained by the U.S. Department of Agriculture, for Pasquotank County in North Carolina. The infographic is intended to provide a simple, clear snapshot of local agriculture and the many ways in which it impacts local economies.
This infographic provides a visual interpretation of the 2017 Census of Agriculture, which is collected and maintained by the U.S. Department of Agriculture, for Rutherford County in North Carolina. The infographic is intended to provide a simple, clear snapshot of local agriculture and the many ways in which it impacts local economies.
This infographic provides a visual interpretation of the 2017 Census of Agriculture, which is collected and maintained by the U.S. Department of Agriculture, for Stokes County in North Carolina. The infographic is intended to provide a simple, clear snapshot of local agriculture and the many ways in which it impacts local economies.
This infographic provides a visual interpretation of the 2017 Census of Agriculture, which is collected and maintained by the U.S. Department of Agriculture, for Surry County in North Carolina. The infographic is intended to provide a simple, clear snapshot of local agriculture and the many ways in which it impacts local economies.
This infographic provides a visual interpretation of the 2017 Census of Agriculture, which is collected and maintained by the U.S. Department of Agriculture, for Union County in North Carolina. The infographic is intended to provide a simple, clear snapshot of local agriculture and the many ways in which it impacts local economies.
This infographic provides a visual interpretation of the 2017 Census of Agriculture, which is collected and maintained by the U.S. Department of Agriculture, for Wilkes County in North Carolina. The infographic is intended to provide a simple, clear snapshot of local agriculture and the many ways in which it impacts local economies.
This infographic provides a visual interpretation of the 2017 Census of Agriculture, which is collected and maintained by the U.S. Department of Agriculture, for Wilson County in North Carolina. The infographic is intended to provide a simple, clear snapshot of local agriculture and the many ways in which it impacts local economies.
This infographic provides a visual interpretation of the 2017 Census of Agriculture, which is collected and maintained by the U.S. Department of Agriculture, for Bertie County in North Carolina. The infographic is intended to provide a simple, clear snapshot of local agriculture and the many ways in which it impacts local economies.
This infographic provides a visual interpretation of the 2017 Census of Agriculture, which is collected and maintained by the U.S. Department of Agriculture, for Catawba County in North Carolina. The infographic is intended to provide a simple, clear snapshot of local agriculture and the many ways in which it impacts local economies.
This infographic provides a visual interpretation of the 2017 Census of Agriculture, which is collected and maintained by the U.S. Department of Agriculture, for Cherokee County in North Carolina. The infographic is intended to provide a simple, clear snapshot of local agriculture and the many ways in which it impacts local economies.
This infographic provides a visual interpretation of the 2017 Census of Agriculture, which is collected and maintained by the U.S. Department of Agriculture, for Clay County in North Carolina. The infographic is intended to provide a simple, clear snapshot of local agriculture and the many ways in which it impacts local economies.
This infographic provides a visual interpretation of the 2017 Census of Agriculture, which is collected and maintained by the U.S. Department of Agriculture, for Cleveland County in North Carolina. The infographic is intended to provide a simple, clear snapshot of local agriculture and the many ways in which it impacts local economies.
This infographic provides a visual interpretation of the 2017 Census of Agriculture, which is collected and maintained by the U.S. Department of Agriculture, for Davidson County in North Carolina. The infographic is intended to provide a simple, clear snapshot of local agriculture and the many ways in which it impacts local economies.
This infographic provides a visual interpretation of the 2017 Census of Agriculture, which is collected and maintained by the U.S. Department of Agriculture, for Davie County in North Carolina. The infographic is intended to provide a simple, clear snapshot of local agriculture and the many ways in which it impacts local economies.
This infographic provides a visual interpretation of the 2017 Census of Agriculture, which is collected and maintained by the U.S. Department of Agriculture, for Durham County in North Carolina. The infographic is intended to provide a simple, clear snapshot of local agriculture and the many ways in which it impacts local economies.
This infographic provides a visual interpretation of the 2017 Census of Agriculture, which is collected and maintained by the U.S. Department of Agriculture, for Guilford County in North Carolina. The infographic is intended to provide a simple, clear snapshot of local agriculture and the many ways in which it impacts local economies.
This infographic provides a visual interpretation of the 2017 Census of Agriculture, which is collected and maintained by the U.S. Department of Agriculture, for Harnett County in North Carolina. The infographic is intended to provide a simple, clear snapshot of local agriculture and the many ways in which it impacts local economies.
This infographic provides a visual interpretation of the 2017 Census of Agriculture, which is collected and maintained by the U.S. Department of Agriculture, for Haywood County in North Carolina. The infographic is intended to provide a simple, clear snapshot of local agriculture and the many ways in which it impacts local economies.
This infographic provides a visual interpretation of the 2017 Census of Agriculture, which is collected and maintained by the U.S. Department of Agriculture, for Johnson County in North Carolina. The infographic is intended to provide a simple, clear snapshot of local agriculture and the many ways in which it impacts local economies.
This infographic provides a visual interpretation of the 2017 Census of Agriculture, which is collected and maintained by the U.S. Department of Agriculture, for Montgomery County in North Carolina. The infographic is intended to provide a simple, clear snapshot of local agriculture and the many ways in which it impacts local economies.
This infographic provides a visual interpretation of the 2017 Census of Agriculture, which is collected and maintained by the U.S. Department of Agriculture, for New Hanover County in North Carolina. The infographic is intended to provide a simple, clear snapshot of local agriculture and the many ways in which it impacts local economies.
This infographic provides a visual interpretation of the 2017 Census of Agriculture, which is collected and maintained by the U.S. Department of Agriculture, for Perquimans County in North Carolina. The infographic is intended to provide a simple, clear snapshot of local agriculture and the many ways in which it impacts local economies.
This infographic provides a visual interpretation of the 2017 Census of Agriculture, which is collected and maintained by the U.S. Department of Agriculture, for Polk County in North Carolina. The infographic is intended to provide a simple, clear snapshot of local agriculture and the many ways in which it impacts local economies.
This infographic provides a visual interpretation of the 2017 Census of Agriculture, which is collected and maintained by the U.S. Department of Agriculture, for Rowan County in North Carolina. The infographic is intended to provide a simple, clear snapshot of local agriculture and the many ways in which it impacts local economies.
This infographic provides a visual interpretation of the 2017 Census of Agriculture, which is collected and maintained by the U.S. Department of Agriculture, for Transylvania County in North Carolina. The infographic is intended to provide a simple, clear snapshot of local agriculture and the many ways in which it impacts local economies.
This infographic provides a visual interpretation of the 2017 Census of Agriculture, which is collected and maintained by the U.S. Department of Agriculture, for Yadkin County in North Carolina. The infographic is intended to provide a simple, clear snapshot of local agriculture and the many ways in which it impacts local economies.
This infographic provides a visual interpretation of the 2017 Census of Agriculture, which is collected and maintained by the U.S. Department of Agriculture, for Alexander County in North Carolina. The infographic is intended to provide a simple, clear snapshot of local agriculture and the many ways in which it impacts local economies.
Vacationer Supported Agriculture (VSA) is a project led by NC State’s P1tLab and NC State Extension (Local Foods, Community Development, and Tourism Extension) aiming to connect small farmers with new opportunities to increase farm revenue through direct sales of fresh produce. VSA meets discerning vacationers’ desires to: a) have convenient access to fresh local produce, b) connect with the place they are visiting by buying from local farms, and c) leave positive impacts in the destinations they visit, by coordinating the sale and delivery of produce bags from local farmers. VSA enables vacation home realties to showcase their commitment to the sustainable and equitable development of their local communities by recommending the produce bags to their guests. In each county, the Extension Center and Tourism Authority play the critical role of recruiting and supporting local farmer groups and vacation home rentals. In turn they receive records of the impact this initiative had on farmer revenue and destination competitiveness.
This infographic provides a visual interpretation of the 2017 Census of Agriculture, which is collected and maintained by the U.S. Department of Agriculture, for Brunswick County in North Carolina. The infographic is intended to provide a simple, clear snapshot of local agriculture and the many ways in which it impacts local economies.
This infographic provides a visual interpretation of the 2017 Census of Agriculture, which is collected and maintained by the U.S. Department of Agriculture, for Cabarrus County in North Carolina. The infographic is intended to provide a simple, clear snapshot of local agriculture and the many ways in which it impacts local economies.
This infographic provides a visual interpretation of the 2017 Census of Agriculture, which is collected and maintained by the U.S. Department of Agriculture, for Forsyth County in North Carolina. The infographic is intended to provide a simple, clear snapshot of local agriculture and the many ways in which it impacts local economies.
This infographic provides a visual interpretation of the 2017 Census of Agriculture, which is collected and maintained by the U.S. Department of Agriculture, for Gates County in North Carolina. The infographic is intended to provide a simple, clear snapshot of local agriculture and the many ways in which it impacts local economies.
This infographic provides a visual interpretation of the 2017 Census of Agriculture, which is collected and maintained by the U.S. Department of Agriculture, for Hertford County in North Carolina. The infographic is intended to provide a simple, clear snapshot of local agriculture and the many ways in which it impacts local economies.
This infographic provides a visual interpretation of the 2017 Census of Agriculture, which is collected and maintained by the U.S. Department of Agriculture, for Hyde County in North Carolina. The infographic is intended to provide a simple, clear snapshot of local agriculture and the many ways in which it impacts local economies.
This infographic provides a visual interpretation of the 2017 Census of Agriculture, which is collected and maintained by the U.S. Department of Agriculture, for Jones County in North Carolina. The infographic is intended to provide a simple, clear snapshot of local agriculture and the many ways in which it impacts local economies.
This infographic provides a visual interpretation of the 2017 Census of Agriculture, which is collected and maintained by the U.S. Department of Agriculture, for Nash County in North Carolina. The infographic is intended to provide a simple, clear snapshot of local agriculture and the many ways in which it impacts local economies.
This infographic provides a visual interpretation of the 2017 Census of Agriculture, which is collected and maintained by the U.S. Department of Agriculture, for Pender County in North Carolina. The infographic is intended to provide a simple, clear snapshot of local agriculture and the many ways in which it impacts local economies.
This infographic provides a visual interpretation of the 2017 Census of Agriculture, which is collected and maintained by the U.S. Department of Agriculture, for Person County in North Carolina. The infographic is intended to provide a simple, clear snapshot of local agriculture and the many ways in which it impacts local economies.
This infographic provides a visual interpretation of the 2017 Census of Agriculture, which is collected and maintained by the U.S. Department of Agriculture, for Richmond County in North Carolina. The infographic is intended to provide a simple, clear snapshot of local agriculture and the many ways in which it impacts local economies.
This infographic provides a visual interpretation of the 2017 Census of Agriculture, which is collected and maintained by the U.S. Department of Agriculture, for Sampson County in North Carolina. The infographic is intended to provide a simple, clear snapshot of local agriculture and the many ways in which it impacts local economies.
This infographic provides a visual interpretation of the 2017 Census of Agriculture, which is collected and maintained by the U.S. Department of Agriculture, for Stanly County in North Carolina. The infographic is intended to provide a simple, clear snapshot of local agriculture and the many ways in which it impacts local economies.
This infographic provides a visual interpretation of the 2017 Census of Agriculture, which is collected and maintained by the U.S. Department of Agriculture, for Yancey County in North Carolina. The infographic is intended to provide a simple, clear snapshot of local agriculture and the many ways in which it impacts local economies.
This infographic provides a visual interpretation of the 2017 Census of Agriculture, which is collected and maintained by the U.S. Department of Agriculture, for Alleghany County in North Carolina. The infographic is intended to provide a simple, clear snapshot of local agriculture and the many ways in which it impacts local economies.
This infographic provides a visual interpretation of the 2017 Census of Agriculture, which is collected and maintained by the U.S. Department of Agriculture, for Anson County in North Carolina. The infographic is intended to provide a simple, clear snapshot of local agriculture and the many ways in which it impacts local economies.
This infographic provides a visual interpretation of the 2017 Census of Agriculture, which is collected and maintained by the U.S. Department of Agriculture, for Bladen County in North Carolina. The infographic is intended to provide a simple, clear snapshot of local agriculture and the many ways in which it impacts local economies.
This infographic provides a visual interpretation of the 2017 Census of Agriculture, which is collected and maintained by the U.S. Department of Agriculture, for Camden County in North Carolina. The infographic is intended to provide a simple, clear snapshot of local agriculture and the many ways in which it impacts local economies.
This infographic provides a visual interpretation of the 2017 Census of Agriculture, which is collected and maintained by the U.S. Department of Agriculture, for Carteret County in North Carolina. The infographic is intended to provide a simple, clear snapshot of local agriculture and the many ways in which it impacts local economies.
This infographic provides a visual interpretation of the 2017 Census of Agriculture, which is collected and maintained by the U.S. Department of Agriculture, for Caswell County in North Carolina. The infographic is intended to provide a simple, clear snapshot of local agriculture and the many ways in which it impacts local economies.
This infographic provides a visual interpretation of the 2017 Census of Agriculture, which is collected and maintained by the U.S. Department of Agriculture, for Chowan County in North Carolina. The infographic is intended to provide a simple, clear snapshot of local agriculture and the many ways in which it impacts local economies.
This infographic provides a visual interpretation of the 2017 Census of Agriculture, which is collected and maintained by the U.S. Department of Agriculture, for Columbus County in North Carolina. The infographic is intended to provide a simple, clear snapshot of local agriculture and the many ways in which it impacts local economies.
This infographic provides a visual interpretation of the 2017 Census of Agriculture, which is collected and maintained by the U.S. Department of Agriculture, for Craven County in North Carolina. The infographic is intended to provide a simple, clear snapshot of local agriculture and the many ways in which it impacts local economies.
This infographic provides a visual interpretation of the 2017 Census of Agriculture, which is collected and maintained by the U.S. Department of Agriculture, for Dare County in North Carolina. The infographic is intended to provide a simple, clear snapshot of local agriculture and the many ways in which it impacts local economies.
This infographic provides a visual interpretation of the 2017 Census of Agriculture, which is collected and maintained by the U.S. Department of Agriculture, for Duplin County in North Carolina. The infographic is intended to provide a simple, clear snapshot of local agriculture and the many ways in which it impacts local economies.
This infographic provides a visual interpretation of the 2017 Census of Agriculture, which is collected and maintained by the U.S. Department of Agriculture, for Graham County in North Carolina. The infographic is intended to provide a simple, clear snapshot of local agriculture and the many ways in which it impacts local economies.
This infographic provides a visual interpretation of the 2017 Census of Agriculture, which is collected and maintained by the U.S. Department of Agriculture, for Greene County in North Carolina. The infographic is intended to provide a simple, clear snapshot of local agriculture and the many ways in which it impacts local economies.
This infographic provides a visual interpretation of the 2017 Census of Agriculture, which is collected and maintained by the U.S. Department of Agriculture, for Iredell County in North Carolina. The infographic is intended to provide a simple, clear snapshot of local agriculture and the many ways in which it impacts local economies.
This infographic provides a visual interpretation of the 2017 Census of Agriculture, which is collected and maintained by the U.S. Department of Agriculture, for Lincoln County in North Carolina. The infographic is intended to provide a simple, clear snapshot of local agriculture and the many ways in which it impacts local economies.
This infographic provides a visual interpretation of the 2017 Census of Agriculture, which is collected and maintained by the U.S. Department of Agriculture, for Macon County in North Carolina. The infographic is intended to provide a simple, clear snapshot of local agriculture and the many ways in which it impacts local economies.
This infographic provides a visual interpretation of the 2017 Census of Agriculture, which is collected and maintained by the U.S. Department of Agriculture, for Madison County in North Carolina. The infographic is intended to provide a simple, clear snapshot of local agriculture and the many ways in which it impacts local economies.
This infographic provides a visual interpretation of the 2017 Census of Agriculture, which is collected and maintained by the U.S. Department of Agriculture, for McDowell County in North Carolina. The infographic is intended to provide a simple, clear snapshot of local agriculture and the many ways in which it impacts local economies.
This infographic provides a visual interpretation of the 2017 Census of Agriculture, which is collected and maintained by the U.S. Department of Agriculture, for Scotland County in North Carolina. The infographic is intended to provide a simple, clear snapshot of local agriculture and the many ways in which it impacts local economies.
This infographic provides a visual interpretation of the 2017 Census of Agriculture, which is collected and maintained by the U.S. Department of Agriculture, for Warren County in North Carolina. The infographic is intended to provide a simple, clear snapshot of local agriculture and the many ways in which it impacts local economies.
This infographic provides a visual interpretation of the 2017 Census of Agriculture, which is collected and maintained by the U.S. Department of Agriculture, for Wayne County in North Carolina. The infographic is intended to provide a simple, clear snapshot of local agriculture and the many ways in which it impacts local economies.
This infographic provides a visual interpretation of the 2017 Census of Agriculture, which is collected and maintained by the U.S. Department of Agriculture, for Ashe County in North Carolina. The infographic is intended to provide a simple, clear snapshot of local agriculture and the many ways in which it impacts local economies.
This infographic provides a visual interpretation of the 2017 Census of Agriculture, which is collected and maintained by the U.S. Department of Agriculture, for Chatham County in North Carolina. The infographic is intended to provide a simple, clear snapshot of local agriculture and the many ways in which it impacts local economies.
This infographic provides a visual interpretation of the 2017 Census of Agriculture, which is collected and maintained by the U.S. Department of Agriculture, for Martin County in North Carolina. The infographic is intended to provide a simple, clear snapshot of local agriculture and the many ways in which it impacts local economies.
This infographic provides a visual interpretation of the 2017 Census of Agriculture, which is collected and maintained by the U.S. Department of Agriculture, for Randolph County in North Carolina. The infographic is intended to provide a simple, clear snapshot of local agriculture and the many ways in which it impacts local economies.
This infographic provides a visual interpretation of the 2017 Census of Agriculture, which is collected and maintained by the U.S. Department of Agriculture, for Moore County in North Carolina. The infographic is intended to provide a simple, clear snapshot of local agriculture and the many ways in which it impacts local economies.
This infographic provides a visual interpretation of the 2017 Census of Agriculture, which is collected and maintained by the U.S. Department of Agriculture, for Edgecombe County in North Carolina. The infographic is intended to provide a simple, clear snapshot of local agriculture and the many ways in which it impacts local economies.
